
Middle East And Africa Effervescent Tablet Market
Market Size in USD Million
 USD
319.97 Million
USD
541.60 Million
2025
2033
USD
319.97 Million
USD
541.60 Million
2025
2033
| 2026 - 2033 | |
| USD 319.97 Million | |
| USD 541.60 Million | |
| % | |
|
What is the Middle East and Africa Effervescent Tablet Market Size and Overview?
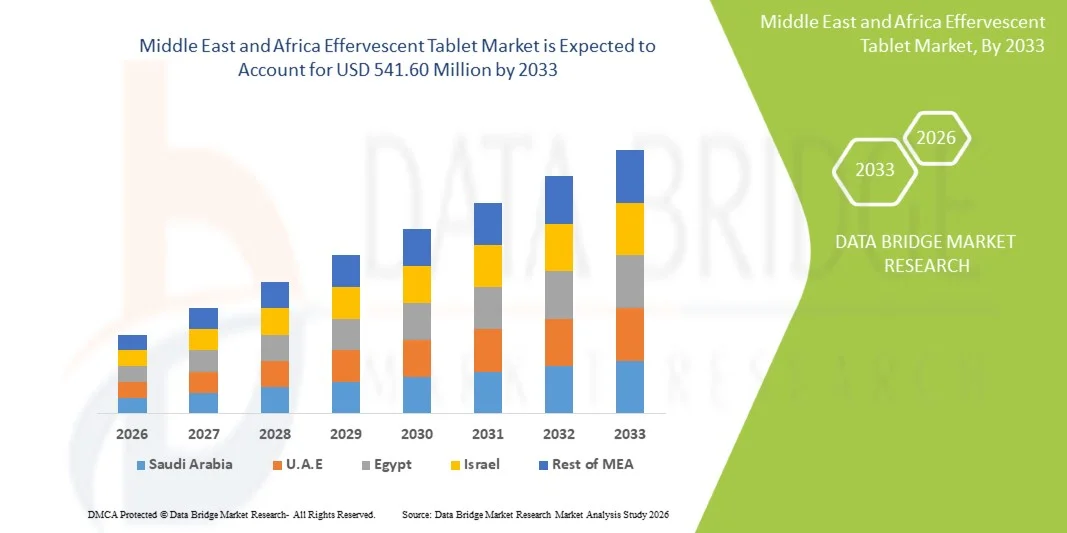
- As per Data Bridge Market Research Analysis the Middle East and Africa Effervescent Tablet Market size was valued at USD 319.97 Million in 2025 and is expected to reach USD 541.60 Million by 2033, at a CAGR of 6.80% during the forecast period
- The market growth is largely fueled by the rising preference for fast-dissolving, easy-to-consume oral dosage forms, supported by increasing consumer focus on wellness, nutrition, and preventive healthcare. Effervescent tablets are gaining traction due to their superior absorption, improved palatability, and convenience for individuals with swallowing difficulties. In addition, expanding applications in pharmaceuticals, dietary supplements, and functional beverages are contributing significantly to increased product adoption across both developed and developing regions
- Furthermore, growing demand for high-bioavailability formulations, rapid onset of action, and enhanced patient compliance is positioning effervescent tablets as a preferred alternative to conventional solid dosage forms. These converging factors—combined with innovations in flavors, packaging, and formulation technologies are accelerating the uptake of effervescent tablet solutions, thereby significantly boosting the industry's growth
Market Size & Forecast
- Middle East and Africa Market Value (2025): USD 319.97 Million in 2025
- Expected Market Value (2033): USD 541.60 Million by 2033
- Forecast CAGR (2026–2033): 6.80
Middle East and Africa Effervescent Tablet Market Analysis
- Effervescent tablets, known for their rapid dissolution, improved bioavailability, and consumer-friendly consumption format, are increasingly becoming a preferred choice across pharmaceutical, nutraceutical, and functional beverage applications. Their ease of ingestion and superior absorption rate make them highly suitable for pediatric, geriatric, and general health supplement users
- The escalating demand for effervescent tablets is primarily driven by rising health awareness, growing preference for convenient dosage forms, expanding vitamin and mineral supplement consumption, and continuous product innovations in flavors, formulation technologies, and packaging
- Saudi Arabia dominated the Middle East and Africa Effervescent Tablet Market with the largest revenue share of 36.4% in 2025, driven by rising consumer focus on preventive healthcare, increased consumption of vitamin and mineral supplements, and strong government initiatives promoting health and wellness. The country’s expanding retail pharmacy network, higher purchasing power, and growing preference for convenient, fast-dissolving formulations have significantly contributed to the strong demand for effervescent tablets. In addition, increasing penetration of international nutraceutical brands and rising online supplement sales further strengthened Saudi Arabia’s leading market position
- U.A.E. is expected to be the fastest-growing country in the Middle East and Africa Effervescent Tablet Market during the forecast period, projected to expand at an impressive CAGR of 14.8% from 2026 to 2033, supported by rapidly increasing health awareness, growth in fitness and lifestyle-oriented consumers, and the country’s strong inclination toward premium dietary supplements. The U.A.E.’s robust digital retail ecosystem, expanding medical tourism sector, and inflow of global nutraceutical companies introducing innovative effervescent formats are driving accelerated market adoption across both residents and expatriates.
- The adults segment dominated the largest market revenue share of 62.5% in 2025, driven by higher usage of effervescent supplements, pain relievers, antacids, and hydration tablets among working professionals and older adults
Report Scope and Middle East and Africa Effervescent Tablet Market Segmentation
|
Attributes |
Effervescent tablet Key Market Insights |
|
Segments Covered |
|
|
Countries Covered |
Middle East and Africa
|
|
Key Market Players |
|
|
Market Opportunities |
|
|
Value Added Data Infosets |
In addition to the insights on market scenarios such as market value, growth rate, segmentation, geographical coverage, and major players, the market reports curated by the Data Bridge Market Research also include in-depth expert analysis, patient epidemiology, pipeline analysis, pricing analysis, and regulatory framework. |
What is the Key Trend in the Middle East and Africa Effervescent Tablet Market?
“Enhanced Consumer Preference for Fast-Acting and Easy-to-Use Supplement Formats”
- A significant and rapidly strengthening trend in the Middle East and Africa Middle East and Africa Effervescent Tablet Market is the growing preference for convenient, fast-dissolving, and easy-to-consume supplement formats that support modern on-the-go lifestyles. Consumers are increasingly shifting from conventional solid tablets to effervescent forms due to their superior absorption, faster action, and improved patient compliance, particularly among individuals who face difficulty swallowing pills
- For instance, companies such as Bayer and Haleon have expanded their portfolio of immunity-boosting and multivitamin effervescent products in response to rising demand for quick-dissolve nutritional supplements across all age groups
- The trend is strongly supported by increased health consciousness and demand for functional beverages, pushing manufacturers to innovate new flavors, sugar-free formulations, and enhanced nutrient combinations that dissolve seamlessly in water
- Moreover, the effervescent format is gaining popularity in sports nutrition as athletes and fitness-focused consumers increasingly prefer hydration tablets enriched with electrolytes, minerals, and performance-enhancing nutrients
- Innovation in packaging such as moisture-resistant tubes and portable single-dose sachets is further accelerating adoption by increasing convenience and shelf-life stability
- This shift toward more user-friendly dosage forms is fundamentally reshaping consumer expectations within the nutraceutical and pharmaceutical sectors, prompting manufacturers such as GlaxoSmithKline and Emergen-C to launch new effervescent variants with improved taste profiles and faster disintegration properties
- The demand for effervescent tablets that offer superior bioavailability, refreshing consumption experience, and portability continues to rise rapidly across both wellness-driven and therapeutic segments
Middle East and Africa Effervescent Tablet Market Dynamics
Driver
“Growing Need Driven by Rising Health Awareness and Expanding Nutraceutical Consumption”
- Increasing consumer focus on immunity, general wellness, and preventive healthcare is a major driver fueling the rapid growth of the Middle East and Africa Effervescent Tablet Market across Middle East and Africa regions
- For instance, in February 2024, Bayer launched new Vitamin C and Zinc effervescent formats in selected markets to address increasing Middle East and Africa interest in daily immune support, signaling expanding opportunities for manufacturers in the nutraceutical space
- As consumers become more aware of the benefits of nutrient-rich daily supplements, effervescent tablets offer a compelling alternative due to their superior solubility, improved palatability, and more efficient nutrient uptake compared to traditional tablets or capsules
- The growing popularity of functional beverages and hydration supplements—particularly among millennials, athletes, and busy professionals—is further accelerating demand
- In addition, effervescent products provide dosage accuracy and uniform nutrient distribution, making them highly preferred in therapeutic applications such as pain relief, gastrointestinal support, and vitamin supplementation
- The ease of dissolving in water makes them ideal for elderly populations, children, and individuals with dysphagia, further expanding the consumer base
- The rising trend of self-medication and OTC supplement purchases, supported by increasing availability in retail pharmacies, health stores, and online platforms, also contributes significantly to market expansion
- Collectively, these factors are propelling the adoption of effervescent tablets across both pharmaceutical and nutraceutical categories
Restraint/Challenge
“High Production Costs and Stability Concerns Compared to Conventional Tablets”
- Despite strong market growth, high manufacturing costs and formulation complexities remain a significant restraint for the widespread adoption of effervescent tablets
- Effervescent formulations require specialized equipment, strict moisture-controlled environments, and advanced production processes to prevent premature reactions, driving up production expenses compared to regular tablets
For instance, manufacturers consistently report that maintaining stability and preventing moisture exposure during storage and distribution significantly increases material and packaging costs - Moisture sensitivity remains one of the biggest technical challenges, as effervescent tablets can degrade rapidly if exposed to humidity, forcing companies to use aluminum tubes, desiccants, or advanced barrier coatings
- These added packaging requirements increase overall product cost, making effervescent tablets less accessible to price-sensitive consumers in developing regions
- In addition, the effervescent format limits the choice of active ingredients due to compatibility issues with acids and carbonates used in effervescence reactions
- Companies must invest heavily in R&D to develop stable, pleasant-tasting formulations that maintain efficacy throughout the shelf life, further raising development costs
- Collectively, these challenges—higher production costs, moisture sensitivity, and formulation limitations—restrict broader adoption and pose ongoing barriers to market expansion
Middle East and Africa Effervescent Tablet Market Scope
The market is segmented on the basis of products, methods, type, indication, population type, application, end user, and distribution channel.
- By Products
On the basis of products, the Middle East and Africa Effervescent Tablet Market is segmented into medication and supplements. The medication segment dominated the largest market revenue share of 46.8% in 2025, driven by the rising use of effervescent formulations in pain management, gastrointestinal support, and respiratory therapies. Medications in effervescent form are preferred due to their rapid dissolution and faster absorption, which significantly enhances therapeutic onset. Patients with swallowing difficulties also prefer effervescent versions, further boosting demand. Pharmaceutical companies are increasingly reformulating conventional solid oral products into effervescent formats, driven by patient-centric drug delivery trends. The segment benefits from expanding R&D investments, improved palatability, and the ability to deliver higher drug loads efficiently. Growing adoption in hospitals and outpatient care, along with technological advancements in effervescent manufacturing, continues to strengthen medication’s dominance. In addition, increasing awareness of improved bioavailability through effervescence supports market expansion. The combination of clinical benefits, patient compliance, and broader therapeutic applications secures the segment’s leadership.
The supplements segment is anticipated to witness the fastest growth rate of 20.9% CAGR from 2026 to 2033, fueled by rising consumer preference for convenient and highly absorbable nutritional products. Effervescent supplement tablets, particularly those offering vitamins, minerals, electrolytes, and immunity boosters, are increasingly favored for their superior taste, portability, and effectiveness. The trend toward proactive wellness, expanding sports nutrition adoption, and increased consumption of functional beverages supports supplement demand. Companies are launching new effervescent multivitamins, collagen formulas, and hydration boosters targeting fitness users and working professionals. The growing retail and online penetration of supplement brands accelerates category adoption across developed and developing markets. In addition, the surge in personalized nutrition and daily supplementation routines contributes meaningfully to segment growth. Rising demand for clean-label, sugar-free, and fast-dissolving effervescent products further propels expansion, making it the fastest-growing category.
- By Methods
On the basis of methods, the Middle East and Africa Effervescent Tablet Market is segmented into dry methods and wet granulation. The dry methods segment dominated the largest market revenue share of 52.4% in 2025, driven by its cost efficiency, lower processing complexity, and ability to maintain ingredient stability. Dry methods are widely adopted for effervescent formulations containing moisture-sensitive compounds, as they minimize product degradation risk. Manufacturers prefer dry processing due to shorter production cycles, reduced need for specialized equipment, and lower solvent use. The method supports mass-scale production and is suitable for most pharmaceutical and nutraceutical effervescent tablets. Dry granulation also enhances powder flow properties and ensures uniform distribution of effervescent agents such as citric acid and sodium bicarbonate. In addition, the process is increasingly used for high-dose formulations that require precise control of active ingredient ratios. Favorable regulatory acceptability and compatibility with automated production lines further support its dominance. These factors collectively reinforce dry methods as the leading manufacturing technique.
The wet granulation segment is expected to witness the fastest CAGR of 18.6% from 2026 to 2033, driven by the rising demand for effervescent tablets with improved mechanical strength, enhanced mouthfeel, and superior dispersion properties. Wet granulation provides better granule uniformity and reduces dust formation, making it ideal for formulations requiring improved compressibility and stability. As companies innovate with complex multivitamin and combination drug formulations, wet granulation becomes essential for achieving optimal tablet integrity and dissolution profiles. The method also supports development of flavored hydration tablets and high-end supplements with enhanced sensory performance. Increasing investment in advanced granulation technologies and fluid-bed systems enables manufacturers to scale premium-quality effervescent tablets efficiently. Furthermore, demand for customized effervescent products tailored to pediatric and geriatric populations boosts adoption. These advantages collectively make wet granulation the fastest-growing production method.
- By Type
On the basis of type, the Middle East and Africa Effervescent Tablet Market is segmented into prescription and over-the-counter (OTC). The OTC segment dominated the largest market revenue share of 57.1% in 2025, driven by strong demand for vitamin supplements, energy boosters, cold & flu tablets, antacids, and hydration formulas. OTC effervescent tablets are widely preferred for their quick relief, pleasant flavors, and easy administration. Growing consumer self-care behavior, rising health consciousness, and expanding retail distribution networks play a crucial role in supporting OTC dominance. The segment benefits from frequent product innovations, such as sugar-free formulations and immunity-boosting blends. Manufacturers increasingly promote OTC effervescent products through digital marketing and e-commerce channels, further boosting visibility and accessibility. The convenience of bypassing physician consultation for common conditions makes OTC tablets highly attractive to consumers. In addition, the surge in fitness supplements and electrolyte blends reinforces strong market leadership.
The prescription segment is anticipated to witness the fastest growth rate of 16.8% CAGR from 2026 to 2033, fueled by the increasing adoption of effervescent formulations in chronic disease management and hospital-based treatments. Prescription effervescent drugs are gaining traction for conditions such as arthritis-related pain, gastrointestinal disorders, respiratory diseases, and cardiovascular health. Physicians are increasingly recommending effervescent formats due to their enhanced absorption, reduced gastrointestinal irritation, and suitability for patients with dysphagia. The segment benefits from rising drug reformulation efforts, as pharmaceutical firms convert conventional tablets into effervescent alternatives to improve therapeutic outcomes. Growing geriatric populations, who prefer easy-to-swallow medications, further support demand. Hospital formularies are also expanding their effervescent drug listings, strengthening market penetration. These factors collectively fuel the segment’s rapid growth trajectory.
- By Indication
On the basis of indication, the Middle East and Africa Effervescent Tablet Market is segmented into diuretics, pain management, gastric disorders, respiratory diseases, and others. The pain management segment dominated the market with the largest revenue share of 41.3% in 2025, driven by rising prevalence of acute and chronic pain conditions combined with growing consumer preference for fast-acting analgesics. Effervescent formulations of analgesics dissolve rapidly and provide quicker onset, making them popular among patients needing immediate relief. The segment also benefits from wide OTC availability of effervescent acetaminophen, ibuprofen, and combination analgesics. Increasing workplace stress, sedentary lifestyles, and musculoskeletal disorders drive recurring demand. In addition, sports and athletic injuries contribute significantly to market expansion. Pharmaceutical companies continue to develop enhanced formulations with better taste and faster disintegration, strengthening category leadership.
The gastric disorders segment is expected to witness the fastest CAGR of 19.4% from 2026 to 2033, propelled by increasing cases of acidity, indigestion, GERD, and lifestyle-induced gastric discomfort. Effervescent antacids and digestive aids are preferred for their rapid neutralization, improved palatability, and ease of consumption. Rising adoption among individuals with irregular eating habits, high caffeine consumption, and stress-related digestive issues accelerates demand. Companies are introducing sugar-free, mint-flavored, and fast-dissolving digestive formulas targeting both adult and senior populations. Growing consumption of spicy and processed foods in urban regions further supports category expansion. In addition, rising awareness regarding the benefits of effervescent formulations in reducing gastric irritation contributes to strong segment growth, making it the fastest-growing indication group.
- By Population Type
On the basis of population type, the Middle East and Africa Effervescent Tablet Market is segmented into children and adults. The adults segment dominated the largest market revenue share of 62.5% in 2025, driven by higher usage of effervescent supplements, pain relievers, antacids, and hydration tablets among working professionals and older adults. Adults frequently seek convenient dosage forms to manage daily wellness, fatigue, digestive issues, and immune health. Effervescent products appeal strongly due to their ease of intake, especially for adults facing swallowing difficulties. Increasing inclination toward preventive healthcare and supplement routines supports segment leadership. In addition, adult consumers show strong preference for flavored and sugar-free effervescent tablets that fit into active lifestyles. Expanding awareness of improved absorption profiles also contributes to steady adoption across various therapeutic categories.
The children segment is projected to witness the fastest growth rate of 17.9% CAGR from 2026 to 2033, driven by rising demand for effervescent multivitamins, immunity boosters, and pediatric electrolyte formulations. Effervescent tablets offer improved taste, easier consumption, and more enjoyable administration, making them suitable for young populations. With parental focus shifting toward daily nutrition and immunity enhancement, pediatric effervescent products are gaining strong momentum. Companies are increasingly launching child-friendly flavors and low-dose formulations targeting school-age children. The method’s advantage in reducing choking hazards also supports acceptance among parents and healthcare providers. New product launches tailored for growth, cognitive support, and digestive wellness further accelerate segment expansion.
- By Application
On the basis of application, the Middle East and Africa Effervescent Tablet Market is segmented into dental products, dietary supplements, pharmaceutical, and others. The dietary supplements segment dominated the largest market revenue share of 48.6% in 2025, fueled by rising Middle East and Africa adoption of daily vitamins, minerals, and functional supplements. Effervescent supplements are increasingly preferred due to enhanced absorption, pleasant taste, and rapid dispersion. Consumers seeking hydration, immunity enhancement, energy support, and general wellness show high acceptance of effervescent formats. Fitness-oriented individuals also contribute significantly to demand through electrolyte and performance supplements. Product diversification, including collagen, multivitamins, and plant-based wellness formulas, continues to support dominance. Retail pharmacies, supermarkets, and e-commerce channels further accelerate widespread adoption.
The pharmaceutical segment is expected to witness the fastest growth rate of 18.2% CAGR from 2026 to 2033, driven by the increasing utilization of effervescent formulations for chronic and acute therapies. Pharmaceutical effervescent tablets deliver improved bioavailability and rapid therapeutic onset, making them valuable across pain management, respiratory, and gastrointestinal treatments. Hospitals and clinics increasingly prefer effervescent drugs for patients with dysphagia or post-surgical recovery needs. Pharmaceutical firms are focusing on reformulating existing drugs into effervescent formats to improve patient compliance and differentiate product portfolios. Growing geriatric populations and expanding clinical applications also contribute to rapid growth.
- By End User
On the basis of end user, the Middle East and Africa Effervescent Tablet Market is segmented into hospitals, specialty clinics, home healthcare, and others. The hospitals segment dominated the largest market revenue share of 44.9% in 2025, driven by widespread use of effervescent medications in acute care settings for pain relief, gastrointestinal support, hydration, and fever management. Hospitals prefer effervescent tablets due to predictable dosing, rapid onset, and easier patient administration. Increased prevalence of chronic illnesses and surgical procedures also boosts demand. In addition, hospitals adopt effervescent forms to ensure better patient compliance and controlled therapeutic outcomes. Pharmaceutical companies supply hospitals with high-quality effervescent products meeting clinical standards, strengthening the segment’s dominance.
The home healthcare segment is anticipated to witness the fastest CAGR of 17.4% from 2026 to 2033, supported by the Middle East and Africa shift toward at-home treatment, self-care routines, and telehealth-driven medication use. Patients managing chronic conditions increasingly rely on effervescent medications due to ease of handling and faster relief. Rising consumption of at-home supplements, antacids, pain relievers, and electrolyte tablets accelerates adoption. Aging populations and expanding home-based rehabilitation also contribute to rapid segment growth. The convenience of dissolvable tablets that require no medical supervision makes them ideal for home settings.
- By Distribution Channel
On the basis of distribution channel, the Middle East and Africa Effervescent Tablet Market is segmented into retail pharmacies, drug stores, e-commerce, hypermarkets & supermarkets, and others. The retail pharmacies segment dominated the largest market revenue share of 39.7% in 2025, driven by strong consumer trust, wide availability of prescription and OTC effervescent products, and pharmacist guidance. Retail pharmacies serve as primary points of purchase for effervescent analgesics, antacids, vitamins, and hydration supplements. Their strategic locations and established distribution networks enhance accessibility. In addition, promotional programs and brand visibility within pharmacies strengthen segment leadership. The presence of trained pharmacists supports consumer decision-making and encourages repeat purchases.
The e-commerce segment is projected to witness the fastest growth rate of 22.1% CAGR from 2026 to 2033, fueled by rising online shopping behavior, digital health awareness, and the convenience of doorstep delivery. Consumers increasingly prefer purchasing effervescent supplements and medications from online platforms due to wider product variety, subscription models, and competitive pricing. Online marketplaces offer detailed product information, reviews, and personalized recommendations, enhancing purchase confidence. Growing internet penetration and the influence of health-focused e-commerce brands further accelerate adoption.
Which Region Holds the Largest Share of the Middle East and Africa Effervescent Tablet Market?
The Middle East & Africa Middle East and Africa Effervescent Tablet Market is projected to expand at a substantial CAGR throughout the forecast period, primarily driven by rising health awareness, increasing adoption of preventive healthcare, and growing consumption of vitamin and mineral supplements across the region. Expanding retail pharmacy chains, increasing penetration of international nutraceutical brands, and a rising inclination toward convenient dosage forms such as effervescent tablets are significantly supporting market growth. MEA countries are also experiencing notable expansion in wellness trends, improving healthcare access, and rising disposable incomes, contributing to greater uptake of effervescent formulations across both urban and semi-urban populations.
Saudi Arabia Middle East and Africa Effervescent Tablet Market Insight
The Saudi Arabia Middle East and Africa Effervescent Tablet Market dominated the MEA region with the largest revenue share of 36.4% in 2025, driven by rising consumer focus on preventive healthcare, increasing consumption of vitamin C, multivitamins, and electrolyte-based effervescent supplements, and strong government-led health and wellness initiatives. The country’s expanding pharmacy retail networks, higher purchasing power, and growing demand for fast-dissolving, easy-to-consume formulations continue to accelerate market growth. In addition, the rapid growth of e-commerce platforms, enhanced availability of international nutraceutical brands, and increasing awareness of immunity-boosting supplements have further strengthened Saudi Arabia’s leading position in the regional market.
U.A.E. Middle East and Africa Effervescent Tablet Market Insight
The U.A.E. Middle East and Africa Effervescent Tablet Market is expected to be the fastest-growing in the MEA region, projected to expand at a notable CAGR of 14.8% from 2026 to 2033. Growth is driven by rising health consciousness among residents and expatriates, increasing adoption of premium dietary supplements, and strong demand from fitness, wellness, and lifestyle-focused consumers. The country’s well-developed digital retail ecosystem, expanding medical tourism sector, and influx of global nutraceutical companies launching innovative effervescent formulations are boosting product adoption. Furthermore, U.A.E.’s high per-capita income, rapid urbanization, and growing preference for convenient, travel-friendly supplement formats are propelling sustained market expansion.
Which are the Top Companies in Middle East and Africa Effervescent Tablet Market?
The Effervescent tablet industry is primarily led by well-established companies, including:
- Bayer AG (Germany)
- GlaxoSmithKline plc (U.K.)
- Abbott Laboratories (U.S.)
- Boehringer Ingelheim (Germany)
- Haleon (U.K.)
- Reckitt Benckiser Group plc (U.K.)
- Prestige Consumer Healthcare Inc. (U.S.)
- Zydus Lifesciences (India)
- Cipla Ltd. (India)
- Sanofi S.A. (France)
- Novartis AG (Switzerland)
- Hermes Pharma (Germany)
- Effervescent Pharma (Italy)
- Jiangsu Hengrui Pharmaceuticals (China)
- Boryung Pharmaceutical (South Korea)
- Takeda Pharmaceutical (Japan)
- Perrigo Company plc (Ireland)
- Dr. Reddy’s Laboratories (India)
- Granules India Ltd. (India)
- Bristol Laboratories Ltd. (U.K.)
What are the Recent Developments in Middle East and Africa Effervescent Tablet Market?
- In November 2021, MyFitness launched a new effervescent supplement brand called Suprfit, introducing tablets formulated for immunity enhancement, sleep improvement, detoxification, and weight management. The launch expanded the availability of multifunctional effervescent formulations and helped push mainstream adoption of dissolvable wellness products across India
- In July 2023, Fullife Healthcare (Fast&Up) announced a strong surge in demand for effervescent supplements from pharmaceutical companies in India. The company highlighted that effervescent tablets allow higher ingredient-loading and faster absorption compared to conventional tablets. This development marked a shift where effervescent technology began moving beyond sports nutrition into mainstream medical and therapeutic applications
- In December 2024, Hermes Pharma introduced an advanced granulation technology specifically designed to improve effervescent tablet manufacturing. The new method enhances product stability, improves dissolving performance, reduces production waste, and lowers environmental impact. This technological improvement is widely viewed as a major step toward more sustainable and efficient production of effervescent medications and supplements
- In March 2025, researchers reported a major breakthrough with the creation of a “self-driving” tableting system that uses automation, robotics, and AI-based predictive models to optimize effervescent tablet formulation. This innovation is expected to reduce development time, improve ingredient uniformity, and enable faster scaling of new effervescent products, marking a technological leap in pharmaceutical manufacturing
- In June 2025, Haleon’s Jamshoro plant announced the registration of CAC Kids Effervescent Tablets for local manufacturing. This move represents a strong expansion of child-friendly effervescent formulations in emerging markets, providing easier-to-consume therapeutic options for pediatric care and strengthening the company’s regional portfolio
- In June 2025, Sirio Pharma unveiled a new range of mini effervescent tablets at a major Middle East and Africa nutrition event. These compact dissolvable tablets are designed to deliver high-dose nutrients—such as vitamin C, B-complex, magnesium, and electrolytes—in a more convenient, easy-to-swallow format. This innovation reflects the rising consumer demand for portable, rapid-dissolving supplement formats
SKU-

- Interactive Data Analysis Dashboard
- Company Analysis Dashboard for high growth potential opportunities
- Research Analyst Access for customization & queries
- Competitor Analysis with Interactive dashboard
- Latest News, Updates & Trend analysis
- Harness the Power of Benchmark Analysis for Comprehensive Competitor Tracking
Data collection and base year analysis are done using data collection modules with large sample sizes. The stage includes obtaining market information or related data through various sources and strategies. It includes examining and planning all the data acquired from the past in advance. It likewise envelops the examination of information inconsistencies seen across different information sources. The market data is analysed and estimated using market statistical and coherent models. Also, market share analysis and key trend analysis are the major success factors in the market report. To know more, please request an analyst call or drop down your inquiry.
The key research methodology used by DBMR research team is data triangulation which involves data mining, analysis of the impact of data variables on the market and primary (industry expert) validation. Data models include Vendor Positioning Grid, Market Time Line Analysis, Market Overview and Guide, Company Positioning Grid, Patent Analysis, Pricing Analysis, Company Market Share Analysis, Standards of Measurement, Global versus Regional and Vendor Share Analysis. To know more about the research methodology, drop in an inquiry to speak to our industry experts.
Data Bridge Market Research is a leader in advanced formative research. We take pride in servicing our existing and new customers with data and analysis that match and suits their goal. The report can be customized to include price trend analysis of target brands understanding the market for additional countries (ask for the list of countries), clinical trial results data, literature review, refurbished market and product base analysis. Market analysis of target competitors can be analyzed from technology-based analysis to market portfolio strategies. We can add as many competitors that you require data about in the format and data style you are looking for. Our team of analysts can also provide you data in crude raw excel files pivot tables (Fact book) or can assist you in creating presentations from the data sets available in the report.


