
Market Analysis and Insights
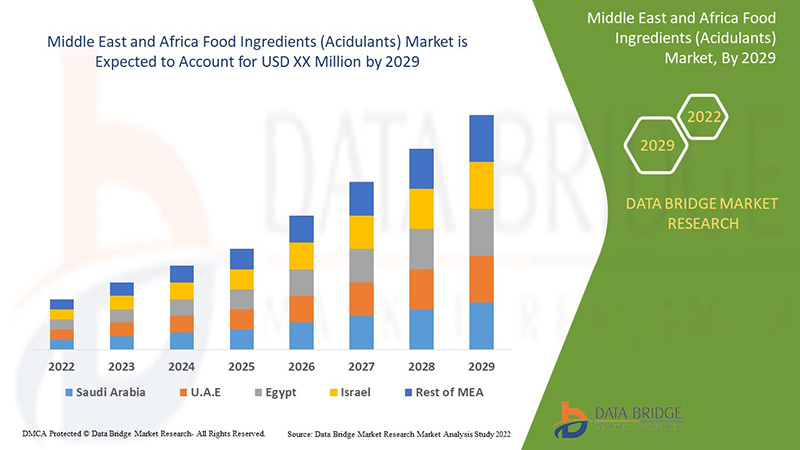
The Middle East and Africa food ingredients (acidulants) market is gaining significant growth due to the growing food & beverage industry and the rise in demand for flavored drinks and food. The increase in demand for acidulants in alcoholic beverages such as wine also boosts the growth of the Middle East and Africa food ingredients (acidulants) market. However, stringent government regulations associated with acidulants and health risks associated with some acidulants, such as phosphoric acid, are expected to restrain the market growth of the market during the forecast period.
Data Bridge Market Research analyses that the Middle East and Africa food ingredients (acidulants) market is expected to grow at a CAGR of 5.8% during the forecast period of 2022 to 2029.
|
Report Metric |
Details |
|
Forecast Period |
2022 to 2029 |
|
Base Year |
2021 |
|
Historic Years |
2020 (Customizable to 2019- 2015) |
|
Quantitative Units |
Revenue in USD Million, Pricing in USD |
|
Segments Covered |
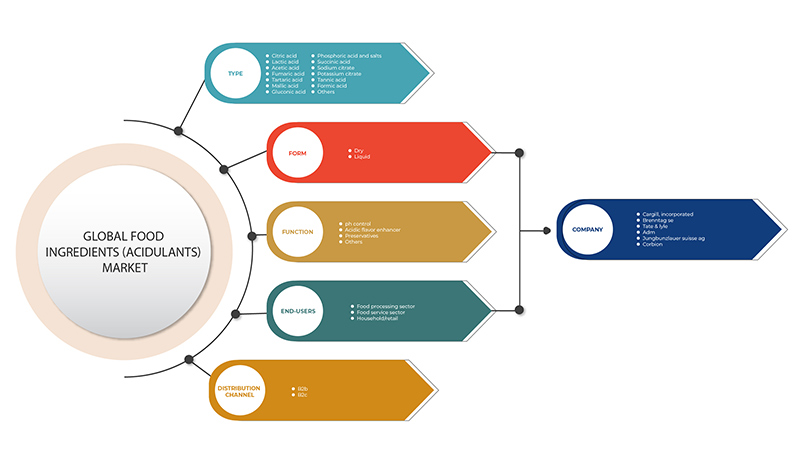
By Type (Citric Acid, Lactic Acid, Acetic Acid, Fumaric Acid, Tartaric Acid, Malic Acid, Gluconic Acid, Phosphoric Acid and Salts, Succinic Acid, Sodium Citrate, Potassium Citrate, Tannic Acid, Formic Acid, and Others), Form (Dry, and Liquid), Function (pH Control, Acidic Flavor Enhancer, Preservatives, and Others), Distribution Channel (B2B, and B2C), End-User (Food Processing Sector, Food Service Sector, and Household/Retail) |
|
Countries Covered |
Saudi Arabia, U.A.E., South Africa, Kuwait, Oman, Qatar, the Rest of the Middle East and Africa |
|
Market Players Covered |
Brenntag SE, Bartek Ingredients Inc., Corbion, Cargill, Incorporated, ADM, Tate & Lyle, Foodchem International Corporation, Richest Group, INDUSTRIAL TECNICA PECUARIA, S.A., among others |
Market Definition
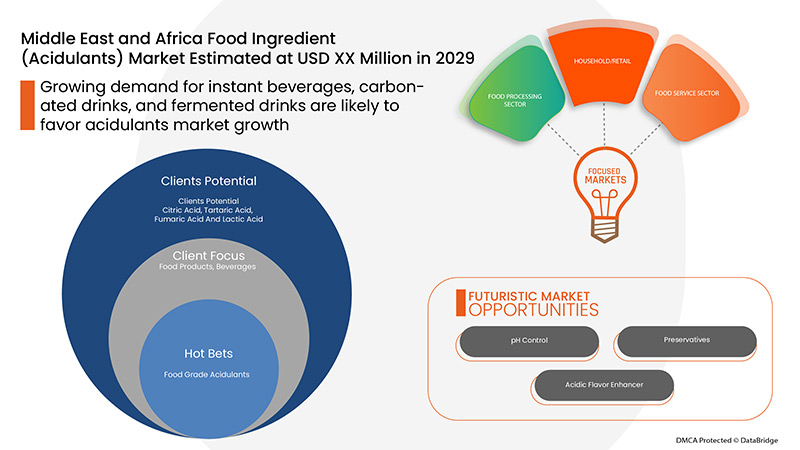
Acidulants are chemical compounds that give a tart, sour, or acidic flavor to foods or enhance the perceived sweetness of foods. Acidulants can also function as leavening agents and emulsifiers in some kinds of processed foods. Though acidulants can lower pH, they differ from acidity regulators, which are food additives specifically intended to modify food stability or enzymes within it. Typical acidulants are acetic acid (for instance, in pickles) and citric acid. Many beverages, such as colas, contain phosphoric acid. Sour candies often are formulated with malic acid. Other acidulants used in food production include fumaric acid, tartaric acid, lactic acid, and gluconic acid.
Middle East and Africa Food Ingredients (Acidulants) Market Dynamics
Drivers
- Wide use of citric acid and malic acid in emerging alcoholic as well as non-alcoholic beverage applications
In most beverages, citric acid is the first choice to be used as an acidulant. This is the specific, relatively mild to slightly sharp sourness and the refreshing effect on most of the fruit flavors. Furthermore, malic acid is used when strong flavor enhancement is expected, mostly in combination with citric acid. Besides these acidulants, phosphoric and succinic acid is also used in beverage applications. Phosphoric acid is mostly used in carbonated beverages such as Cola to bring a specific taste profile and strong effect on pH. Malic acid is commonly used in alcoholic beverages, mostly in fruity coolers and low alcohol drinks. Succinic acid is used only in instant beverages for home preparation.
For instance,
- In September 2020, according to the Wine & Spirits Trade Association, the flavored and spiced rum category grew from under 6 million bottles in 2014 to over 10 million bottles in 2019
- In September 2021, Svami announced the launch of 2 Cal Cola, India's homegrown premium cola, and Svami Salted Lemonade
Thus, to fulfill consumer demand, the demand for acidulants in the beverage manufacturing industry by beverage manufacturers is growing, adding to the growth of the market.
- Rise in demand for acidulants such as malic acid, lactic acid, and sodium lactate in the confectionery industry
Acidulants used in confectionery, such as malic acid, lactic acid, and sodium lactate, have a unique taste and flavor effects. It also boosts the impact of some aromatic flavor notes due to its volatility. In addition, nowadays, the combinations of acidulants are commonly used in confectionery. Furthermore, malic acid and fumaric acid provide more persistent sourness than other food acids at the same concentration, enhance fruit flavors, and boost the impact of high-intensity sweeteners.
Hence, the increased demand for confectionery products increases the demand for acidulants such as malic acid, lactic acid, fumaric acid, sodium lactate, and others by food manufacturers to fulfill the demands.
Opportunities
- Biological production of citric acid and acetic acid
Consumers are shifting towards sustainable products and are opting for products that are manufactured with the help of sustainable ingredients. Hence, the demand for sustainable and cost-effective and biological food ingredients (acidulants) such as citric acid and acetic acid is increasing among the manufacturers. However, bio-succinic acid production is quite difficult through a sustainable product that is microbial fermentation, although it is cost-effective.
Thus, due to the availability of a wide range of bacteria, fungi, and yeasts, biological production of acidulants can be increased, and sustainable bio-acidulants products can be offered to the global food & beverages industry, as it holds huge opportunity for food & beverages products that include biologically sustainable ingredients.
Restraints/Challenges
- Rules and regulation of food regulatory bodies on acidulants products
The rules and regulations for the approval of acidulants laid by governmental bodies ensure that the acidulants have no side effects, which may restrict the growth of the global food ingredient (acidulants) market. The rising concern related to the side effects of acidulants on health has forced the government to lay down strict rules for product approval. The acidulants may lead to elevated blood pressure, the temporary reddish coloration of the eye, and others. Therefore, the amount of acidulant used is checked properly before using it in any product. Thus, the stringent regulations for the approval process may hamper the market's growth.
Thus, the strict regulations for approval and withdrawal of acidulant products to avoid the health risks associated with it may restrict the market's growth as manufacturers may find it difficult to fulfill exactly all the regulations imposed by the government.
- Growing health concerns regarding acidulants
Acidulants are used in various food and beverage applications such as bakery, confectionery, and alcoholic and non-alcoholic beverages to enhance the taste, texture, and flavoring. However, it has some side effects that are harmful to the human body.
Thus, owing to these side effects government has implanted strict regulations for the use of acidulants that may challenge the manufacturers.
For instance,
- The Food and Drug Regulations (B.01.090, B.01.091, and B.01.092) permit the addition of phosphate salts and/or water in meat products. The permitted forms of phosphates are the maximum permitted level of use is 0.5%, calculated as sodium phosphate dibasic added to the product
Thus, the side effects related to acidulants may challenge the market's growth owing to strict regulations and safety concerns.
Post-COVID-19 Impact Middle East and Africa Food Ingredients (Aciduants) Market
Post-COVID-19, the demand for acidulants is increased due to consumer purchasing patterns and a gradual shift towards increasing the demand for acidulants among various end-users such as food & beverages and others. Due to the discontinuation of many strict mandates and restrains, manufacturers and producers can fulfill the demand for acidulants in the region. In addition, the growing trend of trying new cuisines and soft drinks and fermented drinks among the young population will propel the market's growth.
The increased demand for fermented drinks enables manufacturers to launch innovative & flavored fermented drinks, which ultimately increases the demand for acidulants, which has helped the market grow.
Recent Development
- In March 2022, Brenntag SE acquired the Israeli specialty chemicals distributor Y.S. Ashkenazi Agencies Ltd, along with its subsidiary, Biochem Trading. This acquisition represents Brenntag's entry into the Israeli market. This acquisition will increase the goodwill of the company
Middle East and Africa Food Ingredients (Aciduants) Market Scope
The Middle East and Africa food ingredients (acidulants) market is segmented into type, form, function, distribution channel, and end-user. The growth amongst these segments will help you analyze meager growth segments in the industries and provide the users with a valuable market overview and market insights to make strategic decisions to identify core market applications.
Type
- Citric Acid
- Sodium Citrate
- Potassium Citrate
- Acetic Acid
- Formic Acid
- Gluconic Acid
- Fumaric Acid
- Malic Acid
- Phosphoric Acid And Salts
- Tartaric Acid
- Lactic Acid
- Tannic Acid
- Succinic Acid
- Others
On the basis of type, the Middle East and Africa food ingredients (acidulants) market is segmented into citric acid, sodium citrate, potassium citrate, acetic acid, formic acid, gluconic acid, malic acid, phosphoric acid and salts, tartaric acid, lactic acid, tannic, fumaric acid, succinic acid, and others.
Form
- Dry
- Liquid
On the basis of form, the Middle East and Africa food ingredients (acidulants) market is segmented into dry and liquid.
Function
- pH control
- Acidic flavor enhancer
- Preservatives
- Others
On the basis of function, the Middle East and Africa food ingredients (acidulants) market is segmented into pH control, acidic flavor enhancer, preservatives, and others.
Distribution Channel
- B2B
- B2C
On the basis of distribution channel, the Middle East and Africa food ingredients (acidulants) market is segmented into B2B and B2C.
End-User
- Household/Retail
- Food Processing Sector
- Food Service Sector
On the basis of end-user, the Middle East and Africa food ingredients (acidulants) market is segmented into household/retail, food processing sector, and food service sector.
Middle East and Africa Food Ingredients (Acidulants) Market Regional Analysis/Insights
The Middle East and Africa food ingredients (acidulants) market is analyzed, and market size insights and trends are provided by country, type, form, function, end-user, and distribution channel, as referenced above.
Some of the countries covered in the Middle East and Africa food ingredients (acidulants) market report are Saudi Arabia, U.A.E., South Africa, Kuwait, Oman, Qatar, and the Rest of the Middle East and Africa.
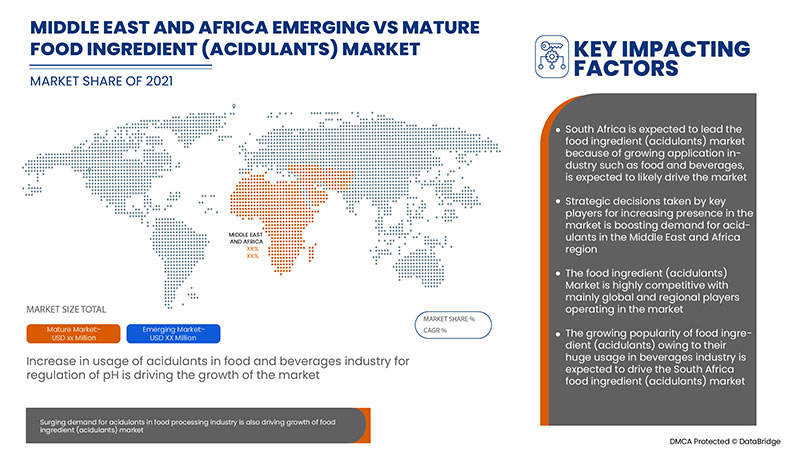
Saudi Arabia is expected to dominate the Middle East and Africa food ingredients (acidulants) market in terms of market share and revenue and will continue to grow its dominance during the forecast period. This is due to the growing demand for soft drinks and other beverages, and acidulants are used as they provide better taste and flavor to the products.
The country section of the report also provides individual market impacting factors and changes in regulations in the market that impact the current and future trends of the market. Data points, such as new and replacement sales, country demographics, disease epidemiology, and import-export tariffs, are some of the major pointers used to forecast the market scenario for individual countries. In addition, the presence and availability of the Middle East and African brands and their challenges faced due to high competition from local and domestic brands and the impact of sales channels are considered while providing forecast analysis of the country data.
Competitive Landscape and Middle East and Africa Food Ingredients (Acidulants) Market Share Analysis
The Middle East and Africa food ingredients (acidulants) market competitive landscape provides details by the competitors. Details included are company overview, company financials, revenue generated, market potential, investment in research and development, new market initiatives, Middle East & Africa presence, production sites and facilities, production capacities, company strengths and weaknesses, product launch, product width and breadth, and application dominance. The above data points provided are only related to the companies' focus on the Middle East and Africa food ingredients (acidulants) market.
Some of the major players operating in the Middle East and Africa food ingredients (acidulants) market are Brenntag SE, Bartek Ingredients Inc., Corbion, Cargill, Incorporated, ADM, Tate & Lyle, Foodchem International Corporation, Richest Group, INDUSTRIAL TECNICA PECUARIA, S.A., among others.
Research Methodology
Data collection and base year analysis are done using data collection modules with large sample sizes. The market data is analyzed and estimated using market statistical and coherent models. In addition, market share analysis and key trend analysis are the major success factors in the market report. The key research methodology used by the DBMR research team is data triangulation which involves data mining, analysis of the impact of data variables on the market, and primary (industry expert) validation. Apart from this, data models include Vendor Positioning Grid, Market Time Line Analysis, Market Overview and Guide, Company Positioning Grid, Company Market Share Analysis, Standards of Measurement, Middle East and Africa Vs Regional, and Vendor Share Analysis. Please request an analyst call in case of further inquiry.
SKU-

- Interactive Data Analysis Dashboard
- Company Analysis Dashboard for high growth potential opportunities
- Research Analyst Access for customization & queries
- Competitor Analysis with Interactive dashboard
- Latest News, Updates & Trend analysis
- Harness the Power of Benchmark Analysis for Comprehensive Competitor Tracking
Table of Content
1 INTRODUCTION
1.1 OBJECTIVES OF THE STUDY
1.2 MARKET DEFINITION
1.3 OVERVIEW OF THE MIDDLE EAST & AFRICA FOOD INGREDIENTS (ACIDULANTS) MARKET
1.4 LIMITATIONS
1.5 MARKETS COVERED
2 MARKET SEGMENTATION
2.1 MARKETS COVERED
2.2 GEOGRAPHICAL SCOPE
2.3 YEARS CONSIDERED FOR THE STUDY
2.4 CURRENCY AND PRICING
2.5 DBMR TRIPOD DATA VALIDATION MODEL
2.6 MULTIVARIATE MODELLING
2.7 TYPE LIFELINE CURVE
2.8 PRIMARY INTERVIEWS WITH KEY OPINION LEADERS
2.9 DBMR MARKET POSITION GRID
2.1 MARKET END-USER COVERAGE GRID
2.11 VENDOR SHARE ANALYSIS
2.12 SECONDARY SOURCES
2.13 ASSUMPTIONS
3 EXECUTIVE SUMMARY
4 PREMIUM INSIGHTS
4.1 BRAND ANALYSIS
4.2 FACTORS INFLUENCING PURCHASING DECISION
4.2.1 PRICING OF FOOD INGREDIENTS (ACIDULANTS)
4.2.2 QUALITY AND PURITY OF ACIDULANTS
4.2.3 CERTIFIED FOOD INGREDIENTS (ACIDULANTS)
4.3 REGULATORY OR LEGAL RISK COVERAGE
4.4 NEW PRODUCT LAUNCH STRATEGIES
4.5 PATENT ANALYSIS
4.6 RAW MATERIAL ANALYSIS – TOP 10 ACIDULANTS
4.6.1 CITRIC ACID
4.6.2 ACETIC ACID
4.6.3 SODIUM CITRATE
4.6.4 LACTIC ACID
4.6.5 FUMARIC ACID
4.6.6 TARTARIC ACID
4.6.7 MALIC ACID
4.6.8 GLUCONIC ACID
4.6.9 PHOSPHORIC ACID AND SALT
4.7 RISK ANALYSIS (LIQUIDITY) – MAJOR PLAYERS
4.8 RISK ANALYSIS OF ACIDULANTS
4.8.1 CITRIC ACID
4.8.2 SODIUM CITRATE
4.8.3 ACETIC ACID
4.8.4 SUCCINIC ACID
4.8.5 MALIC ACID
4.8.6 TARTARIC ACID
4.8.7 POTASSIUM CITRATE
4.8.8 GLUCONIC ACID
4.8.9 FUMARIC ACID
4.8.10 LACTIC ACID
4.8.11 TANNIC ACID
4.8.12 FORMIC ACID
4.8.13 PHOSPHORIC ACID AND SALTS
4.9 RUSSIA AND UKRAINE WAR IMPACT
4.9.1 COUNTRIES THAT ARE LIKELY TO BE IMPACTED THE MOST –
4.9.2 RISK OF CIVIL UNREST
4.1 SUPPLY CHAIN OF MIDDLE EAST & AFRICA FOOD INGREDIENTS (ACIDULANTS) MARKET
4.10.1 RAW MATERIAL PROCUREMENT
4.10.2 FOOD INGREDIENT (ACIDULANTS) PRODUCTION/PROCESSING
4.10.3 DISTRIBUTION
4.10.4 END-USERS
4.11 SUPPLIER DEEP DIVE – PART 1
4.12 PORTER'S FIVE FORCES ANALYSIS FOR CITRIC ACID-
4.13 PORTER'S FIVE FORCES ANALYSIS FOR LACTIC ACID-
4.14 PORTER'S FIVE FORCES ANALYSIS FOR ACETIC ACID-
4.15 PORTER'S FIVE FORCES ANALYSIS FOR FUMARIC ACID-
4.16 PORTER'S FIVE FORCES ANALYSIS FOR TARTARIC ACID-
4.17 PORTER'S FIVE FORCES ANALYSIS FOR MALIC ACID-
4.18 PORTER'S FIVE FORCES ANALYSIS FOR GLUCONIC ACID-
4.19 PORTER'S FIVE FORCES ANALYSIS FOR PHOSPHORIC ACID AND SALT-
4.2 PORTER'S FIVE FORCES ANALYSIS FOR SUCCINIC ACID-
4.21 PORTER'S FIVE FORCES ANALYSIS FOR SODIUM CITRATE –
4.22 SUPPLIERS DEEP DIVE – PART 2
4.22.1 PRODUCTION LOCATIONS
4.22.2 SUPPLIER SPECIFIC RISKS/OPPORTUNITIES
4.22.3 MARKETS THEY SELL TO
4.22.4 SUPPLIER SPECIFIC RISKS/OPPORTUNITIES
4.22.5 MARKETS THEY SELL TO
4.22.6 PRODUCTION LOCATIONS
4.23 ADM
4.23.1 PRODUCTION LOCATIONS
4.23.2 SUPPLIER SPECIFIC RISKS/OPPORTUNITIES
4.23.3 MARKETS THEY SELL TO
4.24 CORBION N.V
4.24.1 PRODUCTION LOCATIONS
4.24.2 SUPPLIER SPECIFIC RISKS/OPPORTUNITIES
4.24.3 MARKETS THEY SELL TO
4.25 TATE & LYLE
4.25.1 PRODUCTION LOCATIONS
4.25.2 SUPPLIER SPECIFIC RISKS/OPPORTUNITIES
4.25.3 MARKETS THEY SELL TO
4.26 JUNGBUNZLAUER SUISSE AG
4.26.1 PRODUCTION LOCATIONS
4.26.2 SUPPLIER SPECIFIC RISKS/OPPORTUNITIES
4.26.3 MARKETS THEY SELL TO
4.27 BARTEK INGREDIENTS INC.
4.27.1 PRODUCTION LOCATIONS
4.27.2 SUPPLIER SPECIFIC RISKS/OPPORTUNITIES
4.27.3 MARKETS THEY SELL TO
4.28 DAIRYCHEM
4.28.1 PRODUCTION LOCATIONS
4.28.2 SUPPLIER SPECIFIC RISKS/OPPORTUNITIES
4.28.3 MARKETS THEY SELL TO
4.29 WEIANG ENSIGN INDUSTRY CO.,LTD.
4.29.1 PRODUCTION LOCATIONS
4.29.2 SUPPLIER SPECIFIC RISKS/OPPORTUNITIES
4.29.3 MARKETS THEY SELL TO
4.3 INDUSTRIAL TECNICA PECUARIA, S.A.
4.30.1 PRODUCTION LOCATIONS
4.30.2 SUPPLIER SPECIFIC RISKS/OPPORTUNITIES
4.30.3 MARKETS THEY SELL TO
4.31 PRODUCTION CAPACITY – TOP FIVE PLAYERS
4.32 PRICING ANALYSIS FOR FOOD INGREDIENTS (ACIDULANTS)
4.33 SWOT ANALYSIS – TOP 10 ACIDULANTS
4.33.1 CITRIC ACID –
4.33.2 ACETIC ACID –
4.33.3 SODIUM CITRATE –
4.33.4 SUCCINIC ACID –
4.33.5 LACTIC ACID –
4.33.6 FUMARIC ACID –
4.33.7 TARTARIC ACID –
4.33.8 MALIC ACID –
4.33.9 GLUCONIC ACID –
4.33.10 PHOSPHORIC ACID AND SALTS -
5 REGULATIONS:
6 MARKET OVERVIEW
6.1 DRIVERS
6.1.1 GROWING DEMAND FOR CONVENIENCE FOOD PRODUCTS IS LIKELY TO FAVOR FOOD ACIDULANTS INDUSTRY GROWTH
6.1.2 WIDE USE OF CITRIC ACID AND MALIC ACID IN EMERGING ALCOHOLIC AS WELL AS NON-ALCOHOLIC BEVERAGE APPLICATIONS
6.1.3 RISE IN DEMAND FOR ACIDULANTS SUCH AS MALIC ACID, LACTIC ACID, AND SODIUM LACTATE IN THE CONFECTIONERY INDUSTRY
6.1.4 GROWING DEMAND FOR INSTANT BEVERAGES, CARBONATED DRINKS, AND FERMENTED DRINKS IS LIKELY TO FAVOR ACIDULANTS MARKET GROWTH
6.2 RESTRAINTS:
6.2.1 RULES AND REGULATION OF FOOD REGULATORY BODIES ON ACIDULANTS PRODUCTS
6.2.2 ISSUES ARISING DUE TO OVER USAGE OF PHOSPHATE-BASED PRODUCTS
6.3 OPPORTUNITIES
6.3.1 INCREASING DEMAND FOR ACIDULANTS FROM THE RISING FOOD PROCESSING INDUSTRY IN EMERGING ECONOMIES SUCH AS INDIA AND CHINA
6.3.2 BIOLOGICAL PRODUCTION OF CITRIC ACID AND ACETIC ACID
6.4 CHALLENGES
6.4.1 GROWING HEALTH CONCERNS REGARDING ACIDULANTS
6.4.2 HIGH PRICES OF ACIDULANTS
7 IMPACT OF COVID-19 ON THE MIDDLE EAST & AFRICA FOOD INGREDIENTS (ACIDULANTS) MARKET
7.1 IMPACT ON DEMAND AND SUPPLY CHAIN
7.2 IMPACT ON PRICE
7.3 CONCLUSION
8 MIDDLE EAST & AFRICA FOOD INGREDIENTS (ACIDULANTS) MARKET, BY TYPE
8.1 OVERVIEW
8.2 CITRIC ACID
8.3 LACTIC ACID
8.4 ACETIC ACID
8.5 FUMARIC ACID
8.6 TARTARIC ACID
8.7 MALLIC ACID
8.8 GLUCONIC ACID
8.9 PHOSPHORIC ACID
8.1 SUCCINIC ACID
8.11 SODIUM CITRATE AND SALT
8.12 POTASSIUM CITRATE AND SALT
8.13 TANNIC ACID AND SALT
8.14 FORMIC ACID AND SALT
8.15 OTHERS
9 MIDDLE EAST & AFRICA FOOD INGREDIENTS (ACIDULANTS) MARKET, BY FORM
9.1 OVERVIEW
9.2 DRY
9.3 LIQUID
10 MIDDLE EAST & AFRICA FOOD INGREDIENTS (ACIDULANTS) MARKET, BY FUNCTION
10.1 OVERVIEW
10.2 PH CONTROL
10.3 ACIDIC FLAVOR ENHANCER
10.4 PRESERVATIVES
10.5 OTHERS
11 MIDDLE EAST & AFRICA FOOD INGREDIENTS (ACIDULANTS) MARKET, BY DISTRIBUTION CHANNEL
11.1 OVERVIEW
11.2 B2B
11.2.1 WHOLESALERS
11.2.2 ONLINE
11.3 B2C
11.3.1 SUPERMARKET
11.3.2 ONLINE
11.3.3 HYPERMARKET
11.3.4 DEPARTMENTAL STORES
11.3.5 SPECIALTY STORES
11.3.6 OTHERS
12 MIDDLE EAST & AFRICA FOOD INGREDIENTS (ACIDULANTS) MARKET, BY END-USER
12.1 OVERVIEW
12.2 FOOD PROCESSING SECTOR
12.2.1 FOOD
12.2.1.1 PROCESSED MEAT PRODUCTS
12.2.1.1.1 POULTRY
12.2.1.1.2 PORK
12.2.1.1.3 BEEF
12.2.1.1.4 OTHERS
12.2.1.2 DAIRY PRODUCTS
12.2.1.2.1 CHEESE
12.2.1.2.2 MILK-POWDER
12.2.1.2.3 ICE CREAM
12.2.1.2.4 SPREADS
12.2.1.2.5 OTHERS
12.2.1.3 CONVENIENCE FOOD
12.2.1.3.1 READY TO EAT PRODUCTS
12.2.1.3.2 SOUPS & SAUCES
12.2.1.3.3 SEASONING & DRESSING
12.2.1.3.4 NOODLES & PASTA
12.2.1.3.5 OTHERS
12.2.1.4 BAKERY
12.2.1.4.1 CAKES & PASTRIES
12.2.1.4.2 BREAD
12.2.1.4.3 BISCUITS & COOKIES
12.2.1.4.4 MUFFINS
12.2.1.4.5 OTHERS
12.2.1.5 CONFECTIONERY
12.2.1.5.1 CHOCOLATE
12.2.1.5.2 GUMS & JELLY
12.2.1.5.3 HARD & SOFT CANDY
12.2.1.5.4 CREAM FILLINGS
12.2.1.5.5 OTHERS
12.2.1.5.6 SEAFOOD PRODUCTS
12.2.1.5.7 PROCESSED FOOD
12.2.1.5.8 SPORTS NUTRITION
12.2.1.5.9 DIETARY SUPPLEMENTS
12.2.1.5.10 INFANT FORMULA
12.2.1.6 BEVERAGES
12.2.1.6.1 NON-ALCOHOLIC BEVERAGES
12.2.1.6.1.1 RTD
12.2.1.6.1.2 FRUIT JUICES
12.2.1.6.1.3 SOFT DRINKS
12.2.1.6.1.4 DAIRY DRINKS
12.2.1.6.1.5 FLAVORED DRINKS
12.2.1.6.1.6 OTHERS
12.2.1.6.1.7 ALCOHOLIC BEVERAGES
12.3 FOOD SERVICE SECTOR
12.3.1 RESTAURANTS
12.3.2 CAFÉS
12.3.3 HOTELS
12.3.4 CANTEEN/CAFETERIA
12.3.5 CLOUD KITCHEN
12.4 HOUSEHOLD/RETAIL
13 MIDDLE EAST & AFRICA FOOD INGREDIENTS (ACIDULANTS) MARKET, BY REGION
13.1 MIDDLE EAST AND AFRICA
13.1.1 SAUDI ARABIA
13.1.2 U.A.E.
13.1.3 SOUTH AFRICA
13.1.4 KUWAIT
13.1.5 OMAN
13.1.6 QATAR
13.1.7 REST OF MIDDLE-EAST & AFRICA
14 MIDDLE EAST & AFRICA FOOD INGREDIENT (ACIDULANTS) MARKET, COMPANY LANDSCAPE
14.1 COMPANY SHARE ANALYSIS: MIDDLE EAST & AFRICA
15 COMPANY PROFILE
15.1 CARGILL, INCORPORATED
15.1.1 COMPANY SNAPSHOT
15.1.2 REVENUE ANALYSIS
15.1.3 COMPANY SHARE ANALYSIS
15.1.4 PRODUCT PORTFOLIO
15.1.5 RECENT DEVELOPMENTS
15.2 TATE & LYLE
15.2.1 COMPANY SNAPSHOT
15.2.2 REVENUE ANALYSIS
15.2.3 COMPANY SHARE ANALYSIS
15.2.4 PRODUCT PORTFOLIO
15.2.5 RECENT DEVELOPMENTS
15.3 ADM
15.3.1 COMPANY SNAPSHOT
15.3.2 REVENUE ANALYSIS
15.3.3 COMPANY SHARE ANALYSIS
15.3.4 PRODUCT PORTFOLIO
15.3.5 RECENT DEVELOPMENTS
15.4 JUNGBUNZLAUER SUISSE AG
15.4.1 COMPANY SNAPSHOT
15.4.2 COMPANY SHARE ANALYSIS
15.4.3 PRODUCT PORTFOLIO
15.4.4 RECENT DEVELOPMENTS
15.5 BRENNTAG SE
15.5.1 COMPANY SNAPSHOT
15.5.2 REVENUE ANALYSIS
15.5.3 COMPANY SHARE ANALYSIS
15.5.4 PRODUCT PORTFOLIO
15.5.5 RECENT DEVELOPMENTS
15.6 ARIHANT CHEMICALS
15.6.1 COMPANY SNAPSHOT
15.6.2 PRODUCT PORTFOLIO
15.6.3 RECENT DEVELOPMENTS
15.7 ARSHINE PHARMACEUTICAL CO.
15.7.1 COMPANY SNAPSHOT
15.7.2 PRODUCT PORTFOLIO
15.7.3 RECENT DEVELOPMENT
15.8 BARTEK INGREDIENTS INC.
15.8.1 COMPANY SNAPSHOT
15.8.2 PRODUCT PORTFOLIO
15.8.3 RECENT DEVELOPMENTS
15.9 CHEMVERA SPECIALTY CHEMICALS PVT. LTD.
15.9.1 COMPANY SNAPSHOT
15.9.2 PRODUCT PORTFOLIO
15.9.3 RECENT DEVELOPMENT
15.1 CORBION
15.10.1 COMPANY SNAPSHOT
15.10.2 REVENUE ANALYSIS
15.10.3 PRODUCT PORTFOLIO
15.10.4 RECENT DEVELOPMENTS
15.11 DAIRYCHEM
15.11.1 COMPANY SNAPSHOT
15.11.2 PRODUCT PORTFOLIO
15.11.3 RECENT DEVELOPMENTS
15.12 DIRECT FOOD INGREDIENTS LTD
15.12.1 COMPANY SNAPSHOT
15.12.2 PRODUCT PORTFOLIO
15.12.3 RECENT DEVELOPMENT
15.13 FBC INDUSTRIES
15.13.1 COMPANY SNAPSHOT
15.13.2 PRODUCT PORTFOLIO
1.13.3 RECENT DEVELOPMENTS 306
15.14 FOODCHEM INTERNATIONAL CORPORATION
15.14.1 COMPANY SNAPSHOT
15.14.2 PRODUCT PORTFOLIO
15.14.3 RECENT DEVELOPMENT
15.15 HAWKINS WATTS LIMITED
15.15.1 COMPANY SNAPSHOT
15.15.2 PRODUCT PORTFOLIO
15.15.3 RECENT DEVELOPMENTS
15.16 INDUSTRIAL TECNICA PECUARIA, S.A.
15.16.1 COMPANY SNAPSHOT
15.16.2 PRODUCT PORTFOLIO
15.16.3 RECENT DEVELOPMENT
15.17 INNOVA CORPORATE
15.17.1 COMPANY SNAPSHOT
15.17.2 PRODUCT PORTFOLIO
15.17.3 RECENT DEVELOPMENTS
15.18 RICHEST GROUP
15.18.1 COMPANY SNAPSHOT
15.18.2 PRODUCT PORTFOLIO
15.18.3 RECENT DEVELOPMENT
15.19 SUNTRAN.CN
15.19.1 COMPANY SNAPSHOT
15.19.2 PRODUCT PORTFOLIO
15.19.3 RECENT DEVELOPMENTS
15.2 WEIFANG ENSIGN INDUSTRY CO.,LTD
15.20.1 COMPANY SNAPSHOT
15.20.2 PRODUCT PORTFOLIO
15.20.3 RECENT DEVELOPMENT
16 QUESTIONNAIRE
17 RELATED REPORTS
List of Table
TABLE 1 REGULATORY OR LEGAL RISK COVERAGE FRAMEWORK
TABLE 2 MICROORGANISMS USED FOR THE PRODUCTION OF CITRIC ACID
TABLE 3 COMPARISON OF CITRIC ACID PRODUCTION FROM THE VARIOUS SUBSTRATES USING Y. LIPOLYTICA STRAINS
TABLE 4 CITRIC ACID APPLICATION IN DIFFERENT FOOD AND BEVERAGES INDUSTRY
TABLE 5 MICROORGANISMS USED TO PRODUCE ACETIC ACID
TABLE 6 ACETIC ACID APPLICATION IN DIFFERENT FOOD AND BEVERAGES INDUSTRY
TABLE 7 MICROORGANISMS USED FOR PRODUCING SODIUM CITRATE
TABLE 8 SODIUM CITRATE APPLICATION IN DIFFERENT FOOD AND BEVERAGES INDUSTRY
TABLE 9 MICROORGANISMS USED FOR BIO-SUCCINIC ACID PRODUCTION
TABLE 10 SUCCINIC ACID APPLICATION IN THE FOOD AND BEVERAGES INDUSTRY
TABLE 11 MICROORGANISMS USED TO PRODUCE LACTIC ACID-
TABLE 12 COMPARISON OF DIFFERENT STRAINS AND SUBSTRATES FOR LACTIC ACID PRODUCTION
TABLE 13 LACTIC ACID APPLICATION IN DIFFERENT FOOD AND BEVERAGES INDUSTRY-
TABLE 14 MICROORGANISMS USED IN THE PRODUCTION OF FUMARIC ACID
TABLE 15 FUMARIC ACID APPLICATION IN DIFFERENT FOOD AND BEVERAGES INDUSTRY-
TABLE 16 TARTARIC ACID APPLICATION IN DIFFERENT FOOD AND BEVERAGES INDUSTRY
TABLE 17 MALIC ACID APPLICATION IN DIFFERENT FOOD AND BEVERAGES INDUSTRY
TABLE 18 APPLICATIONS OF GLUCONIC ACID IN DIFFERENT FOOD AND BEVERAGES INDUSTRY-
TABLE 19 PHOSPHORIC ACID AND SALTS APPLICATION IN DIFFERENT FOOD AND BEVERAGES INDUSTRY
TABLE 20 RAW MATERIAL FOR DIFFERENT FOOD INGREDIENTS (ACIDULANTS)-
TABLE 21 MARKET SHARE OF CITRIC ACID
TABLE 22 MARKET SHARE OF LACTIC ACID
TABLE 23 MARKET SHARE OF FUMARIC ACID
TABLE 24 MARKET SHARE OF TARTARIC ACID
TABLE 25 MARKET SHARE OF MALIC ACID
TABLE 26 CATEGORY AND THEIR FUNCTIONALITY
TABLE 27 ACIDULANTS IN VARIOUS FOOD FUNCTIONALITY
TABLE 28 ACIDULANTS PRODUCTS AND THEIR APPLICATIONS
TABLE 29 MIDDLE EAST & AFRICA AVERAGE SELLING PRICES OF ACIDULANTS
TABLE 30 THE BELOW TABLE SHOWS THE ACIDULANTS AND THEIR APPLICATIONS IN BEVERAGES
TABLE 31 THE RECOMMENDED DIETARY ALLOWANCE (RDA) FOR PHOSPHORUS IS THE FOLLOWING:
TABLE 32 THE TABLE BELOW SHOWS CITRIC ACID-PRODUCING MICROORGANISMS AND THEIR SPECIES:
TABLE 33 BELOW TABLE SHOWS THE SIDE EFFECTS OF ACIDULANTS:
TABLE 34 MIDDLE EAST & AFRICA FOOD INGREDIENTS (ACIDULANTS) MARKET, BY TYPE, 2020-2029 (USD MILLION)
TABLE 35 MIDDLE EAST & AFRICA FOOD INGREDIENTS (ACIDULANTS) MARKET, BY TYPE, 2020-2029 (MILLION TONS)
TABLE 36 MIDDLE EAST & AFRICA CITRIC ACID IN FOOD INGREDIENTS (ACIDULANTS) MARKET, BY REGION, 2020-2029 (USD MILLION)
TABLE 37 MIDDLE EAST & AFRICA LACTIC ACID IN FOOD INGREDIENTS (ACIDULANTS) MARKET, BY REGION, 2020-2029 (USD MILLION)
TABLE 38 MIDDLE EAST & AFRICA ACETIC ACID IN FOOD INGREDIENTS (ACIDULANTS) MARKET, BY REGION, 2020-2029 (USD MILLION)
TABLE 39 MIDDLE EAST & AFRICA FUMARIC ACID IN FOOD INGREDIENTS (ACIDULANTS) MARKET, BY REGION, 2020-2029 (USD MILLION)
TABLE 40 MIDDLE EAST & AFRICA TARTARIC ACID IN FOOD INGREDIENTS (ACIDULANTS) MARKET, BY REGION, 2020-2029 (USD MILLION)
TABLE 41 MIDDLE EAST & AFRICA MALLIC ACID IN FOOD INGREDIENTS (ACIDULANTS) MARKET, BY REGION, 2020-2029 (USD MILLION)
TABLE 42 MIDDLE EAST & AFRICA GLUCONIC ACID IN FOOD INGREDIENTS (ACIDULANTS) MARKET, BY REGION, 2020-2029 (USD MILLION)
TABLE 43 MIDDLE EAST & AFRICA PHOSPHORIC ACID IN FOOD INGREDIENTS (ACIDULANTS) MARKET, BY REGION, 2020-2029 (USD MILLION)
TABLE 44 MIDDLE EAST & AFRICA SUCCINIC ACID IN FOOD INGREDIENTS (ACIDULANTS) MARKET, BY REGION, 2020-2029 (USD MILLION)
TABLE 45 MIDDLE EAST & AFRICA SODIUM CITRATE AND SALT IN FOOD INGREDIENTS (ACIDULANTS) MARKET, BY REGION, 2020-2029 (USD MILLION)
TABLE 46 MIDDLE EAST & AFRICA POTASSIUM CITRATE AND SALT IN FOOD INGREDIENTS (ACIDULANTS) MARKET, BY REGION, 2020-2029 (USD MILLION)
TABLE 47 MIDDLE EAST & AFRICA TANNIC ACID AND SALT IN FOOD INGREDIENTS (ACIDULANTS) MARKET, BY REGION, 2020-2029 (USD MILLION)
TABLE 48 MIDDLE EAST & AFRICA FORMIC ACID AND SALT IN FOOD INGREDIENTS (ACIDULANTS) MARKET, BY REGION, 2020-2029 (USD MILLION)
TABLE 49 MIDDLE EAST & AFRICA OTHERS IN FOOD INGREDIENTS (ACIDULANTS) MARKET, BY REGION, 2020-2029 (USD MILLION)
TABLE 50 MIDDLE EAST & AFRICA FOOD INGREDIENTS (ACIDULANTS) MARKET, BY FORM, 2020-2029 (USD MILLION)
TABLE 51 THE TABLE BELOW SHOWS THE FUNCTIONS OF DIFFERENT ACIDULANTS IN SOLID FORM:
TABLE 52 MIDDLE EAST & AFRICA DRY IN FOOD INGREDIENTS (ACIDULANTS) MARKET, BY REGION, 2020-2029 (USD MILLION)
TABLE 53 THE BELOW TABLE SHOWS THE FUNCTIONS OF LIQUID ACIDULANTS IN THE FOOD PROCESSING INDUSTRY:
TABLE 54 MIDDLE EAST & AFRICA LIQUID IN FOOD INGREDIENTS (ACIDULANTS) MARKET, BY REGION, 2020-2029 (USD MILLION)
TABLE 55 MIDDLE EAST & AFRICA FOOD INGREDIENTS (ACIDULANTS) MARKET, BY FUNCTION, 2020-2029 (USD MILLION)
TABLE 56 MIDDLE EAST & AFRICA PH CONTROL IN FOOD INGREDIENTS (ACIDULANTS) MARKET, BY REGION, 2020-2029 (USD MILLION)
TABLE 57 MIDDLE EAST & AFRICA ACIDIC FLAVOR ENHANCER IN FOOD INGREDIENTS (ACIDULANTS) MARKET, BY REGION, 2020-2029 (USD MILLION)
TABLE 58 MIDDLE EAST & AFRICA PRESERVATIVES IN FOOD INGREDIENTS (ACIDULANTS) MARKET, BY REGION, 2020-2029 (USD MILLION)
TABLE 59 MIDDLE EAST & AFRICA OTHERS IN FOOD INGREDIENTS (ACIDULANTS) MARKET, BY REGION, 2020-2029 (USD MILLION)
TABLE 60 MIDDLE EAST & AFRICA FOOD INGREDIENTS (ACIDULANTS) MARKET, BY DISTRIBUTION CHANNEL, 2020-2029 (USD MILLION)
TABLE 61 MIDDLE EAST & AFRICA B2B IN FOOD INGREDIENTS (ACIDULANTS) MARKET, BY REGION, 2020-2029 (USD MILLION)
TABLE 62 MIDDLE EAST & AFRICA B2B IN FOOD INGREDIENTS (ACIDULANTS) MARKET, BY TYPE, 2020-2029 (USD MILLION)
TABLE 63 MIDDLE EAST & AFRICA B2C IN FOOD INGREDIENTS (ACIDULANTS) MARKET, BY REGION, 2020-2029 (USD MILLION)
TABLE 64 MIDDLE EAST & AFRICA B2C IN FOOD INGREDIENTS (ACIDULANTS) MARKET, BY TYPE, 2020-2029 (USD MILLION)
TABLE 65 MIDDLE EAST & AFRICA FOOD INGREDIENTS (ACIDULANTS) MARKET, BY END-USER, 2020-2029 (USD MILLION)
TABLE 66 MIDDLE EAST & AFRICA FOOD PROCESSING SECTOR IN FOOD INGREDIENTS (ACIDULANTS) MARKET, BY REGION, 2020-2029 (USD MILLION)
TABLE 67 MIDDLE EAST & AFRICA FOOD PROCESSING SECTOR IN FOOD INGREDIENTS (ACIDULANTS) MARKET, BY END USER, 2020-2029 (USD MILLION)
TABLE 68 MIDDLE EAST & AFRICA FOOD IN FOOD INGREDIENTS (ACIDULANTS) MARKET, BY TYPE, 2020-2029 (USD MILLION)
TABLE 69 MIDDLE EAST & AFRICA PROCESSED MEAT PRODUCTS IN FOOD INGREDIENTS (ACIDULANTS) MARKET, BY TYPE, 2020-2029 (USD MILLION)
TABLE 70 MIDDLE EAST & AFRICA DAIRY PRODUCTS IN FOOD INGREDIENTS (ACIDULANTS) MARKET, BY TYPE, 2020-2029 (USD MILLION)
TABLE 71 MIDDLE EAST & AFRICA CONVENIENCE FOOD IN FOOD INGREDIENTS (ACIDULANTS) MARKET, BY TYPE, 2020-2029 (USD MILLION)
TABLE 72 MIDDLE EAST & AFRICA BAKERY IN FOOD INGREDIENTS (ACIDULANTS) MARKET, BY TYPE, 2020-2029 (USD MILLION)
TABLE 73 MIDDLE EAST & AFRICA CONFECTIONERY IN FOOD INGREDIENTS (ACIDULANTS) MARKET, BY TYPE, 2020-2029 (USD MILLION)
TABLE 74 MIDDLE EAST & AFRICA BEVERAGES IN FOOD INGREDIENTS (ACIDULANTS) MARKET, BY TYPE, 2020-2029 (USD MILLION)
TABLE 75 MIDDLE EAST & AFRICA NON-ALCOHOLIC BEVERAGES IN FOOD INGREDIENTS (ACIDULANTS) MARKET, BY TYPE, 2020-2029 (USD MILLION)
TABLE 76 MIDDLE EAST & AFRICA FOOD SERVICE SECTOR IN FOOD INGREDIENTS (ACIDULANTS) MARKET, BY REGION, 2020-2029 (USD MILLION)
TABLE 77 MIDDLE EAST & AFRICA FOOD SERVICE SECTOR IN FOOD INGREDIENTS (ACIDULANTS) MARKET, BY TYPE, 2020-2029 (USD MILLION)
TABLE 78 MIDDLE EAST & AFRICA HOUSEHOLD/RETAIL IN FOOD INGREDIENTS (ACIDULANTS) MARKET, BY REGION, 2020-2029 (USD MILLION)
TABLE 79 MIDDLE EAST & AFRICA FOOD INGREDIENTS (ACIDULANTS) MARKET, BY COUNTRY, 2020-2029 (USD MILLION)
TABLE 80 MIDDLE EAST AND AFRICA FOOD INGREDIENTS (ACIDULANTS) MARKET, BY TYPE, 2020-2029 (USD MILLION)
TABLE 81 MIDDLE EAST AND AFRICA FOOD INGREDIENTS (ACIDULANTS) MARKET, BY TYPE, 2020-2029 (TONS)
TABLE 82 MIDDLE EAST AND AFRICA FOOD INGREDIENTS (ACIDULANTS) MARKET, BY FORM, 2020-2029 (USD MILLION)
TABLE 83 MIDDLE EAST AND AFRICA FOOD INGREDIENTS (ACIDULANTS) MARKET, BY FUNCTION, 2020-2029 (USD MILLION)
TABLE 84 MIDDLE EAST AND AFRICA FOOD INGREDIENTS (ACIDULANTS) MARKET, BY DISTRIBUTION CHANNEL, 2020-2029 (USD MILLION)
TABLE 85 MIDDLE EAST AND AFRICA B2B IN FOOD INGREDIENTS (ACIDULANTS) MARKET, BY TYPE, 2020-2029 (USD MILLION)
TABLE 86 MIDDLE EAST AND AFRICA B2C IN FOOD INGREDIENTS (ACIDULANTS) MARKET, BY TYPE, 2020-2029 (USD MILLION)
TABLE 87 MIDDLE EAST AND AFRICA FOOD INGREDIENTS (ACIDULANTS) MARKET, BY END-USER, 2020-2029 (USD MILLION)
TABLE 88 MIDDLE EAST AND AFRICA FOOD SERVICE SECTOR IN FOOD INGREDIENTS (ACIDULANTS) MARKET, BY TYPE, 2020-2029 (USD MILLION)
TABLE 89 MIDDLE EAST AND AFRICA FOOD PROCESSING SECTOR IN FOOD INGREDIENTS (ACIDULANTS) MARKET, BY END USER, 2020-2029 (USD MILLION)
TABLE 90 MIDDLE EAST AND AFRICA FOOD IN FOOD INGREDIENTS (ACIDULANTS) MARKET, BY TYPE, 2020-2029 (USD MILLION)
TABLE 91 MIDDLE EAST AND AFRICA DAIRY PRODUCTS IN FOOD INGREDIENTS (ACIDULANTS) MARKET, BY TYPE, 2020-2029 (USD MILLION)
TABLE 92 MIDDLE EAST AND AFRICA BAKERY IN FOOD INGREDIENTS (ACIDULANTS) MARKET, BY TYPE, 2020-2029 (USD MILLION)
TABLE 93 MIDDLE EAST AND AFRICA CONVENIENCE FOOD IN FOOD INGREDIENTS (ACIDULANTS) MARKET, BY TYPE, 2020-2029 (USD MILLION)
TABLE 94 MIDDLE EAST AND AFRICA PROCESSED MEAT PRODUCTS IN FOOD INGREDIENTS (ACIDULANTS) MARKET, BY TYPE, 2020-2029 (USD MILLION)
TABLE 95 MIDDLE EAST AND AFRICA CONFECTIONERY IN FOOD INGREDIENTS (ACIDULANTS) MARKET, BY TYPE, 2020-2029 (USD MILLION)
TABLE 96 MIDDLE EAST AND AFRICA BEVERAGES IN FOOD INGREDIENTS (ACIDULANTS) MARKET, BY TYPE, 2020-2029 (USD MILLION)
TABLE 97 MIDDLE EAST AND AFRICA NON-ALCOHOLIC BEVERAGES IN FOOD INGREDIENTS (ACIDULANTS) MARKET, BY TYPE, 2020-2029 (USD MILLION)
TABLE 98 SAUDI ARABIA FOOD INGREDIENTS (ACIDULANTS) MARKET, BY TYPE, 2020-2029 (USD MILLION)
TABLE 99 SAUDI ARABIA FOOD INGREDIENTS (ACIDULANTS) MARKET, BY FORM, 2020-2029 (USD MILLION)
TABLE 100 SAUDI ARABIA FOOD INGREDIENTS (ACIDULANTS) MARKET, BY FUNCTION, 2020-2029 (USD MILLION)
TABLE 101 SAUDI ARABIA FOOD INGREDIENTS (ACIDULANTS) MARKET, BY DISTRIBUTION CHANNEL, 2020-2029 (USD MILLION)
TABLE 102 SAUDI ARABIA B2B IN FOOD INGREDIENTS (ACIDULANTS) MARKET, BY TYPE, 2020-2029 (USD MILLION)
TABLE 103 SAUDI ARABIA B2C IN FOOD INGREDIENTS (ACIDULANTS) MARKET, BY TYPE, 2020-2029 (USD MILLION)
TABLE 104 SAUDI ARABIA FOOD INGREDIENTS (ACIDULANTS) MARKET, BY END-USER, 2020-2029 (USD MILLION)
TABLE 105 SAUDI ARABIA FOOD SERVICE SECTOR IN FOOD INGREDIENTS (ACIDULANTS) MARKET, BY TYPE, 2020-2029 (USD MILLION)
TABLE 106 SAUDI ARABIA FOOD PROCESSING SECTOR IN FOOD INGREDIENTS (ACIDULANTS) MARKET, BY END USER, 2020-2029 (USD MILLION)
TABLE 107 SAUDI ARABIA FOOD IN FOOD INGREDIENTS (ACIDULANTS) MARKET, BY TYPE, 2020-2029 (USD MILLION)
TABLE 108 SAUDI ARABIA DAIRY PRODUCTS IN FOOD INGREDIENTS (ACIDULANTS) MARKET, BY TYPE, 2020-2029 (USD MILLION)
TABLE 109 SAUDI ARABIA BAKERY IN FOOD INGREDIENTS (ACIDULANTS) MARKET, BY TYPE, 2020-2029 (USD MILLION)
TABLE 110 SAUDI ARABIA CONVENIENCE FOOD IN FOOD INGREDIENTS (ACIDULANTS) MARKET, BY TYPE, 2020-2029 (USD MILLION)
TABLE 111 SAUDI ARABIA PROCESSED MEAT PRODUCTS IN FOOD INGREDIENTS (ACIDULANTS) MARKET, BY TYPE, 2020-2029 (USD MILLION)
TABLE 112 SAUDI ARABIA CONFECTIONERY IN FOOD INGREDIENTS (ACIDULANTS) MARKET, BY TYPE, 2020-2029 (USD MILLION)
TABLE 113 SAUDI ARABIA BEVERAGES IN FOOD INGREDIENTS (ACIDULANTS) MARKET, BY TYPE, 2020-2029 (USD MILLION)
TABLE 114 SAUDI ARABIA NON-ALCOHOLIC BEVERAGES IN FOOD INGREDIENTS (ACIDULANTS) MARKET, BY TYPE, 2020-2029 (USD MILLION)
TABLE 115 U.A.E. FOOD INGREDIENTS (ACIDULANTS) MARKET, BY TYPE, 2020-2029 (USD MILLION)
TABLE 116 U.A.E. FOOD INGREDIENTS (ACIDULANTS) MARKET, BY FORM, 2020-2029 (USD MILLION)
TABLE 117 U.A.E. FOOD INGREDIENTS (ACIDULANTS) MARKET, BY FUNCTION, 2020-2029 (USD MILLION)
TABLE 118 U.A.E. FOOD INGREDIENTS (ACIDULANTS) MARKET, BY DISTRIBUTION CHANNEL, 2020-2029 (USD MILLION)
TABLE 119 U.A.E. B2B IN FOOD INGREDIENTS (ACIDULANTS) MARKET, BY TYPE, 2020-2029 (USD MILLION)
TABLE 120 U.A.E. B2C IN FOOD INGREDIENTS (ACIDULANTS) MARKET, BY TYPE, 2020-2029 (USD MILLION)
TABLE 121 U.A.E. FOOD INGREDIENTS (ACIDULANTS) MARKET, BY END-USER, 2020-2029 (USD MILLION)
TABLE 122 U.A.E. FOOD SERVICE SECTOR IN FOOD INGREDIENTS (ACIDULANTS) MARKET, BY TYPE, 2020-2029 (USD MILLION)
TABLE 123 U.A.E. FOOD PROCESSING SECTOR IN FOOD INGREDIENTS (ACIDULANTS) MARKET, BY END USER, 2020-2029 (USD MILLION)
TABLE 124 U.A.E. FOOD IN FOOD INGREDIENTS (ACIDULANTS) MARKET, BY TYPE, 2020-2029 (USD MILLION)
TABLE 125 U.A.E. DAIRY PRODUCTS IN FOOD INGREDIENTS (ACIDULANTS) MARKET, BY TYPE, 2020-2029 (USD MILLION)
TABLE 126 U.A.E. BAKERY IN FOOD INGREDIENTS (ACIDULANTS) MARKET, BY TYPE, 2020-2029 (USD MILLION)
TABLE 127 U.A.E. CONVENIENCE FOOD IN FOOD INGREDIENTS (ACIDULANTS) MARKET, BY TYPE, 2020-2029 (USD MILLION)
TABLE 128 U.A.E. PROCESSED MEAT PRODUCTS IN FOOD INGREDIENTS (ACIDULANTS) MARKET, BY TYPE, 2020-2029 (USD MILLION)
TABLE 129 U.A.E. CONFECTIONERY IN FOOD INGREDIENTS (ACIDULANTS) MARKET, BY TYPE, 2020-2029 (USD MILLION)
TABLE 130 U.A.E. BEVERAGES IN FOOD INGREDIENTS (ACIDULANTS) MARKET, BY TYPE, 2020-2029 (USD MILLION)
TABLE 131 U.A.E. NON-ALCOHOLIC BEVERAGES IN FOOD INGREDIENTS (ACIDULANTS) MARKET, BY TYPE, 2020-2029 (USD MILLION)
TABLE 132 SOUTH AFRICA FOOD INGREDIENTS (ACIDULANTS) MARKET, BY TYPE, 2020-2029 (USD MILLION)
TABLE 133 SOUTH AFRICA FOOD INGREDIENTS (ACIDULANTS) MARKET, BY FORM, 2020-2029 (USD MILLION)
TABLE 134 SOUTH AFRICA FOOD INGREDIENTS (ACIDULANTS) MARKET, BY FUNCTION, 2020-2029 (USD MILLION)
TABLE 135 SOUTH AFRICA FOOD INGREDIENTS (ACIDULANTS) MARKET, BY DISTRIBUTION CHANNEL, 2020-2029 (USD MILLION)
TABLE 136 SOUTH AFRICA B2B IN FOOD INGREDIENTS (ACIDULANTS) MARKET, BY TYPE, 2020-2029 (USD MILLION)
TABLE 137 SOUTH AFRICA B2C IN FOOD INGREDIENTS (ACIDULANTS) MARKET, BY TYPE, 2020-2029 (USD MILLION)
TABLE 138 SOUTH AFRICA FOOD INGREDIENTS (ACIDULANTS) MARKET, BY END-USER, 2020-2029 (USD MILLION)
TABLE 139 SOUTH AFRICA FOOD SERVICE SECTOR IN FOOD INGREDIENTS (ACIDULANTS) MARKET, BY TYPE, 2020-2029 (USD MILLION)
TABLE 140 SOUTH AFRICA FOOD PROCESSING SECTOR IN FOOD INGREDIENTS (ACIDULANTS) MARKET, BY END USER, 2020-2029 (USD MILLION)
TABLE 141 SOUTH AFRICA FOOD IN FOOD INGREDIENTS (ACIDULANTS) MARKET, BY TYPE, 2020-2029 (USD MILLION)
TABLE 142 SOUTH AFRICA DAIRY PRODUCTS IN FOOD INGREDIENTS (ACIDULANTS) MARKET, BY TYPE, 2020-2029 (USD MILLION)
TABLE 143 SOUTH AFRICA BAKERY IN FOOD INGREDIENTS (ACIDULANTS) MARKET, BY TYPE, 2020-2029 (USD MILLION)
TABLE 144 SOUTH AFRICA CONVENIENCE FOOD IN FOOD INGREDIENTS (ACIDULANTS) MARKET, BY TYPE, 2020-2029 (USD MILLION)
TABLE 145 SOUTH AFRICA PROCESSED MEAT PRODUCTS IN FOOD INGREDIENTS (ACIDULANTS) MARKET, BY TYPE, 2020-2029 (USD MILLION)
TABLE 146 SOUTH AFRICA CONFECTIONERY IN FOOD INGREDIENTS (ACIDULANTS) MARKET, BY TYPE, 2020-2029 (USD MILLION)
TABLE 147 SOUTH AFRICA BEVERAGES IN FOOD INGREDIENTS (ACIDULANTS) MARKET, BY TYPE, 2020-2029 (USD MILLION)
TABLE 148 SOUTH AFRICA NON-ALCOHOLIC BEVERAGES IN FOOD INGREDIENTS (ACIDULANTS) MARKET, BY TYPE, 2020-2029 (USD MILLION)
TABLE 149 KUWAIT FOOD INGREDIENTS (ACIDULANTS) MARKET, BY TYPE, 2020-2029 (USD MILLION)
TABLE 150 KUWAIT FOOD INGREDIENTS (ACIDULANTS) MARKET, BY FORM, 2020-2029 (USD MILLION)
TABLE 151 KUWAIT FOOD INGREDIENTS (ACIDULANTS) MARKET, BY FUNCTION, 2020-2029 (USD MILLION)
TABLE 152 KUWAIT FOOD INGREDIENTS (ACIDULANTS) MARKET, BY DISTRIBUTION CHANNEL, 2020-2029 (USD MILLION)
TABLE 153 KUWAIT B2B IN FOOD INGREDIENTS (ACIDULANTS) MARKET, BY TYPE, 2020-2029 (USD MILLION)
TABLE 154 KUWAIT B2C IN FOOD INGREDIENTS (ACIDULANTS) MARKET, BY TYPE, 2020-2029 (USD MILLION)
TABLE 155 KUWAIT FOOD INGREDIENTS (ACIDULANTS) MARKET, BY END-USER, 2020-2029 (USD MILLION)
TABLE 156 KUWAIT FOOD SERVICE SECTOR IN FOOD INGREDIENTS (ACIDULANTS) MARKET, BY TYPE, 2020-2029 (USD MILLION)
TABLE 157 KUWAIT FOOD PROCESSING SECTOR IN FOOD INGREDIENTS (ACIDULANTS) MARKET, BY END USER, 2020-2029 (USD MILLION)
TABLE 158 KUWAIT FOOD IN FOOD INGREDIENTS (ACIDULANTS) MARKET, BY TYPE, 2020-2029 (USD MILLION)
TABLE 159 KUWAIT DAIRY PRODUCTS IN FOOD INGREDIENTS (ACIDULANTS) MARKET, BY TYPE, 2020-2029 (USD MILLION)
TABLE 160 KUWAIT BAKERY IN FOOD INGREDIENTS (ACIDULANTS) MARKET, BY TYPE, 2020-2029 (USD MILLION)
TABLE 161 KUWAIT CONVENIENCE FOOD IN FOOD INGREDIENTS (ACIDULANTS) MARKET, BY TYPE, 2020-2029 (USD MILLION)
TABLE 162 KUWAIT PROCESSED MEAT PRODUCTS IN FOOD INGREDIENTS (ACIDULANTS) MARKET, BY TYPE, 2020-2029 (USD MILLION)
TABLE 163 KUWAIT CONFECTIONERY IN FOOD INGREDIENTS (ACIDULANTS) MARKET, BY TYPE, 2020-2029 (USD MILLION)
TABLE 164 KUWAIT BEVERAGES IN FOOD INGREDIENTS (ACIDULANTS) MARKET, BY TYPE, 2020-2029 (USD MILLION)
TABLE 165 KUWAIT NON-ALCOHOLIC BEVERAGES IN FOOD INGREDIENTS (ACIDULANTS) MARKET, BY TYPE, 2020-2029 (USD MILLION)
TABLE 166 OMAN FOOD INGREDIENTS (ACIDULANTS) MARKET, BY TYPE, 2020-2029 (USD MILLION)
TABLE 167 OMAN FOOD INGREDIENTS (ACIDULANTS) MARKET, BY FORM, 2020-2029 (USD MILLION)
TABLE 168 OMAN FOOD INGREDIENTS (ACIDULANTS) MARKET, BY FUNCTION, 2020-2029 (USD MILLION)
TABLE 169 OMAN FOOD INGREDIENTS (ACIDULANTS) MARKET, BY DISTRIBUTION CHANNEL, 2020-2029 (USD MILLION)
TABLE 170 OMAN B2B IN FOOD INGREDIENTS (ACIDULANTS) MARKET, BY TYPE, 2020-2029 (USD MILLION)
TABLE 171 OMAN B2C IN FOOD INGREDIENTS (ACIDULANTS) MARKET, BY TYPE, 2020-2029 (USD MILLION)
TABLE 172 OMAN FOOD INGREDIENTS (ACIDULANTS) MARKET, BY END-USER, 2020-2029 (USD MILLION)
TABLE 173 OMAN FOOD SERVICE SECTOR IN FOOD INGREDIENTS (ACIDULANTS) MARKET, BY TYPE, 2020-2029 (USD MILLION)
TABLE 174 OMAN FOOD PROCESSING SECTOR IN FOOD INGREDIENTS (ACIDULANTS) MARKET, BY END USER, 2020-2029 (USD MILLION)
TABLE 175 OMAN FOOD IN FOOD INGREDIENTS (ACIDULANTS) MARKET, BY TYPE, 2020-2029 (USD MILLION)
TABLE 176 OMAN DAIRY PRODUCTS IN FOOD INGREDIENTS (ACIDULANTS) MARKET, BY TYPE, 2020-2029 (USD MILLION)
TABLE 177 OMAN BAKERY IN FOOD INGREDIENTS (ACIDULANTS) MARKET, BY TYPE, 2020-2029 (USD MILLION)
TABLE 178 OMAN CONVENIENCE FOOD IN FOOD INGREDIENTS (ACIDULANTS) MARKET, BY TYPE, 2020-2029 (USD MILLION)
TABLE 179 OMAN PROCESSED MEAT PRODUCTS IN FOOD INGREDIENTS (ACIDULANTS) MARKET, BY TYPE, 2020-2029 (USD MILLION)
TABLE 180 OMAN CONFECTIONERY IN FOOD INGREDIENTS (ACIDULANTS) MARKET, BY TYPE, 2020-2029 (USD MILLION)
TABLE 181 OMAN BEVERAGES IN FOOD INGREDIENTS (ACIDULANTS) MARKET, BY TYPE, 2020-2029 (USD MILLION)
TABLE 182 OMAN NON-ALCOHOLIC BEVERAGES IN FOOD INGREDIENTS (ACIDULANTS) MARKET, BY TYPE, 2020-2029 (USD MILLION)
TABLE 183 QATAR FOOD INGREDIENTS (ACIDULANTS) MARKET, BY TYPE, 2020-2029 (USD MILLION)
TABLE 184 QATAR FOOD INGREDIENTS (ACIDULANTS) MARKET, BY FORM, 2020-2029 (USD MILLION)
TABLE 185 QATAR FOOD INGREDIENTS (ACIDULANTS) MARKET, BY FUNCTION, 2020-2029 (USD MILLION)
TABLE 186 QATAR FOOD INGREDIENTS (ACIDULANTS) MARKET, BY DISTRIBUTION CHANNEL, 2020-2029 (USD MILLION)
TABLE 187 QATAR B2B IN FOOD INGREDIENTS (ACIDULANTS) MARKET, BY TYPE, 2020-2029 (USD MILLION)
TABLE 188 QATAR B2C IN FOOD INGREDIENTS (ACIDULANTS) MARKET, BY TYPE, 2020-2029 (USD MILLION)
TABLE 189 QATAR FOOD INGREDIENTS (ACIDULANTS) MARKET, BY END-USER, 2020-2029 (USD MILLION)
TABLE 190 QATAR FOOD SERVICE SECTOR IN FOOD INGREDIENTS (ACIDULANTS) MARKET, BY TYPE, 2020-2029 (USD MILLION)
TABLE 191 QATAR FOOD PROCESSING SECTOR IN FOOD INGREDIENTS (ACIDULANTS) MARKET, BY END USER, 2020-2029 (USD MILLION)
TABLE 192 QATAR FOOD IN FOOD INGREDIENTS (ACIDULANTS) MARKET, BY TYPE, 2020-2029 (USD MILLION)
TABLE 193 QATAR DAIRY PRODUCTS IN FOOD INGREDIENTS (ACIDULANTS) MARKET, BY TYPE, 2020-2029 (USD MILLION)
TABLE 194 QATAR BAKERY IN FOOD INGREDIENTS (ACIDULANTS) MARKET, BY TYPE, 2020-2029 (USD MILLION)
TABLE 195 QATAR CONVENIENCE FOOD IN FOOD INGREDIENTS (ACIDULANTS) MARKET, BY TYPE, 2020-2029 (USD MILLION)
TABLE 196 QATAR PROCESSED MEAT PRODUCTS IN FOOD INGREDIENTS (ACIDULANTS) MARKET, BY TYPE, 2020-2029 (USD MILLION)
TABLE 197 QATAR CONFECTIONERY IN FOOD INGREDIENTS (ACIDULANTS) MARKET, BY TYPE, 2020-2029 (USD MILLION)
TABLE 198 QATAR BEVERAGES IN FOOD INGREDIENTS (ACIDULANTS) MARKET, BY TYPE, 2020-2029 (USD MILLION)
TABLE 199 QATAR NON-ALCOHOLIC BEVERAGES IN FOOD INGREDIENTS (ACIDULANTS) MARKET, BY TYPE, 2020-2029 (USD MILLION)
TABLE 200 REST OF MIDDLE EAST & AFRICA FOOD INGREDIENTS (ACIDULANTS) MARKET, BY TYPE, 2020-2029 (USD MILLION)
List of Figure
FIGURE 1 MIDDLE EAST & AFRICA FOOD INGREDIENTS (ACIDULANTS) MARKET: SEGMENTATION
FIGURE 2 MIDDLE EAST & AFRICA FOOD INGREDIENTS (ACIDULANTS) MARKET: DATA TRIANGULATION
FIGURE 3 MIDDLE EAST & AFRICA FOOD INGREDIENTS (ACIDULANTS) MARKET: DROC ANALYSIS
FIGURE 4 MIDDLE EAST & AFRICA FOOD INGREDIENTS (ACIDULANTS) MARKET: MIDDLE EAST & AFRICA VS REGIONAL MARKET ANALYSIS
FIGURE 5 MIDDLE EAST & AFRICA FOOD INGREDIENTS (ACIDULANTS) MARKET: COMPANY RESEARCH ANALYSIS
FIGURE 6 MIDDLE EAST & AFRICA FOOD INGREDIENTS (ACIDULANTS) MARKET: INTERVIEW DEMOGRAPHICS
FIGURE 7 MIDDLE EAST & AFRICA FOOD INGREDIENTS (ACIDULANTS) MARKET: DBMR MARKET POSITION GRID
FIGURE 8 MIDDLE EAST & AFRICA FOOD INGREDIENTS (ACIDULANTS) MARKET: MARKET END-USER COVERAGE GRID
FIGURE 9 MIDDLE EAST & AFRICA FOOD INGREDIENTS (ACIDULANTS) MARKET: VENDOR SHARE ANALYSIS
FIGURE 10 MIDDLE EAST & AFRICA FOOD INGREDIENTS (ACIDULANTS) MARKET: SEGMENTATION
FIGURE 11 NORTH AMERICA IS EXPECTED TO DOMINATE THE MIDDLE EAST & AFRICA FOOD INGREDIENTS (ACIDULANTS) MARKET AND IS GROWING WITH THE HIGHEST CAGR IN THE FORECAST PERIOD OF 2022 TO 2029
FIGURE 12 GROWING DEMAND FOR CONVENIENCE FOOD PRODUCTS IS LIKELY TO FAVOR FOOD ACIDULANTS INDUSTRY GROWTH WHICH IS DRIVING THE MIDDLE EAST & AFRICA FOOD INGREDIENTS (ACIDULANTS) MARKET IN THE FORECAST PERIOD
FIGURE 13 CITRIC ACID SEGMENT IS EXPECTED TO ACCOUNT FOR THE LARGEST SHARE OF THE MIDDLE EAST & AFRICA FOOD INGREDIENTS (ACIDULANTS) MARKET IN 2022 & 2029
FIGURE 14 UKRAINE AND RUSSIA’S SHARE OF MIDDLE EAST & AFRICA TRADE (2018-2020)-
FIGURE 15 SUPPLY CHAIN OF MIDDLE EAST & AFRICA FOOD INGREDIENTS (ACIDULANTS) MARKET
FIGURE 16 DRIVERS, RESTRAINTS, OPPORTUNITIES, AND CHALLENGES OF THE MIDDLE EAST & AFRICA FOOD INGREDIENTS (ACIDULANTS) MARKET
FIGURE 17 THE BELOW GRAPH SHOWS THE MIDDLE EAST & AFRICA MARKET SIZE FOR BEVERAGES
FIGURE 18 THE BELOW GRAPH SHOWS THE SALES OF MIDDLE EAST & AFRICA NON-ALCOHOLIC BEVERAGES FROM 2018 TO 2022:
FIGURE 19 THE BELOW GRAPH SHOWS THE SALES OF NON-ALCOHOLIC BEVERAGES IN U.S. FROM 2019 TO 2021-
FIGURE 20 MIDDLE EAST & AFRICA FOOD INGREDIENTS (ACIDULANTS) MARKET: BY TYPE, 2021
FIGURE 21 MIDDLE EAST & AFRICA FOOD INGREDIENTS (ACIDULANTS) MARKET: BY FORM, 2021
FIGURE 22 MIDDLE EAST & AFRICA FOOD INGREDIENTS (ACIDULANTS) MARKET: BY FUNCTION, 2021
FIGURE 23 MIDDLE EAST & AFRICA FOOD INGREDIENTS (ACIDULANTS) MARKET, BY DISTRIBUTION CHANNEL, 2021
FIGURE 24 MIDDLE EAST & AFRICA FOOD INGREDIENTS (ACIDULANTS) MARKET: BY END-USER, 2021
FIGURE 25 MIDDLE EAST AND AFRICA FOOD INGREDIENTS (ACIDULANTS) MARKET: SNAPSHOT (2021)
FIGURE 26 MIDDLE EAST AND AFRICA FOOD INGREDIENTS (ACIDULANTS) MARKET: BY COUNTRY (2021)
FIGURE 27 MIDDLE EAST AND AFRICA FOOD INGREDIENTS (ACIDULANTS) MARKET: BY COUNTRY (2022 & 2029)
FIGURE 28 MIDDLE EAST AND AFRICA FOOD INGREDIENTS (ACIDULANTS) MARKET: BY COUNTRY (2021 & 2029)
FIGURE 29 MIDDLE EAST AND AFRICA FOOD INGREDIENTS (ACIDULANTS) MARKET: BY TYPE (2022 & 2029)
FIGURE 30 MIDDLE EAST & AFRICA FOOD INGREDIENT (ACIDULANTS) MARKET: COMPANY SHARE 2021 (%)
Middle East And Africa Food Acidulants Market, Supply Chain Analysis and Ecosystem Framework
To support market growth and help clients navigate the impact of geopolitical shifts, DBMR has integrated in-depth supply chain analysis into its Middle East And Africa Food Acidulants Market research reports. This addition empowers clients to respond effectively to global changes affecting their industries. The supply chain analysis section includes detailed insights such as Middle East And Africa Food Acidulants Market consumption and production by country, price trend analysis, the impact of tariffs and geopolitical developments, and import and export trends by country and HSN code. It also highlights major suppliers with data on production capacity and company profiles, as well as key importers and exporters. In addition to research, DBMR offers specialized supply chain consulting services backed by over a decade of experience, providing solutions like supplier discovery, supplier risk assessment, price trend analysis, impact evaluation of inflation and trade route changes, and comprehensive market trend analysis.
Data collection and base year analysis are done using data collection modules with large sample sizes. The stage includes obtaining market information or related data through various sources and strategies. It includes examining and planning all the data acquired from the past in advance. It likewise envelops the examination of information inconsistencies seen across different information sources. The market data is analysed and estimated using market statistical and coherent models. Also, market share analysis and key trend analysis are the major success factors in the market report. To know more, please request an analyst call or drop down your inquiry.
The key research methodology used by DBMR research team is data triangulation which involves data mining, analysis of the impact of data variables on the market and primary (industry expert) validation. Data models include Vendor Positioning Grid, Market Time Line Analysis, Market Overview and Guide, Company Positioning Grid, Patent Analysis, Pricing Analysis, Company Market Share Analysis, Standards of Measurement, Global versus Regional and Vendor Share Analysis. To know more about the research methodology, drop in an inquiry to speak to our industry experts.
Data Bridge Market Research is a leader in advanced formative research. We take pride in servicing our existing and new customers with data and analysis that match and suits their goal. The report can be customized to include price trend analysis of target brands understanding the market for additional countries (ask for the list of countries), clinical trial results data, literature review, refurbished market and product base analysis. Market analysis of target competitors can be analyzed from technology-based analysis to market portfolio strategies. We can add as many competitors that you require data about in the format and data style you are looking for. Our team of analysts can also provide you data in crude raw excel files pivot tables (Fact book) or can assist you in creating presentations from the data sets available in the report.


