
Market Analysis and Insights: Middle East and Africa Food Thickeners Market
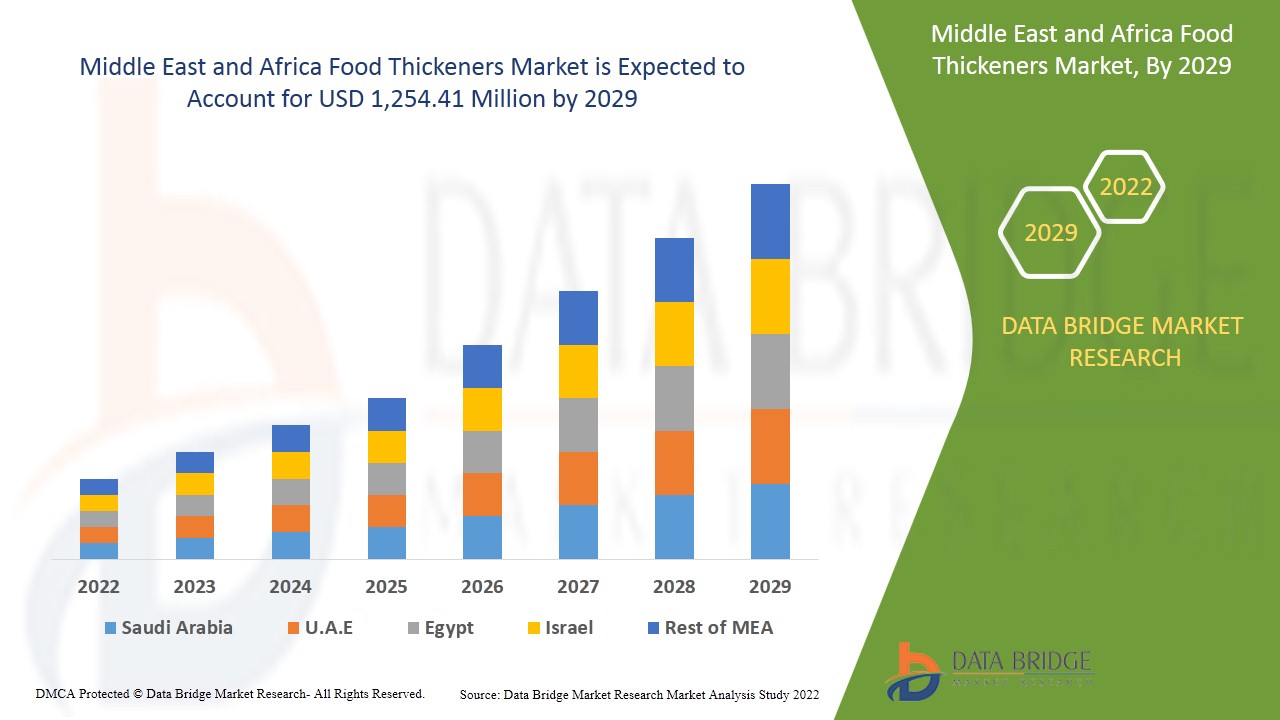
Middle East and Africa market is expected to grow in the forecast period of 2022 to 2029. Data Bridge Market Research analyses that the market is growing with a CAGR of 4.7% in the forecast period of 2022 to 2029 and is expected to reach USD 1,254.41 million by 2029. Rising demand for non-alcoholic drinks, including fruit juices and energy drinks, is expected to drive the Middle East and Africa food thickeners market growth.
Food thickeners are defined as the food modifying agents that are used to modify the texture structure of food & beverages. They are used to increase the thickness of food & beverages, helping absorb the water content in the edibles once they are integrated into the products. These products are majorly utilized to modify the viscosity of these products, giving them a consistent overall structure. The market's most widely used food thickeners are starches, followed by hydrocolloids and proteins. Food thickeners are used in food applications such as bakery products, confectionery products, sauces, dressings, marinades, gravies, beverages, dairy, frozen desserts, convenience, processed food, among others.
An increase in the change in lifestyle of the consumers resulting in an increased focus on their diet is a vital factor escalating the market growth. Also, a rise in the product's benefits offering more than just thickening capabilities at low costs may fuel the global food thickeners market. However, increased research and development costs associated with the development and manufacturing of food thickeners and continuous fluctuations in raw material prices of hydrocolloids are the major factors, among others, expected to restrain the global food thickeners market in the forecast period.
A rise in the new product innovation and increase in the research and development activities in the market will further create new opportunities for the global food thickeners market. On the other hand, possible health concerns regarding xanthan gum and carrageenan may challenge the growth of the global food thickeners market.
The Middle East and Africa food thickeners market report provides details of market share, new developments, and product pipeline analysis, the impact of domestic and localized market players, analyses opportunities in terms of emerging revenue pockets, changes in market regulations, product approvals, strategic decisions, product launches, geographic expansions, and technological innovations in the market. To understand the analysis and the global food thickeners market scenario, contact Data Bridge Market Research for an Analyst Brief. Our team will help you create a revenue impact solution to achieve your desired goal.
Middle East and Africa Food Thickeners Market Scope and Market Size
Middle East and Africa Food thickeners market is segmented into five notable segments based on type, form, nature, source, and application. The growth among segments helps you analyze niche pockets of growth and strategies to approach the market and determine your core application areas and the difference in your target markets.
- On the basis of type, the Middle East and Africa food thickeners market is segmented into protein, starch, hydrocolloids, pectin, and others. In 2022, the hydrocolloids food thickeners segment is expected to dominate the market due to the growing use of hydrocolloids in confectionery products which mainly include jam, jelly, marmalade, chewing gum, and low sugar/calorie gels.
- On the basis of form, the Middle East and Africa food thickeners market is segmented into gel, powder, granules, and others. In 2022, the powder segment is expected to dominate the market due to easy to use nature of powder form and maintain as compared to other form food thickeners.
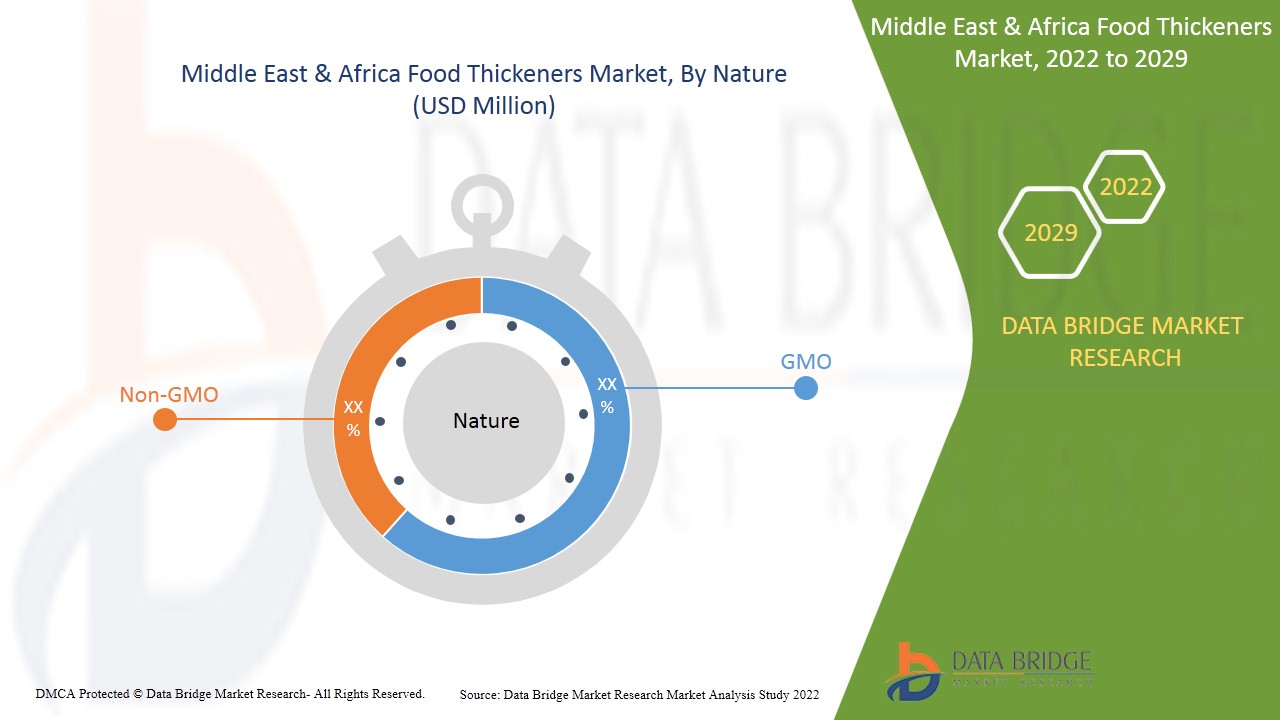
- On the basis of nature, the Middle East and Africa food thickeners market is segmented into GMO and non-GMO. In 2022, non-GMO segment is expected to dominate the market due to the growing demand for organic, naturally grown foods.
- On the basis of source, the Middle East and Africa food thickeners market is segmented into plant-based, animal-based, marine, and microbial. In 2022, the plant-based segment is expected to dominate the market due to the growing popularity of plant-based food thickeners such as starch that are extracted from grains such as corn, wheat, or rice and root vegetables such as potato, cassava, and arrowroot.
- On the basis of application, the Middle East and Africa food thickeners market is segmented into food and beverage. In 2022, the food segment is expected to dominate the market due to a rise in the benefits associated with the product offering more than just thickening capabilities.
Middle East and Africa Food Thickeners Market Country Level Analysis
The Middle East and Africa food thickeners market is analyzed, and market size information is provided by the type, form, nature, source, and application as referenced above.
The countries covered in the Middle East and Africa food thickeners market report are South Africa, Saudi Arabia, U.A.E, Kuwait, and Rest of the Middle East and Africa.
South Africa is expected to dominate the Middle East and Africa food thickeners market owing to rising disposable incomes coupled with changing lifestyles due to rapid urbanization.
The country section of the report also provides individual market impacting factors and changes in market regulation that impact the current and future trends of the market. Data points such as new sales, replacement sales, country demographics, regulatory acts, and import-export tariffs are some of the major pointers used to forecast the market scenario for individual countries. Also, the presence and availability of the Middle East and Africa brands and their challenges faced due to large or scarce competition from local and domestic brands, the impact of sales channels are considered while providing forecast analysis of the country data.
Growing Strategic Activities by Major Market Players to Enhance the Awareness for Food thickeners is Boosting the Market Growth of Middle East and Africa Food Thickeners Market
The Middle East and Africa Food thickeners market also provide you with a detailed market analysis for every country's growth in a particular market. Additionally, it provides detailed information regarding the market players' strategy and their geographical presence. The data is available for the historical period 2010 to 2019.
Competitive Landscape and the Middle East and Africa Food Thickeners Market Share Analysis
Middle East and Africa food thickeners market competitive landscape provide details by the competitor. Details included are company overview, company financials, revenue generated, market potential, investment in research and development, new market initiatives, production sites and facilities, company strengths and weaknesses, product launch, product trials pipelines, product approvals, patents, product width, and breadth, application dominance, technology lifeline curve. The above data points are only related to the company's focus on the Middle East and Africa Food thickeners market.
Some of the major players operating in the Middle East and Africa food thickeners market are Ingredion Incorporated, Cargill, Incorporated, CP Kelco U.S., Inc., Tate & Lyle, DuPont Nutrition Bioscience ApS, Ashland, ADM, Jungbunzlauer Suisse AG, Deosen Biochemical (Ordos) Ltd., GELITA AG, Solvay, VIKAS WSP LTD., DSM, Medline Industries, LP, Kent Precision Foods Group, Inc., HL Agro Products Pvt. Ltd., Emsland Group, among other domestic players.
DBMR analysts understand competitive strengths and provide competitive analysis for each competitor separately.
Many product launches are also initiated by companies worldwide, which also accelerates the Middle East and Africa Food thickeners market.
For instance,
- In January 2021, Tate & Lyle expanded its line of tapioca-based starches. The expansion includes the launch of new REZISTA MAX thickening starches and BRIOGEL gelling starches. This has helped the company to widen its product portfolio
- In May 2019, Bioriginal introduced a new product named XanFlax, which is a natural thickening agent that can be used as a non-GMO replacement for xanthan gum in a variety of food applications
Collaboration, product launch, business expansion, award and recognition, joint ventures, and other strategies by the market player enhance the company's footprints in the Middle East and Africa Food thickeners market, which also benefits the organization's profit growth.
SKU-

- Interactive Data Analysis Dashboard
- Company Analysis Dashboard for high growth potential opportunities
- Research Analyst Access for customization & queries
- Competitor Analysis with Interactive dashboard
- Latest News, Updates & Trend analysis
- Harness the Power of Benchmark Analysis for Comprehensive Competitor Tracking
Table of Content
1 INTRODUCTION
1.1 OBJECTIVES OF THE STUDY
1.2 MARKET DEFINITION
1.3 OVERVIEW OF MIDDLE EAST AND AFRICA FOOD THICKENERS MARKET
1.4 LIMITATIONS
1.5 MARKETS COVERED
2 MARKET SEGMENTATION
2.1 MARKETS COVERED
2.2 GEOGRAPHICAL SCOPE
2.3 YEARS CONSIDERED FOR THE STUDY
2.4 CURRENCY AND PRICING
2.5 DBMR TRIPOD DATA VALIDATION MODEL
2.6 MULTIVARIATE MODELLING
2.7 PRODUCT LIFELINE CURVE
2.8 PRIMARY INTERVIEWS WITH KEY OPINION LEADERS
2.9 DBMR MARKET POSITION GRID
2.1 VENDOR SHARE ANALYSIS
2.11 SECONDARY SOURCES
2.12 ASSUMPTIONS
3 EXECUTIVE SUMMARY
4 PREMIUM INSIGHTS
4.1 CLIENTS CUSTOMIZATION:
4.1.1 WHAT IS THE MAJOR FOOD THICKENER, AND WHAT IS EACH FOOD THICKENER'S ISSUE (OR REQUIREMENT) TO SOLVE?
4.1.2 STARCH
4.1.3 HYDROCOLLOIDS
4.1.4 PECTIN
4.1.5 PROTEIN:
4.2 ANALYSIS OF MAJOR FOOD THICKENERS:
4.3 PRICING ANALYSIS OF FOOD THICKENERS
4.4 MIDDLE EAST AND AFRICA FOOD THICKENERS MARKET: NEW PRODUCT LAUNCH STRATEGIES
4.4.1 GROWING DEMAND FOR PLANT-BASED SOURCED FOOD THICKENERS
4.4.2 LAUNCHING ORGANIC, CLEAN, AND SUSTAINABLE FOOD THICKENERS
4.4.3 PROMOTING BY HIGHLIGHTING GLUTEN-FREE THICKENERS
4.4.4 LAUNCHES-
4.5 FACTORS INFLUENCING PURCHASING DECISION OF END USERS
4.5.1 VARIETY OF APPLICATIONS CATERED BY FOOD THICKENERS PRODUCTS:
4.5.2 AVAILABILITY OF A VARIETY OF PRODUCT TYPES:
4.5.3 QUALITY OF THE PRODUCTS:
4.6 MIDDLE EAST AND AFRICA FOOD THICKENERS MARKET: REGULATORY FRAMEWORK
4.6.1 FOOD STANDARDS AUSTRALIA, NEW ZEALAND
4.7 SUPPLY CHAIN ANALYSIS
4.8 VALUE CHAIN ANALYSIS OF MIDDLE EAST AND AFRICA FOOD THICKENERS MARKET
5 MARKET OVERVIEW
5.1 DRIVERS
5.1.1 RISING DEMAND FOR FRUIT JUICES
5.1.2 RISING DISPOSABLE INCOME COUPLED WITH CHANGING LIFESTYLES DUE TO RAPID URBANIZATION
5.1.3 ADVANTAGES AND SEVERAL FUNCTIONS ASSOCIATED WITH THE USE OF FOOD THICKENERS
5.1.4 RISING DEMAND FOR THICKENING AGENTS IN BAKERY AND CONFECTIONERY PRODUCTS
5.2 RESTRAINTS
5.2.1 POSSIBLE HEALTH CONCERNS REGARDING XANTHAN GUM AND CARRAGEENAN
5.2.2 HIGH R&D COSTS ASSOCIATED WITH THE DEVELOPMENT AND MANUFACTURING OF FOOD THICKENERS
5.2.3 FLUCTUATIONS IN RAW MATERIAL PRICES OF HYDROCOLLOIDS
5.3 OPPORTUNITIES
5.3.1 STRATEGIC DECISIONS BY KEY PLAYERS
5.3.2 ADVANCEMENTS IN THE EXTRACTION AND PROCESSING OF FOOD THICKENERS
5.4 CHALLENGES
5.4.1 STRINGENT GOVERNMENT REGULATIONS
5.4.2 DISTURBANCE IN SUPPLY CHAIN DUE TO COVID-19 PANDEMIC
6 COVID-19 IMPACT ON THE MIDDLE EAST AND AFRICA FOOD THICKENERS MARKET
6.1 AFTERMATH OF COVID-19 AND GOVERNMENT INITIATIVES TO BOOST THE MIDDLE EAST AND AFRICA FOOD THICKENERS MARKET
6.2 STRATEGIC DECISIONS FOR MANUFACTURERS AFTER COVID-19 TO GAIN COMPETITIVE MARKET SHARE
6.3 IMPACT ON PRICE
6.4 IMPACT ON DEMAND
6.5 IMPACT ON SUPPLY CHAIN
6.6 CONCLUSION
7 MIDDLE EAST AND AFRICA FOOD THICKENERS MARKET, BY TYPE
7.1 OVERVIEW
7.2 HYDROCOLLOIDS
7.2.1 HYDROCOLLOIDS, BY TYPE
7.2.1.1 XANTHAN GUM
7.2.1.2 SODIUM ALGINATE
7.2.1.3 LOCUST BEAN GUM
7.2.1.4 GUM ARABIC
7.2.1.5 GAUR GUM
7.2.1.6 GUM KARAYA
7.2.1.7 GUM TRAGACANTH
7.2.1.8 OTHERS
7.2.2 HYDROCOLLOIDS, BY FORM
7.2.2.1 POWDER
7.2.2.2 GRANULES
7.2.2.3 GEL
7.2.2.4 OTHERS
7.3 PROTEIN
7.3.1 PROTEIN, BY TYPE
7.3.1.1 GELATIN
7.3.1.2 COLLAGEN
7.3.1.3 EGG PROTEIN
7.3.2 PROTEIN, BY FORM
7.3.2.1 POWDER
7.3.2.2 GRANULES
7.3.2.3 GEL
7.3.2.4 OTHERS
7.4 STARCH
7.4.1 STARCH, BY TYPE
7.4.1.1 CORN STARCH
7.4.1.2 WHEAT STARCH
7.4.1.3 ARROWROOT STARCH
7.4.1.4 POTATO STARCH
7.4.1.5 RICE STARCH
7.4.1.6 PEA STARCH
7.4.1.7 OTHERS
7.4.2 STARCH, BY FORM
7.4.2.1 POWDER
7.4.2.2 GRANULES
7.4.2.3 GEL
7.4.2.4 OTHERS
7.5 PECTIN
7.5.1 PECTIN, BY FORM
7.5.1.1 POWDER
7.5.1.2 GRANULES
7.5.1.3 GEL
7.5.1.4 OTHERS
7.6 OTHERS
8 MIDDLE EAST AND AFRICA FOOD THICKENERS MARKET, BY FORM
8.1 OVERVIEW
8.2 POWDER
8.3 GRANULES
8.4 GEL
8.5 OTHERS
9 MIDDLE EAST AND AFRICA FOOD THICKENERS MARKET, BY NATURE
9.1 OVERVIEW
9.2 NON-GMO
9.3 GMO
10 MIDDLE EAST AND AFRICA FOOD THICKENERS MARKET, BY SOURCE
10.1 OVERVIEW
10.2 PLANT
10.3 ANIMAL
10.4 MARINE
10.5 MICROBIAL
10.5.1 BACTERIA
10.5.2 YEAST
10.5.3 FUNGI
11 MIDDLE EAST AND AFRICA FOOD THICKENERS MARKET, BY APPLICATION
11.1 OVERVIEW
11.2 FOOD
11.2.1 FROZEN DESSERTS
11.2.2 DAIRY PRODUCTS
11.2.3 FRUIT PREPARATIONS
11.2.4 BAKERY
11.2.5 CONFECTIONERY
11.2.6 MEAT PRODUCTS
11.2.7 CONVENIENCE FOOD
11.2.8 PROCESSED FOOD
11.2.9 DAIRY ALTERNATIVE PRODUCTS
11.2.10 FUNCTIONAL FOOD
11.2.11 SEAFOOD PRODUCTS
11.2.12 SPORTS NUTRITION
11.2.13 MEAT ALTERNATIVE PRODUCTS
11.3 BEVERAGES
11.3.1 JUICES
11.3.2 DAIRY BASED DRINKS
11.3.3 CARBONATED SOFT DRINKS
11.3.4 SMOOTHIES
11.3.5 RTD TEA & COFFEE
11.3.6 SPORTS DRINKS
11.3.7 ENERGY DRINKS
11.3.8 OTHERS
12 MIDDLE EAST AND AFRICA FOOD THICKENERS MARKET, BY REGION
12.1 MIDDLE EAST & AFRICA
12.1.1 SOUTH AFRICA
12.1.2 SAUDI ARABIA
12.1.3 UAE
12.1.4 KUWAIT
12.1.5 REST OF MIDDLE EAST & AFRICA
13 MIDDLE EAST AND AFRICA FOOD THICKENERS MARKET: COMPANY LANDSCAPE
13.1 COMPANY SHARE ANALYSIS: MIDDLE EAST AND AFRICA
14 SWOT ANALYSIS
15 COMPANY PROFILE
15.1 INGREDION INCORPORATED
15.1.1 COMPANY SNAPSHOT
15.1.2 COMPANY SHARE ANALYSIS
15.1.3 REVENUE ANALYSIS
15.1.4 PRODUCT PORTFOLIO
15.1.5 RECENT DEVELOPMENT
15.2 CARGILL, INCORPORATED
15.2.1 COMPANY SNAPSHOT
15.2.2 REVENUE ANALYSIS
15.2.3 COMPANY SHARE ANALYSIS
15.2.4 PRODUCT PORTFOLIO
15.2.5 RECENT DEVELOPMENT
15.3 TATE & LYLE
15.3.1 COMPANY SNAPSHOT
15.3.2 REVENUE ANALYSIS
15.3.3 COMPANY SHARE ANALYSIS
15.3.4 PRODUCT PORTFOLIO
15.3.5 RECENT DEVELOPMENTS
15.4 ADM
15.4.1 COMPANY SNAPSHOT
15.4.2 COMPANY SHARE ANALYSIS
15.4.3 REVENUE ANALYSIS
15.4.4 PRODUCT PORTFOLIO
15.4.5 RECENT DEVELOPMENT
15.5 ASHLAND
15.5.1 COMPANY SNAPSHOT
15.5.2 REVENUE ANALYSIS
15.5.3 COMPANY SHARE ANALYSIS
15.5.4 PRODUCT PORTFOLIO
15.5.5 RECENT DEVELOPMENTS
15.6 CP KELCO
15.6.1 COMPANY SNAPSHOT
15.6.2 PRODUCT PORTFOLIO
15.6.3 RECENT DEVELOPMENTS
15.7 DSM
15.7.1 COMPANY SNAPSHOT
15.7.2 REVENUE ANALYSIS
15.7.3 PRODUCT PORTFOLIO
15.7.4 RECENT DEVELOPMENT
15.8 SOLVAY
15.8.1 COMPANY SNAPSHOT
15.8.2 REVENUE ANALYSIS
15.8.3 PRODUCT PORTFOLIO
15.8.4 RECENT DEVELOPMENT
15.9 DUPONT NUTRITION BIOSCIENCE APS
15.9.1 COMPANY SNAPSHOT
15.9.2 PRODUCT PORTFOLIO
15.9.3 RECENT DEVELOPMENTS
15.1 MEDLINE INDUSTRIES, LP.
15.10.1 COMPANY SNAPSHOT
15.10.2 PRODUCT PORTFOLIO
15.10.3 RECENT DEVELOPMENT
15.11 CHIMIQUE (INDIA) LTD
15.11.1 COMPANY SNAPSHOT
15.11.2 PRODUCT PORTFOLIO
15.11.3 RECENT DEVELOPMENTS
15.12 DEOSEN BIOCHEMICAL (ORDOS) LTD.
15.12.1 COMPANY SNAPSHOT
15.12.2 PRODUCT PORTFOLIO
15.12.3 RECENT DEVELOPMENT
15.13 EMSLAND GROUP
15.13.1 COMPANY SNAPSHOT
15.13.2 PRODUCT PORTFOLIO
15.13.3 RECENT DEVELOPMENTS
15.14 FOODING GROUP LIMITED
15.14.1 COMPANY SNAPSHOT
15.14.2 PRODUCT PORTFOLIO
15.14.3 RECENT DEVELOPMENTS
15.15 GELITA AG
15.15.1 COMPANY SNAPSHOT
15.15.2 PRODUCT PORTFOLIO
15.15.3 RECENT DEVELOPMENT
15.16 GUAR RESOURCES, LLC.
15.16.1 COMPANY SNAPSHOT
15.16.2 PRODUCT PORTFOLIO
15.16.3 RECENT DEVELOPMENT
15.17 HL AGRO PRODUCTS PVT. LTD.
15.17.1 COMPANY SNAPSHOT
15.17.2 PRODUCT PORTFOLIO
15.17.3 RECENT DEVELOPMENT
15.18 JUNGBUNZLAUER SUISSE AG
15.18.1 COMPANY SNAPSHOT
15.18.2 PRODUCT PORTFOLIO
15.18.3 RECENT DEVELOPMENTS
15.19 KENT PRECISION FOODS GROUP, INC.
15.19.1 COMPANY SNAPSHOT
15.19.2 PRODUCT PORTFOLIO
15.19.3 RECENT DEVELOPMENT
15.2 VIKAS WSP LTD.
15.20.1 COMPANY SNAPSHOT
15.20.2 REVENUE ANALYSIS
15.20.3 PRODUCT PORTFOLIO
15.20.4 RECENT DEVELOPMENT
16 QUESTIONNAIRE
17 RELATED REPORTS
List of Table
TABLE 1 REGULATIONS BY HEALTH CANADA-
TABLE 2 HEALTH CANADA REGULATIONS-
TABLE 3 MIDDLE EAST AND AFRICA FOOD THICKENERS MARKET, BY TYPE, 2020-2029 (USD MILLION)
TABLE 4 MIDDLE EAST AND AFRICA FOOD THICKENERS MARKET, BY TYPE, 2020-2029 (THOUSAND TONS)
TABLE 5 MIDDLE EAST AND AFRICA HYDROCOLLOIDS IN FOOD THICKENERS MARKET, BY REGION, 2020-2029 (USD MILLION)
TABLE 6 MIDDLE EAST AND AFRICA HYDROCOLLOIDS IN FOOD THICKENERS MARKET, BY TYPE, 2020-2029 (USD MILLION)
TABLE 7 MIDDLE EAST AND AFRICA HYDROCOLLOIDS IN FOOD THICKENERS MARKET, BY TYPE, 2020-2029 (THOUSAND TONS)
TABLE 8 MIDDLE EAST AND AFRICA HYDROCOLLOIDS IN FOOD THICKENERS MARKET, BY FORM, 2020-2029 (USD MILLION)
TABLE 9 MIDDLE EAST AND AFRICA HYDROCOLLOIDS IN FOOD THICKENERS MARKET, BY FORM, 2020-2029 (THOUSAND TONS)
TABLE 10 MIDDLE EAST AND AFRICA PROTEIN IN FOOD THICKENERS MARKET, BY REGION, 2020-2029 (USD MILLION)
TABLE 11 MIDDLE EAST AND AFRICA PROTEIN IN FOOD THICKENERS MARKET, BY TYPE, 2020-2029 (USD MILLION)
TABLE 12 MIDDLE EAST AND AFRICA PROTEIN IN FOOD THICKENERS MARKET, BY TYPE, 2020-2029 (THOUSAND TONS)
TABLE 13 MIDDLE EAST AND AFRICA PROTEIN IN FOOD THICKENERS MARKET, BY FORM, 2020-2029 (USD MILLION)
TABLE 14 MIDDLE EAST AND AFRICA PROTEIN IN FOOD THICKENERS MARKET, BY FORM, 2020-2029 (THOUSAND TONS)
TABLE 15 MIDDLE EAST AND AFRICA STARCH IN FOOD THICKENERS MARKET, BY REGION, 2020-2029 (USD MILLION)
TABLE 16 MIDDLE EAST AND AFRICA STARCH IN FOOD THICKENERS MARKET, BY TYPE, 2020-2029 (USD MILLION)
TABLE 17 MIDDLE EAST AND AFRICA STARCH IN FOOD THICKENERS MARKET, BY TYPE, 2020-2029 (THOUSAND TONS)
TABLE 18 MIDDLE EAST AND AFRICA STARCH IN FOOD THICKENERS MARKET, BY FORM, 2020-2029 (USD MILLION)
TABLE 19 MIDDLE EAST AND AFRICA STARCH IN FOOD THICKENERS MARKET, BY FORM, 2020-2029 (THOUSAND TONS)
TABLE 20 MIDDLE EAST AND AFRICA PECTIN IN FOOD THICKENERS MARKET, BY REGION, 2020-2029 (USD MILLION)
TABLE 21 MIDDLE EAST AND AFRICA PECTIN IN FOOD THICKENERS MARKET, BY FORM, 2020-2029 (USD MILLION)
TABLE 22 MIDDLE EAST AND AFRICA PECTIN IN FOOD THICKENERS MARKET, BY FORM, 2020-2029 (THOUSAND TONS)
TABLE 23 MIDDLE EAST AND AFRICA OTHERS IN FOOD THICKENERS MARKET, BY REGION, 2020-2029 (USD MILLION)
TABLE 24 MIDDLE EAST AND AFRICA FOOD THICKENERS MARKET, BY FORM, 2020-2029 (USD MILLION)
TABLE 25 MIDDLE EAST AND AFRICA POWDER IN FOOD THICKENERS MARKET, BY REGION, 2020-2029 (USD MILLION)
TABLE 26 MIDDLE EAST AND AFRICA GRANULES IN FOOD THICKENERS MARKET, BY REGION, 2020-2029 (USD MILLION)
TABLE 27 MIDDLE EAST AND AFRICA GEL IN FOOD THICKENERS MARKET, BY REGION, 2020-2029 (USD MILLION)
TABLE 28 MIDDLE EAST AND AFRICA OTHERS IN FOOD THICKENERS MARKET, BY REGION, 2020-2029 (USD MILLION)
TABLE 29 MIDDLE EAST AND AFRICA FOOD THICKENERS MARKET, BY NATURE, 2020-2029 (USD MILLION)
TABLE 30 MIDDLE EAST AND AFRICA NON-GMO IN FOOD THICKENERS MARKET, BY REGION, 2020-2029 (USD MILLION)
TABLE 31 MIDDLE EAST AND AFRICA GMO IN FOOD THICKENERS MARKET, BY REGION, 2020-2029 (USD MILLION)
TABLE 32 MIDDLE EAST AND AFRICA FOOD THICKENERS MARKET, BY SOURCE, 2020-2029 (USD MILLION)
TABLE 33 MIDDLE EAST AND AFRICA PLANT IN FOOD THICKENERS MARKET, BY REGION, 2020-2029 (USD MILLION)
TABLE 34 MIDDLE EAST AND AFRICA ANIMAL IN FOOD THICKENERS MARKET, BY REGION, 2020-2029 (USD MILLION)
TABLE 35 MIDDLE EAST AND AFRICA MARINE IN FOOD THICKENERS MARKET, BY REGION, 2020-2029 (USD MILLION)
TABLE 36 MIDDLE EAST AND AFRICA MICROBIAL IN FOOD THICKENERS MARKET, BY REGION, 2020-2029 (USD MILLION)
TABLE 37 MIDDLE EAST AND AFRICA MICROBIAL IN FOOD THICKENERS MARKET, BY SOURCE, 2020-2029 (USD MILLION)
TABLE 38 MIDDLE EAST AND AFRICA FOOD THICKENERS MARKET, BY APPLICATION, 2020-2029 (USD MILLION)
TABLE 39 MIDDLE EAST AND AFRICA FOOD IN FOOD THICKENERS MARKET, BY REGION, 2020-2029 (USD MILLION)
TABLE 40 MIDDLE EAST AND AFRICA FOOD IN FOOD THICKENERS MARKET, BY APPLICATION, 2020-2029 (USD MILLION)
TABLE 41 MIDDLE EAST AND AFRICA BEVERAGES IN FOOD THICKENERS MARKET, BY REGION, 2020-2029 (USD MILLION)
TABLE 42 MIDDLE EAST AND AFRICA BEVERAGES IN FOOD THICKENERS MARKET, BY APPLICATION, 2020-2029 (USD MILLION)
TABLE 43 MIDDLE EAST & AFRICA FOOD THICKENERS MARKET, BY COUNTRY, 2020-2029 (USD MILLION)
TABLE 44 MIDDLE EAST & AFRICA FOOD THICKENERS MARKET, BY COUNTRY, 2020-2029 (THOUSAND TONS)
TABLE 45 MIDDLE EAST & AFRICA FOOD THICKENERS MARKET, BY TYPE, 2020-2029 (USD MILLION)
TABLE 46 MIDDLE EAST & AFRICA FOOD THICKENERS MARKET, BY TYPE, 2020-2029 (THOUSAND TONS)
TABLE 47 MIDDLE EAST & AFRICA STARCH IN FOOD THICKENERS MARKET, BY TYPE, 2020-2029 (USD MILLION)
TABLE 48 MIDDLE EAST & AFRICA STARCH IN FOOD THICKENERS MARKET, BY TYPE, 2020-2029 (THOUSAND TONS)
TABLE 49 MIDDLE EAST & AFRICA STARCH IN FOOD THICKENERS MARKET, BY FORM, 2020-2029 (USD MILLION)
TABLE 50 MIDDLE EAST & AFRICA STARCH IN FOOD THICKENERS MARKET, BY FORM, 2020-2029 (THOUSAND TONS)
TABLE 51 MIDDLE EAST & AFRICA PECTIN IN FOOD THICKENERS MARKET, BY FORM, 2020-2029 (USD MILLION)
TABLE 52 MIDDLE EAST & AFRICA PECTIN IN FOOD THICKENERS MARKET, BY FORM, 2020-2029 (THOUSAND TONS)
TABLE 53 MIDDLE EAST & AFRICA HYDROCOLLOIDS IN FOOD THICKENERS MARKET, BY TYPE, 2020-2029 (USD MILLION)
TABLE 54 MIDDLE EAST & AFRICA HYDROCOLLOIDS IN FOOD THICKENERS MARKET, BY TYPE, 2020-2029 (THOUSAND TONS)
TABLE 55 MIDDLE EAST & AFRICA HYDROCOLLOIDS IN FOOD THICKENERS MARKET, BY FORM, 2020-2029 (USD MILLION)
TABLE 56 MIDDLE EAST & AFRICA HYDROCOLLOIDS IN FOOD THICKENERS MARKET, BY FORM, 2020-2029 (THOUSAND TONS)
TABLE 57 MIDDLE EAST & AFRICA PROTEIN IN FOOD THICKENERS MARKET, BY TYPE, 2020-2029 (USD MILLION)
TABLE 58 MIDDLE EAST & AFRICA PROTEIN IN FOOD THICKENERS MARKET, BY TYPE, 2020-2029 (THOUSAND TONS)
TABLE 59 MIDDLE EAST & AFRICA PROTEIN IN FOOD THICKENERS MARKET, BY FORM, 2020-2029 (USD MILLION)
TABLE 60 MIDDLE EAST & AFRICA PROTEIN IN FOOD THICKENERS MARKET, BY FORM, 2020-2029 (THOUSAND TONS)
TABLE 61 MIDDLE EAST & AFRICA FOOD THICKENERS MARKET, BY FORM, 2020-2029 (USD MILLION)
TABLE 62 MIDDLE EAST & AFRICA FOOD THICKENERS MARKET, BY NATURE, 2020-2029 (USD MILLION)
TABLE 63 MIDDLE EAST & AFRICA FOOD THICKENERS MARKET, BY SOURCE, 2020-2029 (USD MILLION)
TABLE 64 MIDDLE EAST & AFRICA MICROBIAL IN FOOD THICKENERS MARKET, BY SOURCE, 2020-2029 (USD MILLION)
TABLE 65 MIDDLE EAST & AFRICA FOOD THICKENERS MARKET, BY APPLICATION, 2020-2029 (USD MILLION)
TABLE 66 MIDDLE EAST & AFRICA FOOD IN FOOD THICKENERS MARKET, BY APPLICATION, 2020-2029 (USD MILLION)
TABLE 67 MIDDLE EAST & AFRICA BEVERAGES IN FOOD THICKENERS MARKET, BY APPLICATION, 2020-2029 (USD MILLION)
TABLE 68 SOUTH AFRICA FOOD THICKENERS MARKET, BY TYPE, 2020-2029 (USD MILLION)
TABLE 69 SOUTH AFRICA FOOD THICKENERS MARKET, BY TYPE, 2020-2029 (THOUSAND TONS)
TABLE 70 SOUTH AFRICA STARCH IN FOOD THICKENERS MARKET, BY TYPE, 2020-2029 (USD MILLION)
TABLE 71 SOUTH AFRICA STARCH IN FOOD THICKENERS MARKET, BY TYPE, 2020-2029 (THOUSAND TONS)
TABLE 72 SOUTH AFRICA STARCH IN FOOD THICKENERS MARKET, BY FORM, 2020-2029 (USD MILLION)
TABLE 73 SOUTH AFRICA STARCH IN FOOD THICKENERS MARKET, BY FORM, 2020-2029 (THOUSAND TONS)
TABLE 74 SOUTH AFRICA PECTIN IN FOOD THICKENERS MARKET, BY FORM, 2020-2029 (USD MILLION)
TABLE 75 SOUTH AFRICA PECTIN IN FOOD THICKENERS MARKET, BY FORM, 2020-2029 (THOUSAND TONS)
TABLE 76 SOUTH AFRICA HYDROCOLLOIDS IN FOOD THICKENERS MARKET, BY TYPE, 2020-2029 (USD MILLION)
TABLE 77 SOUTH AFRICA HYDROCOLLOIDS IN FOOD THICKENERS MARKET, BY TYPE, 2020-2029 (THOUSAND TONS)
TABLE 78 SOUTH AFRICA HYDROCOLLOIDS IN FOOD THICKENERS MARKET, BY FORM, 2020-2029 (USD MILLION)
TABLE 79 SOUTH AFRICA HYDROCOLLOIDS IN FOOD THICKENERS MARKET, BY FORM, 2020-2029 (THOUSAND TONS)
TABLE 80 SOUTH AFRICA PROTEIN IN FOOD THICKENERS MARKET, BY TYPE, 2020-2029 (USD MILLION)
TABLE 81 SOUTH AFRICA PROTEIN IN FOOD THICKENERS MARKET, BY TYPE, 2020-2029 (THOUSAND TONS)
TABLE 82 SOUTH AFRICA PROTEIN IN FOOD THICKENERS MARKET, BY FORM, 2020-2029 (USD MILLION)
TABLE 83 SOUTH AFRICA PROTEIN IN FOOD THICKENERS MARKET, BY FORM, 2020-2029 (THOUSAND TONS)
TABLE 84 SOUTH AFRICA FOOD THICKENERS MARKET, BY FORM, 2020-2029 (USD MILLION)
TABLE 85 SOUTH AFRICA FOOD THICKENERS MARKET, BY NATURE, 2020-2029 (USD MILLION)
TABLE 86 SOUTH AFRICA FOOD THICKENERS MARKET, BY SOURCE, 2020-2029 (USD MILLION)
TABLE 87 SOUTH AFRICA MICROBIAL IN FOOD THICKENERS MARKET, BY SOURCE, 2020-2029 (USD MILLION)
TABLE 88 SOUTH AFRICA FOOD THICKENERS MARKET, BY APPLICATION, 2020-2029 (USD MILLION)
TABLE 89 SOUTH AFRICA FOOD IN FOOD THICKENERS MARKET, BY APPLICATION, 2020-2029 (USD MILLION)
TABLE 90 SOUTH AFRICA BEVERAGES IN FOOD THICKENERS MARKET, BY APPLICATION, 2020-2029 (USD MILLION)
TABLE 91 SAUDI ARABIA FOOD THICKENERS MARKET, BY TYPE, 2020-2029 (USD MILLION)
TABLE 92 SAUDI ARABIA FOOD THICKENERS MARKET, BY TYPE, 2020-2029 (THOUSAND TONS)
TABLE 93 SAUDI ARABIA STARCH IN FOOD THICKENERS MARKET, BY TYPE, 2020-2029 (USD MILLION)
TABLE 94 SAUDI ARABIA STARCH IN FOOD THICKENERS MARKET, BY TYPE, 2020-2029 (THOUSAND TONS)
TABLE 95 SAUDI ARABIA STARCH IN FOOD THICKENERS MARKET, BY FORM, 2020-2029 (USD MILLION)
TABLE 96 SAUDI ARABIA STARCH IN FOOD THICKENERS MARKET, BY FORM, 2020-2029 (THOUSAND TONS)
TABLE 97 SAUDI ARABIA PECTIN IN FOOD THICKENERS MARKET, BY FORM, 2020-2029 (USD MILLION)
TABLE 98 SAUDI ARABIA PECTIN IN FOOD THICKENERS MARKET, BY FORM, 2020-2029 (THOUSAND TONS)
TABLE 99 SAUDI ARABIA HYDROCOLLOIDS IN FOOD THICKENERS MARKET, BY TYPE, 2020-2029 (USD MILLION)
TABLE 100 SAUDI ARABIA HYDROCOLLOIDS IN FOOD THICKENERS MARKET, BY TYPE, 2020-2029 (THOUSAND TONS)
TABLE 101 SAUDI ARABIA HYDROCOLLOIDS IN FOOD THICKENERS MARKET, BY FORM, 2020-2029 (USD MILLION)
TABLE 102 SAUDI ARABIA HYDROCOLLOIDS IN FOOD THICKENERS MARKET, BY FORM, 2020-2029 (THOUSAND TONS)
TABLE 103 SAUDI ARABIA PROTEIN IN FOOD THICKENERS MARKET, BY TYPE, 2020-2029 (USD MILLION)
TABLE 104 SAUDI ARABIA PROTEIN IN FOOD THICKENERS MARKET, BY TYPE, 2020-2029 (THOUSAND TONS)
TABLE 105 SAUDI ARABIA PROTEIN IN FOOD THICKENERS MARKET, BY FORM, 2020-2029 (USD MILLION)
TABLE 106 SAUDI ARABIA PROTEIN IN FOOD THICKENERS MARKET, BY FORM, 2020-2029 (THOUSAND TONS)
TABLE 107 SAUDI ARABIA FOOD THICKENERS MARKET, BY FORM, 2020-2029 (USD MILLION)
TABLE 108 SAUDI ARABIA FOOD THICKENERS MARKET, BY NATURE, 2020-2029 (USD MILLION)
TABLE 109 SAUDI ARABIA FOOD THICKENERS MARKET, BY SOURCE, 2020-2029 (USD MILLION)
TABLE 110 SAUDI ARABIA MICROBIAL IN FOOD THICKENERS MARKET, BY SOURCE, 2020-2029 (USD MILLION)
TABLE 111 SAUDI ARABIA FOOD THICKENERS MARKET, BY APPLICATION, 2020-2029 (USD MILLION)
TABLE 112 SAUDI ARABIA FOOD IN FOOD THICKENERS MARKET, BY APPLICATION, 2020-2029 (USD MILLION)
TABLE 113 SAUDI ARABIA BEVERAGES IN FOOD THICKENERS MARKET, BY APPLICATION, 2020-2029 (USD MILLION)
TABLE 114 UAE FOOD THICKENERS MARKET, BY TYPE, 2020-2029 (USD MILLION)
TABLE 115 UAE FOOD THICKENERS MARKET, BY TYPE, 2020-2029 (THOUSAND TONS)
TABLE 116 UAE STARCH IN FOOD THICKENERS MARKET, BY TYPE, 2020-2029 (USD MILLION)
TABLE 117 UAE STARCH IN FOOD THICKENERS MARKET, BY TYPE, 2020-2029 (THOUSAND TONS)
TABLE 118 UAE STARCH IN FOOD THICKENERS MARKET, BY FORM, 2020-2029 (USD MILLION)
TABLE 119 UAE STARCH IN FOOD THICKENERS MARKET, BY FORM, 2020-2029 (THOUSAND TONS)
TABLE 120 UAE PECTIN IN FOOD THICKENERS MARKET, BY FORM, 2020-2029 (USD MILLION)
TABLE 121 UAE PECTIN IN FOOD THICKENERS MARKET, BY FORM, 2020-2029 (THOUSAND TONS)
TABLE 122 UAE HYDROCOLLOIDS IN FOOD THICKENERS MARKET, BY TYPE, 2020-2029 (USD MILLION)
TABLE 123 UAE HYDROCOLLOIDS IN FOOD THICKENERS MARKET, BY TYPE, 2020-2029 (THOUSAND TONS)
TABLE 124 UAE HYDROCOLLOIDS IN FOOD THICKENERS MARKET, BY FORM, 2020-2029 (USD MILLION)
TABLE 125 UAE HYDROCOLLOIDS IN FOOD THICKENERS MARKET, BY FORM, 2020-2029 (THOUSAND TONS)
TABLE 126 UAE PROTEIN IN FOOD THICKENERS MARKET, BY TYPE, 2020-2029 (USD MILLION)
TABLE 127 UAE PROTEIN IN FOOD THICKENERS MARKET, BY TYPE, 2020-2029 (THOUSAND TONS)
TABLE 128 UAE PROTEIN IN FOOD THICKENERS MARKET, BY FORM, 2020-2029 (USD MILLION)
TABLE 129 UAE PROTEIN IN FOOD THICKENERS MARKET, BY FORM, 2020-2029 (THOUSAND TONS)
TABLE 130 UAE FOOD THICKENERS MARKET, BY FORM, 2020-2029 (USD MILLION)
TABLE 131 UAE FOOD THICKENERS MARKET, BY NATURE, 2020-2029 (USD MILLION)
TABLE 132 UAE FOOD THICKENERS MARKET, BY SOURCE, 2020-2029 (USD MILLION)
TABLE 133 UAE MICROBIAL IN FOOD THICKENERS MARKET, BY SOURCE, 2020-2029 (USD MILLION)
TABLE 134 UAE FOOD THICKENERS MARKET, BY APPLICATION, 2020-2029 (USD MILLION)
TABLE 135 UAE FOOD IN FOOD THICKENERS MARKET, BY APPLICATION, 2020-2029 (USD MILLION)
TABLE 136 UAE BEVERAGES IN FOOD THICKENERS MARKET, BY APPLICATION, 2020-2029 (USD MILLION)
TABLE 137 KUWAIT FOOD THICKENERS MARKET, BY TYPE, 2020-2029 (USD MILLION)
TABLE 138 KUWAIT FOOD THICKENERS MARKET, BY TYPE, 2020-2029 (THOUSAND TONS)
TABLE 139 KUWAIT STARCH IN FOOD THICKENERS MARKET, BY TYPE, 2020-2029 (USD MILLION)
TABLE 140 KUWAIT STARCH IN FOOD THICKENERS MARKET, BY TYPE, 2020-2029 (THOUSAND TONS)
TABLE 141 KUWAIT STARCH IN FOOD THICKENERS MARKET, BY FORM, 2020-2029 (USD MILLION)
TABLE 142 KUWAIT STARCH IN FOOD THICKENERS MARKET, BY FORM, 2020-2029 (THOUSAND TONS)
TABLE 143 KUWAIT PECTIN IN FOOD THICKENERS MARKET, BY FORM, 2020-2029 (USD MILLION)
TABLE 144 KUWAIT PECTIN IN FOOD THICKENERS MARKET, BY FORM, 2020-2029 (THOUSAND TONS)
TABLE 145 KUWAIT HYDROCOLLOIDS IN FOOD THICKENERS MARKET, BY TYPE, 2020-2029 (USD MILLION)
TABLE 146 KUWAIT HYDROCOLLOIDS IN FOOD THICKENERS MARKET, BY TYPE, 2020-2029 (THOUSAND TONS)
TABLE 147 KUWAIT HYDROCOLLOIDS IN FOOD THICKENERS MARKET, BY FORM, 2020-2029 (USD MILLION)
TABLE 148 KUWAIT HYDROCOLLOIDS IN FOOD THICKENERS MARKET, BY FORM, 2020-2029 (THOUSAND TONS)
TABLE 149 KUWAIT PROTEIN IN FOOD THICKENERS MARKET, BY TYPE, 2020-2029 (USD MILLION)
TABLE 150 KUWAIT PROTEIN IN FOOD THICKENERS MARKET, BY TYPE, 2020-2029 (THOUSAND TONS)
TABLE 151 KUWAIT PROTEIN IN FOOD THICKENERS MARKET, BY FORM, 2020-2029 (USD MILLION)
TABLE 152 KUWAIT PROTEIN IN FOOD THICKENERS MARKET, BY FORM, 2020-2029 (THOUSAND TONS)
TABLE 153 KUWAIT FOOD THICKENERS MARKET, BY FORM, 2020-2029 (USD MILLION)
TABLE 154 KUWAIT FOOD THICKENERS MARKET, BY NATURE, 2020-2029 (USD MILLION)
TABLE 155 KUWAIT FOOD THICKENERS MARKET, BY SOURCE, 2020-2029 (USD MILLION)
TABLE 156 KUWAIT MICROBIAL IN FOOD THICKENERS MARKET, BY SOURCE, 2020-2029 (USD MILLION)
TABLE 157 KUWAIT FOOD THICKENERS MARKET, BY APPLICATION, 2020-2029 (USD MILLION)
TABLE 158 KUWAIT FOOD IN FOOD THICKENERS MARKET, BY APPLICATION, 2020-2029 (USD MILLION)
TABLE 159 KUWAIT BEVERAGES IN FOOD THICKENERS MARKET, BY APPLICATION, 2020-2029 (USD MILLION)
TABLE 160 REST OF MIDDLE EAST & AFRICA FOOD THICKENERS MARKET, BY TYPE, 2020-2029 (USD MILLION)
TABLE 161 REST OF MIDDLE EAST & AFRICA FOOD THICKENERS MARKET, BY TYPE, 2020-2029 (THOUSAND TONS)
List of Figure
FIGURE 1 MIDDLE EAST AND AFRICA FOOD THICKENERS MARKET: SEGMENTATION
FIGURE 2 MIDDLE EAST AND AFRICA FOOD THICKENERS MARKET: DATA TRIANGULATION
FIGURE 3 MIDDLE EAST AND AFRICA FOOD THICKENERS MARKET : DROC ANALYSIS
FIGURE 4 MIDDLE EAST AND AFRICA FOOD THICKENERS MARKET: MIDDLE EAST AND AFRICA VS REGIONAL ANALYSIS
FIGURE 5 MIDDLE EAST AND AFRICA FOOD THICKENERS MARKET: COMPANY RESEARCH ANALYSIS
FIGURE 6 MIDDLE EAST AND AFRICA FOOD THICKENERS MARKET: INTERVIEW DEMOGRAPHICS
FIGURE 8 MIDDLE EAST AND AFRICA FOOD THICKENERS MARKET: VENDOR SHARE ANALYSIS
FIGURE 9 MIDDLE EAST AND AFRICA FOOD THICKENERS MARKET: SEGMENTATION
FIGURE 10 RISING DEMAND FOR FRUIT JUICES IS EXPECTED TO DRIVE THE GROWTH OF THE MIDDLE EAST AND AFRICA FOOD THICKENERS MARKET IN THE FORECAST PERIOD
FIGURE 11 PRODUCT SEGMENT IS EXPECTED TO ACCOUNT FOR THE LARGEST SHARE OF THE MIDDLE EAST AND AFRICA FOOD THICKENERS MARKET IN 2022 & 2029
FIGURE 12 DRIVERS, RESTRAINTS, OPPORTUNITIES, AND CHALLENGES OF MIDDLE EAST AND AFRICA FOOD THICKENERS MARKET
FIGURE 13 MIDDLE EAST AND AFRICA FOOD THICKENERS MARKET: BY TYPE, 2021
FIGURE 14 MIDDLE EAST AND AFRICA FOOD THICKENERS MARKET: BY FORM, 2021
FIGURE 15 MIDDLE EAST AND AFRICA FOOD THICKENERS MARKET: BY NATURE, 2021
FIGURE 16 MIDDLE EAST AND AFRICA FOOD THICKENERS MARKET, BY SOURCE, 2021
FIGURE 17 MIDDLE EAST AND AFRICA FAT REPLACERS MARKET: BY APPLICATION, 2021
FIGURE 18 MIDDLE EAST & AFRICA FOOD THICKENERS MARKET: SNAPSHOT (2021)
FIGURE 19 MIDDLE EAST & AFRICA FOOD THICKENERS MARKET: BY COUNTRY (2021)
FIGURE 20 MIDDLE EAST & AFRICA FOOD THICKENERS MARKET: BY COUNTRY (2022 & 2029)
FIGURE 21 MIDDLE EAST & AFRICA FOOD THICKENERS MARKET: BY COUNTRY (2021 & 2029)
FIGURE 22 MIDDLE EAST & AFRICA FOOD THICKENERS MARKET: BY TYPE (2022 & 2029)
FIGURE 23 MIDDLE EAST AND AFRICA FOOD THICKENERS MARKET: COMPANY SHARE 2021 (%)
Middle East And Africa Food Thickeners Market, Supply Chain Analysis and Ecosystem Framework
To support market growth and help clients navigate the impact of geopolitical shifts, DBMR has integrated in-depth supply chain analysis into its Middle East And Africa Food Thickeners Market research reports. This addition empowers clients to respond effectively to global changes affecting their industries. The supply chain analysis section includes detailed insights such as Middle East And Africa Food Thickeners Market consumption and production by country, price trend analysis, the impact of tariffs and geopolitical developments, and import and export trends by country and HSN code. It also highlights major suppliers with data on production capacity and company profiles, as well as key importers and exporters. In addition to research, DBMR offers specialized supply chain consulting services backed by over a decade of experience, providing solutions like supplier discovery, supplier risk assessment, price trend analysis, impact evaluation of inflation and trade route changes, and comprehensive market trend analysis.
Data collection and base year analysis are done using data collection modules with large sample sizes. The stage includes obtaining market information or related data through various sources and strategies. It includes examining and planning all the data acquired from the past in advance. It likewise envelops the examination of information inconsistencies seen across different information sources. The market data is analysed and estimated using market statistical and coherent models. Also, market share analysis and key trend analysis are the major success factors in the market report. To know more, please request an analyst call or drop down your inquiry.
The key research methodology used by DBMR research team is data triangulation which involves data mining, analysis of the impact of data variables on the market and primary (industry expert) validation. Data models include Vendor Positioning Grid, Market Time Line Analysis, Market Overview and Guide, Company Positioning Grid, Patent Analysis, Pricing Analysis, Company Market Share Analysis, Standards of Measurement, Global versus Regional and Vendor Share Analysis. To know more about the research methodology, drop in an inquiry to speak to our industry experts.
Data Bridge Market Research is a leader in advanced formative research. We take pride in servicing our existing and new customers with data and analysis that match and suits their goal. The report can be customized to include price trend analysis of target brands understanding the market for additional countries (ask for the list of countries), clinical trial results data, literature review, refurbished market and product base analysis. Market analysis of target competitors can be analyzed from technology-based analysis to market portfolio strategies. We can add as many competitors that you require data about in the format and data style you are looking for. Our team of analysts can also provide you data in crude raw excel files pivot tables (Fact book) or can assist you in creating presentations from the data sets available in the report.


