
 Market Analysis and Insights: Middle East and Africa Parcel Sortation Systems Market
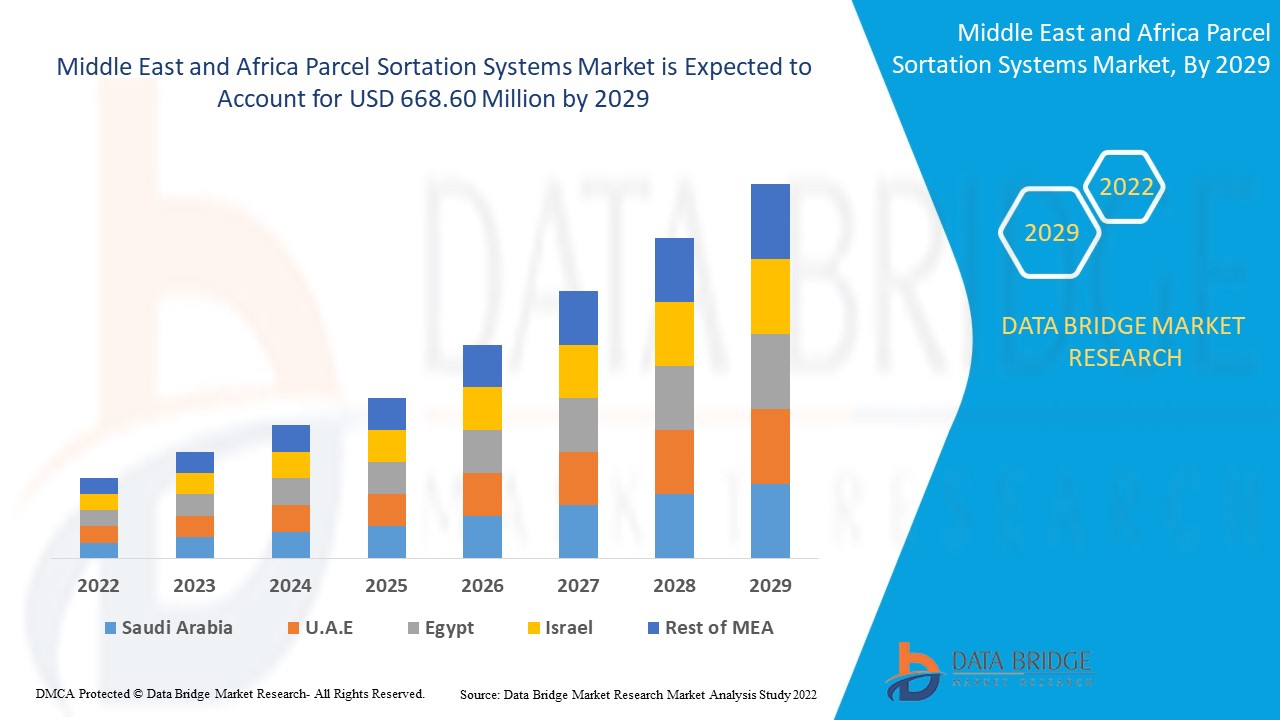
Middle East & Africa Parcel Sortation Systems market is expected to gain market growth in the forecast period of 2022 to 2029. Data Bridge Market Research analyses that the market is growing with the CAGR of 12.4% in the forecast period of 2022 to 2029 and is expected to reach 668.60 million by 2029.
Parcel sortation is the process of identifying items on a conveyor system and diverting them to specific destinations using various devices controlled by task-specific software. They can also read any applicable labels or even apply new ones. These operations are incredibly important to ensuring the packages get to their final destination, but arranging deliveries is the task that provides the most direct benefit to that end. Parcel sortation the containers into the correct delivery areas to get them on their way to their final destination. Sortation can have a great impact on the efficiency of your fulfillment automation. Parcels come in a variety of shapes and sizes and need to be arranged accordingly. Conveyor systems and other mechanical processes can help streamline your fulfillment automation and keep things moving. In a distribution center, parcel sortation can be applicable at different steps of the order fulfillment process, such as receiving, picking, packing, and shipping. The selection of sortation systems is decided considering the following characteristics such as the fragility of the material to be handled, product geometry, materials, rate consideration, sorter function, available footprint, among others.
There is an increasing investment in logistics infrastructure in urban planning, which acts as a major factor for the growth of the market. The developments in technologies such as AI and robots for sorting operations has boosted the growth of the market. However, the incorporation of automation technologies regulated by the government can act as a significant restraint for the development of the market. Middle East & Africa region has witnessed increasing adoption of automated sortation systems at airports to handle the increasing traffic, this opens up opportunities in the market. High customer expectations pertaining to delivery timelines can act as a major challenge for the growth of the market.
This parcel sortation systems market report provides details of market share, new developments, and product pipeline analysis, the impact of domestic and localized market players, analyses opportunities in terms of emerging revenue pockets, changes in market regulations, product approvals, strategic decisions, product launches, geographic expansions, and technological innovations in the market. To understand the analysis and the market scenario, contact us for an Analyst Brief, our team will help you create a revenue impact solution to achieve your desired goal.
 Middle East & Africa Parcel Sortation Systems Market Scope and Market Size
Middle East & Africa Parcel Sortation Systems market is segmented into five notable segments based on type, offering, tray size, parcel handling capacity, and end user.
- On the basis of type, the Asia-Pacific Parcel Sortation Systems market is segmented into linear parcel sortation systems and loop parcel sortation systems. In 2022, the linear parcel sortation systems segment is expected to dominate the market as it offers several benefits, including higher throughput, and requires less space comparatively. The small and medium fulfillment centers are increasingly adopting this system in the region to handle the increased volumes of parcels
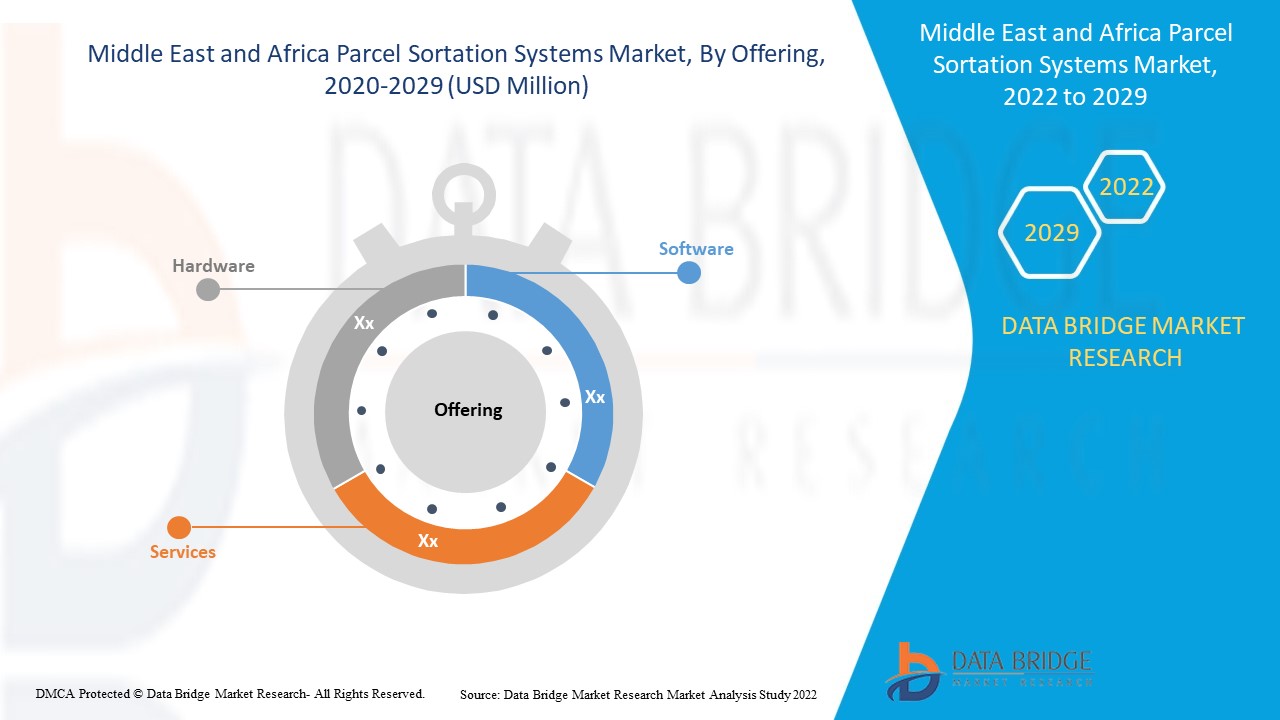
- On the basis of offering, the global Parcel Sortation Systems market is segmented into hardware, software, and services. In 2022, hardware segment is expected to dominate the market, as hardware-based sortation systems increase sorting efficiency. In addition, hardware implementation can speed up sorting applications and makes extensive use of concurrent data comparisons and swaps each clock cycle
- On the basis of tray size, the global Parcel Sortation Systems market is segmented into small, medium, and large. In 2022, the medium segment is expected to dominate the market as the number of the medium sized package is increasing in the logistic hubs owing to increased e commerce trade which requires medium sized trays and fuels the adoption of medium tray size in the parcel sortation systems market
- On the basis of parcel handling capacity, the global Parcel Sortation Systems market is segmented into less than 20000 parcels/hr, 20000 to 30000 parcels/hr, and more than 30000 parcels/hr. In 2022, less than 20000 Parcels/hr is expected to dominate the market as the adoption of sortation systems among the small and medium sized enterprises are increasing, which has a lower volume of parcels to handle and have limited spending power
- On the basis of end users, the global Parcel Sortation Systems market is segmented into logistics, e commerce, pharmaceutical, medical supply, food & beverages, and others. In 2022, e-commerce is expected to dominate the market as ecommerce industry is growing exponentially in recent years, which also increases the number of parcels to be sorted and delivered to customers worldwide
Middle East & Africa Parcel Sortation Systems Market Country Level Analysis
The Middle East & Africa Parcel Sortation Systems market is analysed, and market size information is provided by country, type, offering, tray size, parcel handling capacity, and end user.
The countries covered in Middle East & Africa Parcel Sortation Systems market report are U.A.E., Saudi Arabia, Israel, Egypt, South Africa, and Rest of the Middle East & Africa.
Israel is dominating the market in the Middle East & Africa region due to the increasing adoption of automation in the logistics sector and technological incorporations such as IoT for process monitoring and data collection to gain business insights on sortation systems for supply chain efficiency.
The country section of the report also provides individual market impacting factors and changes in regulation in the market domestically that affects the current and future trends of the market. Data points such as new sales, replacement sales, country demographics, regulatory acts, and import-export tariffs are some of the major pointers used to forecast the market scenario for individual countries. Also, the presence and availability of global brands and their challenges faced due to significant or scarce competition from local and domestic brands, impact of sales channels are considered while providing forecast analysis of the country data.
Rising Demand of Parcel Sortation Systems
The Middle East & Africa Parcel Sortation Systems market also provides you with detailed market analysis for every country growth in industry with sales, components sales, the impact of technological development in Parcel Sortation Systems, and changes in regulatory scenarios with their support for the Parcel Sortation Systems market. The data is available for historic period 2012 to 2020.
Competitive Landscape and Middle East & Africa Parcel Sortation Systems Market Share Analysis
Middle East & Africa Parcel Sortation Systems market competitive landscape provides details by competitor. Details included are company overview, company financials, revenue generated, market potential, investment in research and development, new market initiatives, global presence, production sites and facilities, company strengths and weaknesses, product launch, product trials pipelines, product approvals, patents, product width and breadth, application dominance, technology lifeline curve. The above data points provided are only related to the companies’ focus related to Middle East & Africa Parcel Sortation Systems market.
The major players covered in the report are Siemens Logistics GmbH (A Subsidiary of Siemens AG), BEUMER GROUP, FIVES, Dematic, Murata Machinery, Ltd., Interroll Group, BOWE SYSTEC GMBH, and Honeywell International Inc., among other domestic players. DBMR analysts understand competitive strengths and provide competitive analysis for each competitor separately.
Many product developments are also initiated by the companies worldwide, which are also accelerating the growth of Middle East & Africa Parcel Sortation Systems market.
For instance,
- In September 2019, BOWE SYSTEC GMBH announced the launch of Double Split-Tray sorter at the Parcel+Post Expo in Amsterdam. The new system was designed for sorting light items weighing up to 5 kilograms. It was able to sort products such as clothing, books, pharmaceuticals, polybags, multimedia, and flat items, or jewellery. With this, the company was able to offer sorters able to handle parcels of varying shapes and sizes, which enhanced the company's product portfolio in the market for parcels sortation systems.
- In June 2021, Interroll Group announced the launch of MX 018V Vertical Crossbelt Sorter. The new product is enabled with cost-saving, energy-efficient, easy to maintain, and made it easier for system integrators and their end customers to enter the world of ,automated crossbelt sortation solutions. It enabled courier and parcel service providers, e-commerce providers, and logistics service providers to gain the ability to handle a high variety of goods in a space-saving, gentle and energy-efficient manner via a single technical infrastructure with an increased number of end points. This enhanced the company’s product portfolio.
Partnership, joint ventures, and other strategies enhance the company's market share with increased coverage and presence. It also provides the benefit for an organisation to improve their offering for Parcel Sortation Systems through expanded range of size.
SKU-

- Interactive Data Analysis Dashboard
- Company Analysis Dashboard for high growth potential opportunities
- Research Analyst Access for customization & queries
- Competitor Analysis with Interactive dashboard
- Latest News, Updates & Trend analysis
- Harness the Power of Benchmark Analysis for Comprehensive Competitor Tracking
Table of Content
1 INTRODUCTION
1.1 OBJECTIVES OF THE STUDY
1.2 MARKET DEFINITION
1.3 OVERVIEW OF MIDDLE EAST & AFRICA PARCEL SORTATION SYSTEMS MARKET
1.4 CURRENCY AND PRICING
1.5 LIMITATIONS
1.6 MARKETS COVERED
2 MARKET SEGMENTATION
2.1 MARKETS COVERED
2.2 GEOGRAPHICAL SCOPE
2.3 YEARS CONSIDERED FOR THE STUDY
2.4 DBMR TRIPOD DATA VALIDATION MODEL
2.5 PRIMARY INTERVIEWS WITH KEY OPINION LEADERS
2.6 DBMR MARKET POSITION GRID
2.7 VENDOR SHARE ANALYSIS
2.8 END USER COVERAGE GRID
2.9 MULTIVARIATE MODELING
2.1 TYPE TIMELINE CURVE
2.11 SECONDARY SOURCES
2.12 ASSUMPTIONS
3 EXECUTIVE SUMMARY
4 PREMIUM INSIGHTS
4.1 TRENDS
4.1.1 INTERNET BUYING CONTINUES TO GROW EXPONENTIALLY
4.1.2 SAME DAY DELIVERY TREND
4.1.3 FREE SHIPPING IS A COMMON INCENTIVE TO SELL PRODUCT
4.1.4 LARGE ITEMS BROUGHT ONLINE
4.1.5 INCREASE IN DEMAND FOR HOME DELIVERY ITEMS
5 MARKET OVERVIEW
5.1 DRIVERS
5.1.1 CONTINUOUS DEVELOPMENT IN THE MIDDLE EAST & AFRICA E-COMMERCE INDUSTRY
5.1.2 MINIMIZING MANUAL INTERVENTION AND REDUCING LABOR COSTS
5.1.3 DEVELOPMENTS IN TECHNOLOGIES SUCH AS AI AND ROBOTS FOR SORTING OPERATIONS
5.1.4 INCREASING NEED TO REDUCE THE LAST MILE DELIVERY COSTS
5.1.5 LOGISTICS INFRASTRUCTURE DEVELOPMENTS WITH URBAN PLANNING
5.2 RESTRAINTS
5.2.1 HIGH INITIAL INVESTMENTS
5.2.2 GOVERNMENT REGULATIONS IMPOSED ON AUTOMATION TECHNOLOGIES
5.3 OPPORTUNITIES
5.3.1 WIDESPREAD ADOPTION OF IOT TECHNOLOGY
5.3.2 INTEGRATION OF AUTOMATIC PARCEL SINGULATOR IN SORTATION SYSTEM
5.3.3 INCREASING ADOPTION OF AUTOMATED SORTATION SYSTEMS AT AIRPORTS TO HANDLE THE INCREASING TRAFFIC
5.3.4 HIGH INVESTMENTS IN SUPPLY CHAIN AUTOMATION
5.4 CHALLENGES
5.4.1 HIGH VARIETY IN PARCEL SIZES AND VOLUME
5.4.2 SHORTAGE OF SKILLED PROFESSIONAL AND TECHNICAL EXPERTISE
5.4.3 HIGH CUSTOMER EXPECTATIONS ABOUT DELIVERY TIMELINES
5.4.4 COMPLEXITIES IN AUTOMATION INTEGRITY
5.4.5 PROPER UTILIZATION OF SPACE
6 IMPACT ON COVID-19 ON THE MIDDLE EAST & AFRICA PARCEL SORTATION SYSTEMS MARKET
6.1 ANALYSIS ON IMPACT OF COVID-19 ON THE MARKET
6.2 AFTERMATH OF COVID-19 AND GOVERNMENT INITIATIVE TO BOOST THE MARKET
6.3 STRATEGIC DECISIONS FOR MANUFACTURERS AFTER COVID-19 TO GAIN COMPETITIVE MARKET SHARE
6.4 IMPACT ON DEMAND
6.5 IMPACT ON SUPPLY CHAIN
6.6 IMPACT ON PRICE
6.7 CONCLUSION
7 MIDDLE EAST & AFRICA PARCEL SORTATION SYSTEMS MARKET, BY TYPE
7.1 OVERVIEW
7.2 LINEAR PARCEL SORTATION SYSTEMS
7.2.1 SHOE SORTER
7.2.2 PUSHER SORTERS
7.2.3 POP-UP/NARROW BELT SORTERS
7.2.4 ARB SORTERS
7.2.5 PADDLE SORTERS
7.2.6 LINEAR/VERTICAL BELT SORTERS
7.2.7 SMALL PARCEL SORTERS
7.3 LOOP PARCEL SORTATION SYSTEMS
7.3.1 CROSS-BELT SORTERS (HORIZONTAL)
7.3.2 TILT TRAY SORTERS
7.3.3 FLAT SORTERS/BOMB BAY SORTERS
8 MIDDLE EAST & AFRICA PARCEL SORTATION SYSTEMS MARKET, BY OFFERING
8.1 OVERVIEW
8.2 HARDWARE
8.2.1 ELECTRICAL AND MECHANICAL COMPONENTS
8.2.2 SENSOR
8.2.2.1 PROXIMITY SENSOR
8.2.2.2 OPTICAL SENSOR
8.2.2.3 DISPLACEMENT SENSOR
8.2.2.4 PRESSURE SENSOR
8.2.2.5 ANALOG FLOW SENSOR
8.2.3 DIVERTERS
8.2.4 CAMERAS
8.2.5 PROCESSORS
8.2.6 DISPLAYS
8.3 SOFTWARE
8.4 SERVICES
9 MIDDLE EAST & AFRICA PARCEL SORTATION SYSTEMS MARKET, BY TRAY SIZE
9.1 OVERVIEW
9.2 MEDIUM
9.3 SMALL
9.4 LARGE
10 MIDDLE EAST & AFRICA PARCEL SORTATION SYSTEMS MARKET, BY PARCEL HANDLING CAPACITY
10.1 OVERVIEW
10.2 LESS THAN 20000/HR
10.3 20000 TO 30000 PARCELS/HR
10.4 MORE THAN 30000 PARCEL/HR
11 MIDDLE EAST & AFRICA PARCEL SORTATION SYSTEMS MARKET, BY END USER
11.1 OVERVIEW
11.2 E COMMERCE
11.2.1 AIRPORTS
11.2.2 INTERNATIONAL AIRPORTS
11.3 LOGISTICS
11.3.1 STORAGE AND WAREHOUSING
11.3.2 COURIER
11.3.3 POSTAL SERVICES
11.3.4 FREIGHT FORWARDING
11.4 PHARMACEUTICALS AND MEDICAL SUPPLY
11.4.1 DISTRIBUTORS
11.4.2 DRUG MANUFACTURERS
11.4.3 ACTIVE PHARMACEUTICAL INGREDIENT SUPPLIERS
11.5 FOOD & BEVERAGES
11.5.1 PROCESSED FOOD
11.5.2 PROCESSED CULINARY INGREDIENTS
11.5.3 UNPROCESSED OR MINIMALLY PROCESSED FOOD
11.6 OTHERS
12 MIDDLE EAST & AFRICA PARCEL SORTATION SYSTEMS MARKET, BY REGION
12.1 MIDDLE EAST & AFRICA
12.1.1 ISRAEL
12.1.2 U.A.E
12.1.3 SAUDI ARABIA
12.1.4 EGYPT
12.1.5 SOUTH AFRICA
12.1.6 REST OF MIDDLE EAST AND AFRICA
13 MIDDLE EAST & AFRICA PARCEL SORTATION SYSTEMS MARKET: COMPANY LANDSCAPE
13.1 COMPANY SHARE ANALYSIS: MIDDLE EAST & AFRICA
14 SWOT ANALYSIS
15 COMPANY PROFILE
15.1 DAIFUKU CO., LTD.
15.1.1 COMPANY SNAPSHOT
15.1.2 REVENUE ANALYSIS
15.1.3 COMPANY SHARE ANALYSIS
15.1.4 PRODUCT PORTFOLIO
15.1.5 RECENT DEVELOPMENTS
15.2 DEMATIC
15.2.1 COMPANY SNAPSHOT
15.2.2 COMPANY SHARE ANALYSIS
15.2.3 PRODUCT PORTFOLIO
15.2.4 RECENT DEVELOPMENTS
15.3 VANDERLANDE INDUSTRIES B.V.
15.3.1 COMPANY SNAPSHOT
15.3.2 COMPANY SHARE ANALYSIS
15.3.3 PRODUCT PORTFOLIO
15.3.4 RECENT DEVELOPMENTS
15.4 PITNEY BOWES INC.
15.4.1 COMPANY SNAPSHOT
15.4.2 REVENUE ANALYSIS
15.4.3 COMPANY SHARE ANALYSIS
15.4.4 PRODUCT PORTFOLIO
15.4.5 RECENT DEVELOPMENTS
15.5 SIEMENS LOGISTICS GMBH (A SUBSIDIARY OF SIEMENS AG)
15.5.1 COMPANY SNAPSHOT
15.5.2 REVENUE ANALYSIS
15.5.3 COMPANY SHARE ANALYSIS
15.5.4 PRODUCT PORTFOLIO
15.5.5 RECENT DEVELOPMENTS
15.6 BASTIAN SOLUTIONS, LLC
15.6.1 COMPANY SNAPSHOT
15.6.2 PRODUCT PORTFOLIO
15.6.3 RECENT DEVELOPMENTS
15.7 BEUMER GROUP
15.7.1 COMPANY SNAPSHOT
15.7.2 PRODUCT PORTFOLIO
15.7.3 RECENT DEVELOPMENTS
15.8 BOWE SYSTEC GMBH
15.8.1 COMPANY SNAPSHOT
15.8.2 PRODUCT PORTFOLIO
15.8.3 RECENT DEVELOPMENTS
15.9 EQUINOX
15.9.1 COMPANY SNAPSHOT
15.9.2 PRODUCT PORTFOLIO
15.9.3 RECENT DEVELOPMENTS
15.1 FIVES
15.10.1 COMPANY SNAPSHOT
15.10.2 PRODUCT PORTFOLIO
15.10.3 RECENT DEVELOPMENTS
15.11 GBI INTRALOGISTICS, INC
15.11.1 COMPANY SNAPSHOT
15.11.2 PRODUCT PORTFOLIO
15.11.3 RECENT DEVELOPMENT
15.12 HONEYWELL INTERNATIONAL INC
15.12.1 COMPANY SNAPSHOT
15.12.2 REVENUE ANALYSIS
15.12.3 PRODUCT PORTFOLIO
15.12.4 RECENT DEVELOPMENT
15.13 INTERROLL GROUP
15.13.1 COMPANY SNAPSHOT
15.13.2 REVENUE ANALYSIS
15.13.3 PRODUCT PORTFOLIO
15.13.4 RECENT DEVELOPMENTS
15.14 INTRALOX
15.14.1 COMPANY SNAPSHOT
15.14.2 PRODUCT PORTFOLIO
15.14.3 RECENT DEVELOPMENTS
15.15 INVATA INTRALOGISTICS
15.15.1 COMPANY SNAPSHOT
15.15.2 PRODUCT PORTFOLIO
15.15.3 RECENT DEVELOPMENTS
15.16 MHS MIDDLE EAST & AFRICA
15.16.1 COMPANY SNAPSHOT
15.16.2 PRODUCT PORTFOLIO
15.16.3 RECENT DEVELOPMENTS
15.17 MURATA MACHINERY, LTD.
15.17.1 COMPANY SNAPSHOT
15.17.2 PRODUCT PORTFOLIO
15.17.3 RECENT DEVELOPMENTS
15.18 OKURA YUSOKI CO., LTD.
15.18.1 COMPANY SNAPSHOT
15.18.2 PRODUCT PORTFOLIO
15.18.3 RECENT DEVELOPMENTS
15.19 SOLYSTIC SAS
15.19.1 COMPANY SNAPSHOT
15.19.2 PRODUCT PORTFOLIO
15.19.3 RECENT DEVELOPMENTS
15.2 VIASTORE
15.20.1 COMPANY SNAPSHOT
15.20.2 PRODUCT PORTFOLIO
15.20.3 RECENT DEVELOPMENT
16 QUESTIONNAIRE
17 RELATED REPORTS
List of Table
TABLE 1 MIDDLE EAST & AFRICA PARCEL SORTATION SYSTEMS MARKET, BY TYPE, 2020-2029 (USD MILLION)
TABLE 2 MIDDLE EAST & AFRICA LINEAR PARCEL SORTATION SYSTEMS IN PARCEL SORTATION SYSTEMS MARKET, BY REGION, 2020-2029 (USD MILLION)
TABLE 3 MIDDLE EAST & AFRICA LINEAR PARCEL SORTATION SYSTEMS IN PARCEL SORTATION SYSTEMS MARKET, BY TYPE, 2020-2029 (USD MILLION)
TABLE 4 MIDDLE EAST & AFRICA LOOP PARCEL SORTATION SYSTEMS IN PARCEL SORTATION SYSTEMS MARKET, BY REGION, 2020-2029 (USD MILLION)
TABLE 5 MIDDLE EAST & AFRICA LOOP PARCEL SORTATION SYSTEMS IN PARCEL SORTATION SYSTEMS MARKET, BY TYPE, 2020-2029 (USD MILLION)
TABLE 6 MIDDLE EAST & AFRICA PARCEL SORTATION SYSTEMS MARKET, BY OFFERING, 2020-2029 (USD MILLION)
TABLE 7 MIDDLE EAST & AFRICA HARDWARE IN PARCEL SORTATION SYSTEMS MARKET, BY REGION, 2020-2029 (USD MILLION)
TABLE 8 MIDDLE EAST & AFRICA HARDWARE IN PARCEL SORTATION SYSTEMS MARKET, BY TYPE, 2020-2029 (USD MILLION)
TABLE 9 MIDDLE EAST & AFRICA SENSOR IN PARCEL SORTATION SYSTEMS MARKET, BY TYPE, 2020-2029 (USD MILLION)
TABLE 10 MIDDLE EAST & AFRICA SOFTWARE IN PARCEL SORTATION SYSTEMS MARKET, BY REGION, 2020-2029 (USD MILLION)
TABLE 11 MIDDLE EAST & AFRICA SERVICES IN PARCEL SORTATION SYSTEMS MARKET, BY REGION, 2020-2029 (USD MILLION)
TABLE 12 MIDDLE EAST & AFRICA PARCEL SORTATION SYSTEMS MARKET, BY TRAY SIZE, 2020-2029 (USD MILLION)
TABLE 13 MIDDLE EAST & AFRICA MEDIUM IN PARCEL SORTATION SYSTEMS MARKET, BY REGION, 2020-2029 (USD MILLION)
TABLE 14 MIDDLE EAST & AFRICA SMALL IN PARCEL SORTATION SYSTEMS MARKET, BY REGION, 2020-2029 (USD MILLION)
TABLE 15 MIDDLE EAST & AFRICA LARGE IN PARCEL SORTATION SYSTEMS MARKET, BY REGION, 2020-2029 (USD MILLION)
TABLE 16 MIDDLE EAST & AFRICA PARCEL SORTATION SYSTEMS MARKET, BY PARCEL HANDLING CAPACITY, 2020-2029 (USD MILLION)
TABLE 17 MIDDLE EAST & AFRICA LESS THAN 20000 PARCELS/HR IN PARCEL SORTATION SYSTEMS MARKET, BY REGION, 2020-2029 (USD MILLION)
TABLE 18 MIDDLE EAST & AFRICA 20000 TO 30000 PARCELS/HR IN PARCEL SORTATION SYSTEMS MARKET, BY REGION, 2020-2029 (USD MILLION)
TABLE 19 MIDDLE EAST & AFRICA MORE THAN 30000 PARCEL/HR IN PARCEL SORTATION SYSTEMS MARKET, BY REGION, 2020-2029 (USD MILLION)
TABLE 20 MIDDLE EAST & AFRICA PARCEL SORTATION SYSTEMS MARKET, BY END USER, 2020-2029 (USD MILLION)
TABLE 21 MIDDLE EAST & AFRICA E-COMMERCE IN PARCEL SORTATION SYSTEMS MARKET, BY REGION, 2020-2029 (USD MILLION)
TABLE 22 MIDDLE EAST & AFRICA E-COMMERCE IN PARCEL SORTATION SYSTEMS MARKET, BY TYPE, 2020-2029 (USD MILLION)
TABLE 23 MIDDLE EAST & AFRICA LOGISTICS IN PARCEL SORTATION SYSTEMS MARKET, BY REGION, 2020-2029 (USD MILLION)
TABLE 24 MIDDLE EAST & AFRICA LOGISTICS IN PARCEL SORTATION SYSTEMS MARKET, BY TYPE, 2020-2029 (USD MILLION)
TABLE 25 MIDDLE EAST & AFRICA PHARMACEUTICALS AND MEDICAL SUPPLY IN PARCEL SORTATION SYSTEMS MARKET, BY REGION, 2020-2029 (USD MILLION)
TABLE 26 MIDDLE EAST & AFRICA PHARMACEUTICALS AND MEDICAL SUPPLY IN PARCEL SORTATION SYSTEMS MARKET, BY TYPE, 2020-2029 (USD MILLION)
TABLE 27 MIDDLE EAST & AFRICA FOOD & BEVERAGES IN PARCEL SORTATION SYSTEMS MARKET, BY REGION, 2020-2029 (USD MILLION)
TABLE 28 MIDDLE EAST & AFRICA FOOD & BEVERAGES IN PARCEL SORTATION SYSTEMS MARKET, BY TYPE, 2020-2029 (USD MILLION)
TABLE 29 MIDDLE EAST & AFRICA OTHERS IN PARCEL SORTATION SYSTEMS MARKET, BY REGION, 2020-2029 (USD MILLION)
TABLE 30 MIDDLE EAST & AFRICA PARCEL SORTATION SYSTEMS MARKET, BY COUNTRY, 2020-2029 (USD MILLION)
TABLE 31 MIDDLE EAST & AFRICA PARCEL SORTATION SYSTEMS MARKET, BY TYPE, 2020-2029 (USD MILLION)
TABLE 32 MIDDLE EAST & AFRICA LINEAR PARCEL SORTATION SYSTEMS IN PARCEL SORTATION SYSTEMS MARKET, BY TYPE, 2020-2029 (USD MILLION)
TABLE 33 MIDDLE EAST & AFRICA LOOP PARCEL SORTATION SYSTEMS IN PARCEL SORTATION SYSTEMS MARKET, BY TYPE, 2020-2029 (USD MILLION)
TABLE 34 MIDDLE EAST & AFRICA PARCEL SORTATION SYSTEMS MARKET, BY OFFERING, 2020-2029 (USD MILLION)
TABLE 35 MIDDLE EAST & AFRICA HARDWARE IN PARCEL SORTATION SYSTEMS MARKET, BY TYPE, 2020-2029 (USD MILLION)
TABLE 36 MIDDLE EAST & AFRICA SENSORS IN PARCEL SORTATION SYSTEMS MARKET, BY TYPE, 2020-2029 (USD MILLION)
TABLE 37 MIDDLE EAST & AFRICA PARCEL SORTATION SYSTEMS MARKET, BY TRAY SIZE, 2020-2029 (USD MILLION)
TABLE 38 MIDDLE EAST & AFRICA PARCEL SORTATION SYSTEMS MARKET, BY PARCEL HANDLING CAPACITY, 2020-2029 (USD MILLION)
TABLE 39 MIDDLE EAST & AFRICA PARCEL SORTATION SYSTEMS MARKET, BY END USER, 2020-2029 (USD MILLION)
TABLE 40 MIDDLE EAST & AFRICA E-COMMERCE IN PARCEL SORTATION SYSTEMS MARKET, BY TYPE, 2020-2029 (USD MILLION)
TABLE 41 MIDDLE EAST & AFRICA LOGISTICS IN PARCEL SORTATION SYSTEMS MARKET, BY TYPE, 2020-2029 (USD MILLION)
TABLE 42 MIDDLE EAST & AFRICA PHARMACEUTICALS AND MEDICAL SUPPLY IN PARCEL SORTATION SYSTEMS MARKET, BY TYPE, 2020-2029 (USD MILLION)
TABLE 43 MIDDLE EAST & AFRICA FOOD & BEVERAGES IN PARCEL SORTATION SYSTEMS MARKET, BY TYPE, 2020-2029 (USD MILLION)
TABLE 44 ISRAEL PARCEL SORTATION SYSTEMS MARKET, BY TYPE, 2020-2029 (USD MILLION)
TABLE 45 ISRAEL LINEAR PARCEL SORTATION SYSTEMS IN PARCEL SORTATION SYSTEMS MARKET, BY TYPE, 2020-2029 (USD MILLION)
TABLE 46 ISRAEL LOOP PARCEL SORTATION SYSTEMS IN PARCEL SORTATION SYSTEMS MARKET, BY TYPE, 2020-2029 (USD MILLION)
TABLE 47 ISRAEL PARCEL SORTATION SYSTEMS MARKET, BY OFFERING, 2020-2029 (USD MILLION)
TABLE 48 ISRAEL HARDWARE IN PARCEL SORTATION SYSTEMS MARKET, BY TYPE, 2020-2029 (USD MILLION)
TABLE 49 ISRAEL SENSORS IN PARCEL SORTATION SYSTEMS MARKET, BY TYPE, 2020-2029 (USD MILLION)
TABLE 50 ISRAEL PARCEL SORTATION SYSTEMS MARKET, BY TRAY SIZE, 2020-2029 (USD MILLION)
TABLE 51 ISRAEL PARCEL SORTATION SYSTEMS MARKET, BY PARCEL HANDLING CAPACITY, 2020-2029 (USD MILLION)
TABLE 52 ISRAEL PARCEL SORTATION SYSTEMS MARKET, BY END USER, 2020-2029 (USD MILLION)
TABLE 53 ISRAEL E-COMMERCE IN PARCEL SORTATION SYSTEMS MARKET, BY TYPE, 2020-2029 (USD MILLION)
TABLE 54 ISRAEL LOGISTICS IN PARCEL SORTATION SYSTEMS MARKET, BY TYPE, 2020-2029 (USD MILLION)
TABLE 55 ISRAEL PHARMACEUTICALS AND MEDICAL SUPPLY IN PARCEL SORTATION SYSTEMS MARKET, BY TYPE, 2020-2029 (USD MILLION)
TABLE 56 ISRAEL FOOD & BEVERAGES IN PARCEL SORTATION SYSTEMS MARKET, BY TYPE, 2020-2029 (USD MILLION)
TABLE 57 U.A.E PARCEL SORTATION SYSTEMS MARKET, BY TYPE, 2020-2029 (USD MILLION)
TABLE 58 U.A.E LINEAR PARCEL SORTATION SYSTEMS IN PARCEL SORTATION SYSTEMS MARKET, BY TYPE, 2020-2029 (USD MILLION)
TABLE 59 U.A.E LOOP PARCEL SORTATION SYSTEMS IN PARCEL SORTATION SYSTEMS MARKET, BY TYPE, 2020-2029 (USD MILLION)
TABLE 60 U.A.E PARCEL SORTATION SYSTEMS MARKET, BY OFFERING, 2020-2029 (USD MILLION)
TABLE 61 U.A.E HARDWARE IN PARCEL SORTATION SYSTEMS MARKET, BY TYPE, 2020-2029 (USD MILLION)
TABLE 62 U.A.E SENSORS IN PARCEL SORTATION SYSTEMS MARKET, BY TYPE, 2020-2029 (USD MILLION)
TABLE 63 U.A.E PARCEL SORTATION SYSTEMS MARKET, BY TRAY SIZE, 2020-2029 (USD MILLION)
TABLE 64 U.A.E PARCEL SORTATION SYSTEMS MARKET, BY PARCEL HANDLING CAPACITY, 2020-2029 (USD MILLION)
TABLE 65 U.A.E PARCEL SORTATION SYSTEMS MARKET, BY END USER, 2020-2029 (USD MILLION)
TABLE 66 U.A.E E-COMMERCE IN PARCEL SORTATION SYSTEMS MARKET, BY TYPE, 2020-2029 (USD MILLION)
TABLE 67 U.A.E LOGISTICS IN PARCEL SORTATION SYSTEMS MARKET, BY TYPE, 2020-2029 (USD MILLION)
TABLE 68 U.A.E PHARMACEUTICALS AND MEDICAL SUPPLY IN PARCEL SORTATION SYSTEMS MARKET, BY TYPE, 2020-2029 (USD MILLION)
TABLE 69 U.A.E FOOD & BEVERAGES IN PARCEL SORTATION SYSTEMS MARKET, BY TYPE, 2020-2029 (USD MILLION)
TABLE 70 SAUDI ARABIA PARCEL SORTATION SYSTEMS MARKET, BY TYPE, 2020-2029 (USD MILLION)
TABLE 71 SAUDI ARABIA LINEAR PARCEL SORTATION SYSTEMS IN PARCEL SORTATION SYSTEMS MARKET, BY TYPE, 2020-2029 (USD MILLION)
TABLE 72 SAUDI ARABIA LOOP PARCEL SORTATION SYSTEMS IN PARCEL SORTATION SYSTEMS MARKET, BY TYPE, 2020-2029 (USD MILLION)
TABLE 73 SAUDI ARABIA PARCEL SORTATION SYSTEMS MARKET, BY OFFERING, 2020-2029 (USD MILLION)
TABLE 74 SAUDI ARABIA HARDWARE IN PARCEL SORTATION SYSTEMS MARKET, BY TYPE, 2020-2029 (USD MILLION)
TABLE 75 SAUDI ARABIA SENSORS IN PARCEL SORTATION SYSTEMS MARKET, BY TYPE, 2020-2029 (USD MILLION)
TABLE 76 SAUDI ARABIA PARCEL SORTATION SYSTEMS MARKET, BY TRAY SIZE, 2020-2029 (USD MILLION)
TABLE 77 SAUDI ARABIA PARCEL SORTATION SYSTEMS MARKET, BY PARCEL HANDLING CAPACITY, 2020-2029 (USD MILLION)
TABLE 78 SAUDI ARABIA PARCEL SORTATION SYSTEMS MARKET, BY END USER, 2020-2029 (USD MILLION)
TABLE 79 SAUDI ARABIA E-COMMERCE IN PARCEL SORTATION SYSTEMS MARKET, BY TYPE, 2020-2029 (USD MILLION)
TABLE 80 SAUDI ARABIA LOGISTICS IN PARCEL SORTATION SYSTEMS MARKET, BY TYPE, 2020-2029 (USD MILLION)
TABLE 81 SAUDI ARABIA PHARMACEUTICALS AND MEDICAL SUPPLY IN PARCEL SORTATION SYSTEMS MARKET, BY TYPE, 2020-2029 (USD MILLION)
TABLE 82 SAUDI ARABIA FOOD & BEVERAGES IN PARCEL SORTATION SYSTEMS MARKET, BY TYPE, 2020-2029 (USD MILLION)
TABLE 83 EGYPT PARCEL SORTATION SYSTEMS MARKET, BY TYPE, 2020-2029 (USD MILLION)
TABLE 84 EGYPT LINEAR PARCEL SORTATION SYSTEMS IN PARCEL SORTATION SYSTEMS MARKET, BY TYPE, 2020-2029 (USD MILLION)
TABLE 85 EGYPT LOOP PARCEL SORTATION SYSTEMS IN PARCEL SORTATION SYSTEMS MARKET, BY TYPE, 2020-2029 (USD MILLION)
TABLE 86 EGYPT PARCEL SORTATION SYSTEMS MARKET, BY OFFERING, 2020-2029 (USD MILLION)
TABLE 87 EGYPT HARDWARE IN PARCEL SORTATION SYSTEMS MARKET, BY TYPE, 2020-2029 (USD MILLION)
TABLE 88 EGYPT SENSORS IN PARCEL SORTATION SYSTEMS MARKET, BY TYPE, 2020-2029 (USD MILLION)
TABLE 89 EGYPT PARCEL SORTATION SYSTEMS MARKET, BY TRAY SIZE, 2020-2029 (USD MILLION)
TABLE 90 EGYPT PARCEL SORTATION SYSTEMS MARKET, BY PARCEL HANDLING CAPACITY, 2020-2029 (USD MILLION)
TABLE 91 EGYPT PARCEL SORTATION SYSTEMS MARKET, BY END USER, 2020-2029 (USD MILLION)
TABLE 92 EGYPT E-COMMERCE IN PARCEL SORTATION SYSTEMS MARKET, BY TYPE, 2020-2029 (USD MILLION)
TABLE 93 EGYPT LOGISTICS IN PARCEL SORTATION SYSTEMS MARKET, BY TYPE, 2020-2029 (USD MILLION)
TABLE 94 EGYPT PHARMACEUTICALS AND MEDICAL SUPPLY IN PARCEL SORTATION SYSTEMS MARKET, BY TYPE, 2020-2029 (USD MILLION)
TABLE 95 EGYPT FOOD & BEVERAGES IN PARCEL SORTATION SYSTEMS MARKET, BY TYPE, 2020-2029 (USD MILLION)
TABLE 96 SOUTH AFRICA PARCEL SORTATION SYSTEMS MARKET, BY TYPE, 2020-2029 (USD MILLION)
TABLE 97 SOUTH AFRICA LINEAR PARCEL SORTATION SYSTEMS IN PARCEL SORTATION SYSTEMS MARKET, BY TYPE, 2020-2029 (USD MILLION)
TABLE 98 SOUTH AFRICA LOOP PARCEL SORTATION SYSTEMS IN PARCEL SORTATION SYSTEMS MARKET, BY TYPE, 2020-2029 (USD MILLION)
TABLE 99 SOUTH AFRICA PARCEL SORTATION SYSTEMS MARKET, BY OFFERING, 2020-2029 (USD MILLION)
TABLE 100 SOUTH AFRICA HARDWARE IN PARCEL SORTATION SYSTEMS MARKET, BY TYPE, 2020-2029 (USD MILLION)
TABLE 101 SOUTH AFRICA SENSORS IN PARCEL SORTATION SYSTEMS MARKET, BY TYPE, 2020-2029 (USD MILLION)
TABLE 102 SOUTH AFRICA PARCEL SORTATION SYSTEMS MARKET, BY TRAY SIZE, 2020-2029 (USD MILLION)
TABLE 103 SOUTH AFRICA PARCEL SORTATION SYSTEMS MARKET, BY PARCEL HANDLING CAPACITY, 2020-2029 (USD MILLION)
TABLE 104 SOUTH AFRICA PARCEL SORTATION SYSTEMS MARKET, BY END USER, 2020-2029 (USD MILLION)
TABLE 105 SOUTH AFRICA E-COMMERCE IN PARCEL SORTATION SYSTEMS MARKET, BY TYPE, 2020-2029 (USD MILLION)
TABLE 106 SOUTH AFRICA LOGISTICS IN PARCEL SORTATION SYSTEMS MARKET, BY TYPE, 2020-2029 (USD MILLION)
TABLE 107 SOUTH AFRICA PHARMACEUTICALS AND MEDICAL SUPPLY IN PARCEL SORTATION SYSTEMS MARKET, BY TYPE, 2020-2029 (USD MILLION)
TABLE 108 SOUTH AFRICA FOOD & BEVERAGES IN PARCEL SORTATION SYSTEMS MARKET, BY TYPE, 2020-2029 (USD MILLION)
TABLE 109 REST OF MIDDLE EAST AND AFRICA PARCEL SORTATION SYSTEMS MARKET, BY TYPE, 2020-2029 (USD MILLION)
List of Figure
FIGURE 1 MIDDLE EAST & AFRICA PARCEL SORTATION SYSTEMS MARKET: SEGMENTATION
FIGURE 2 MIDDLE EAST & AFRICA PARCEL SORTATION SYSTEMS MARKET: DATA TRIANGULATION
FIGURE 3 MIDDLE EAST & AFRICA PARCEL SORTATION SYSTEMS MARKET: DROC ANALYSIS
FIGURE 4 MIDDLE EAST & AFRICA PARCEL SORTATION SYSTEMS MARKET: MIDDLE EAST & AFRICA VS REGIONAL MARKET ANALYSIS
FIGURE 5 MIDDLE EAST & AFRICA PARCEL SORTATION SYSTEMS MARKET: COMPANY RESEARCH ANALYSIS
FIGURE 6 MIDDLE EAST & AFRICA PARCEL SORTATION SYSTEMS MARKET: INTERVIEW DEMOGRAPHICS
FIGURE 7 MIDDLE EAST & AFRICA PARCEL SORTATION SYSTEMS MARKET: DBMR MARKET POSITION GRID
FIGURE 8 MIDDLE EAST & AFRICA PARCEL SORTATION SYSTEMS MARKET: VENDOR SHARE ANALYSIS
FIGURE 9 MIDDLE EAST & AFRICA PARCEL SORTATION SYSTEMS MARKET: APPLICATION COVERAGE GRID
FIGURE 10 MIDDLE EAST & AFRICA PARCEL SORTATION SYSTEMS MARKET: SEGMENTATION
FIGURE 11 CONTINUOUS DEVELOPMENT IN MIDDLE EAST & AFRICA E-COMMERCE INDUSTRY IS THE MAJOR FACTOR BOOSTING THE GROWTH OF MIDDLE EAST & AFRICA PARCEL SORTATION SYSTEMS MARKET IN THE FORECAST PERIOD OF 2022 TO 2029
FIGURE 12 LINEAR PARCEL SORTATION SYSTEMS SEGMENT IS EXPECTED TO ACCOUNT FOR THE LARGER SHARE OF THE MIDDLE EAST & AFRICA PARCEL SORTATION SYSTEMS MARKET IN 2022 & 2029
FIGURE 13 ASIA-PACIFIC IS EXPECTED TO DOMINATE AND IS THE FASTEST-GROWING REGION IN THE MIDDLE EAST & AFRICA PARCEL SORTATION SYSTEMS MARKET IN THE FORECAST PERIOD OF 2022 TO 2029
FIGURE 14 WORLDWIDE RETAIL E-COMMERCE SALES, FROM 2014 TO 2023
FIGURE 15 SHARE OF CONSUMERS CHOOSING DIFFERENT DELIVERY OPTIONS, PERCENT OF X2C VOLUME
FIGURE 16 DRIVERS, RESTRAINT, OPPORTUNITIES, AND CHALLENGE OF MIDDLE EAST & AFRICA PARCEL SORTATION SYSTEMS MARKET
FIGURE 17 MIDDLE EAST & AFRICA PARCEL SORTATION SYSTEMS MARKET, BY TYPE, 2021
FIGURE 18 MIDDLE EAST & AFRICA PARCEL SORTATION SYSTEMS MARKET, BY OFFERING, 2021
FIGURE 19 MIDDLE EAST & AFRICA PARCEL SORTATION SYSTEMS MARKET, BY TRAY SIZE, 2021
FIGURE 20 MIDDLE EAST & AFRICA PARCEL SORTATION SYSTEMS MARKET, BY PARCEL HANDLING CAPACITY, 2021
FIGURE 21 MIDDLE EAST & AFRICA PARCEL SORTATION SYSTEMS MARKET, BY END USER, 2021
FIGURE 22 MIDDLE EAST & AFRICA PARCEL SORTATION SYSTEMS MARKET: SNAPSHOT (2021)
FIGURE 23 MIDDLE EAST & AFRICA PARCEL SORTATION SYSTEMS MARKET: BY COUNTRY (2021)
FIGURE 24 MIDDLE EAST & AFRICA PARCEL SORTATION SYSTEMS MARKET: BY COUNTRY (2022 & 2029)
FIGURE 25 MIDDLE EAST & AFRICA PARCEL SORTATION SYSTEMS MARKET: BY COUNTRY (2021 & 2029)
FIGURE 26 MIDDLE EAST & AFRICA PARCEL SORTATION SYSTEMS MARKET: BY TYPE (2022-2029)
FIGURE 27 MIDDLE EAST & AFRICA PARCEL SORTATION SYSTEMS MARKET: COMPANY SHARE 2021 (%)
Middle East And Africa Parcel Sortation Systems Market, Supply Chain Analysis and Ecosystem Framework
To support market growth and help clients navigate the impact of geopolitical shifts, DBMR has integrated in-depth supply chain analysis into its Middle East And Africa Parcel Sortation Systems Market research reports. This addition empowers clients to respond effectively to global changes affecting their industries. The supply chain analysis section includes detailed insights such as Middle East And Africa Parcel Sortation Systems Market consumption and production by country, price trend analysis, the impact of tariffs and geopolitical developments, and import and export trends by country and HSN code. It also highlights major suppliers with data on production capacity and company profiles, as well as key importers and exporters. In addition to research, DBMR offers specialized supply chain consulting services backed by over a decade of experience, providing solutions like supplier discovery, supplier risk assessment, price trend analysis, impact evaluation of inflation and trade route changes, and comprehensive market trend analysis.
Data collection and base year analysis are done using data collection modules with large sample sizes. The stage includes obtaining market information or related data through various sources and strategies. It includes examining and planning all the data acquired from the past in advance. It likewise envelops the examination of information inconsistencies seen across different information sources. The market data is analysed and estimated using market statistical and coherent models. Also, market share analysis and key trend analysis are the major success factors in the market report. To know more, please request an analyst call or drop down your inquiry.
The key research methodology used by DBMR research team is data triangulation which involves data mining, analysis of the impact of data variables on the market and primary (industry expert) validation. Data models include Vendor Positioning Grid, Market Time Line Analysis, Market Overview and Guide, Company Positioning Grid, Patent Analysis, Pricing Analysis, Company Market Share Analysis, Standards of Measurement, Global versus Regional and Vendor Share Analysis. To know more about the research methodology, drop in an inquiry to speak to our industry experts.
Data Bridge Market Research is a leader in advanced formative research. We take pride in servicing our existing and new customers with data and analysis that match and suits their goal. The report can be customized to include price trend analysis of target brands understanding the market for additional countries (ask for the list of countries), clinical trial results data, literature review, refurbished market and product base analysis. Market analysis of target competitors can be analyzed from technology-based analysis to market portfolio strategies. We can add as many competitors that you require data about in the format and data style you are looking for. Our team of analysts can also provide you data in crude raw excel files pivot tables (Fact book) or can assist you in creating presentations from the data sets available in the report.


