
Middle East and Africa Phosphorus and Derivatives Market Analysis and Insights
Phosphorous and phosphoric acid refers to crystalline acid that is generally weak, colorless, and odorless. These inorganic materials are corrosive to the ferrous metal & alloys and possess good solubility in water. These tend to get decompose in high temperatures. These may form toxic fumes when combined with alcohol. It gives soft drinks a tangy flavor and prevents the growth of mold and bacteria, which can multiply easily in a sugary solution. Most of the soda's acidity also comes from phosphoric acid.
The driving factors that may be responsible for the growth of the North America phosphorus and derivatives market are the rapid growth in the agriculture and food and food and beverages sectors. However, the factors expected to restrain the market are the stringent government regulations on phosphorus and derivatives usage.
On the other hand, strategic initiatives by market players and the rise in the agriculture field and the food and beverages industries may act as an opportunity for the growth of the North America phosphorus and derivatives market. The risks associated with overusing phosphate-based products may create challenges for the North America phosphorus and derivatives market. There are some recent developments related to the North America phosphorus and derivatives market.
However, the harmful effects of phosphorus and derivatives on the environment are expected to hamper the growth of the North America phosphorus and derivatives market in the forecast period.
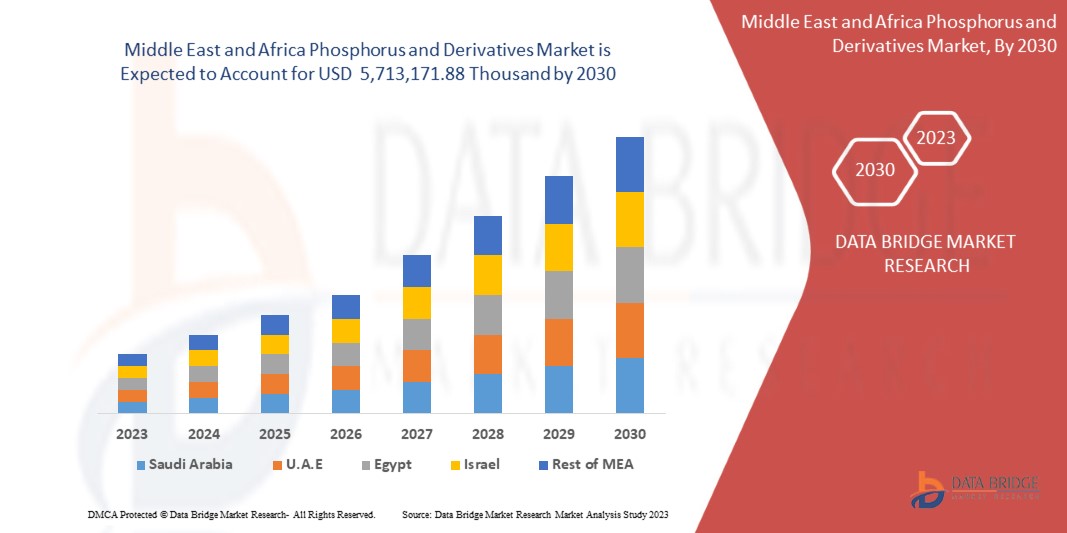
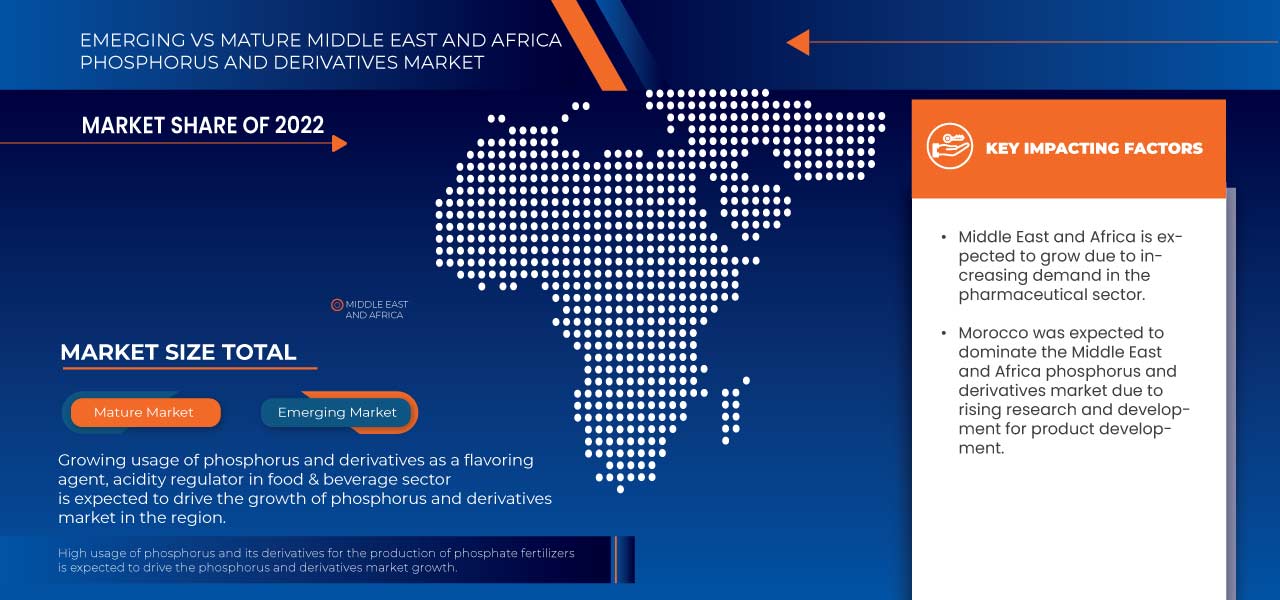
Data Bridge Market Research analyzes that the Middle East and Africa phosphorus and derivatives market is expected to reach the value of USD 5,713,171.88 thousand by 2030, at a CAGR of 3.41% during the forecast period. Phosphoric acid is the largest product segment in the market due to the growing use of phosphorus in Middle East and Africa phosphorus and derivatives market.
|
Report Metric |
Details |
|
Forecast Period |
2023 to 2030 |
|
Base Year |
2022 |
|
Historic Years |
2021 (2016 -2021) |
|
Quantitative Units |
Revenue in USD thosuands |
|
Segments Covered |
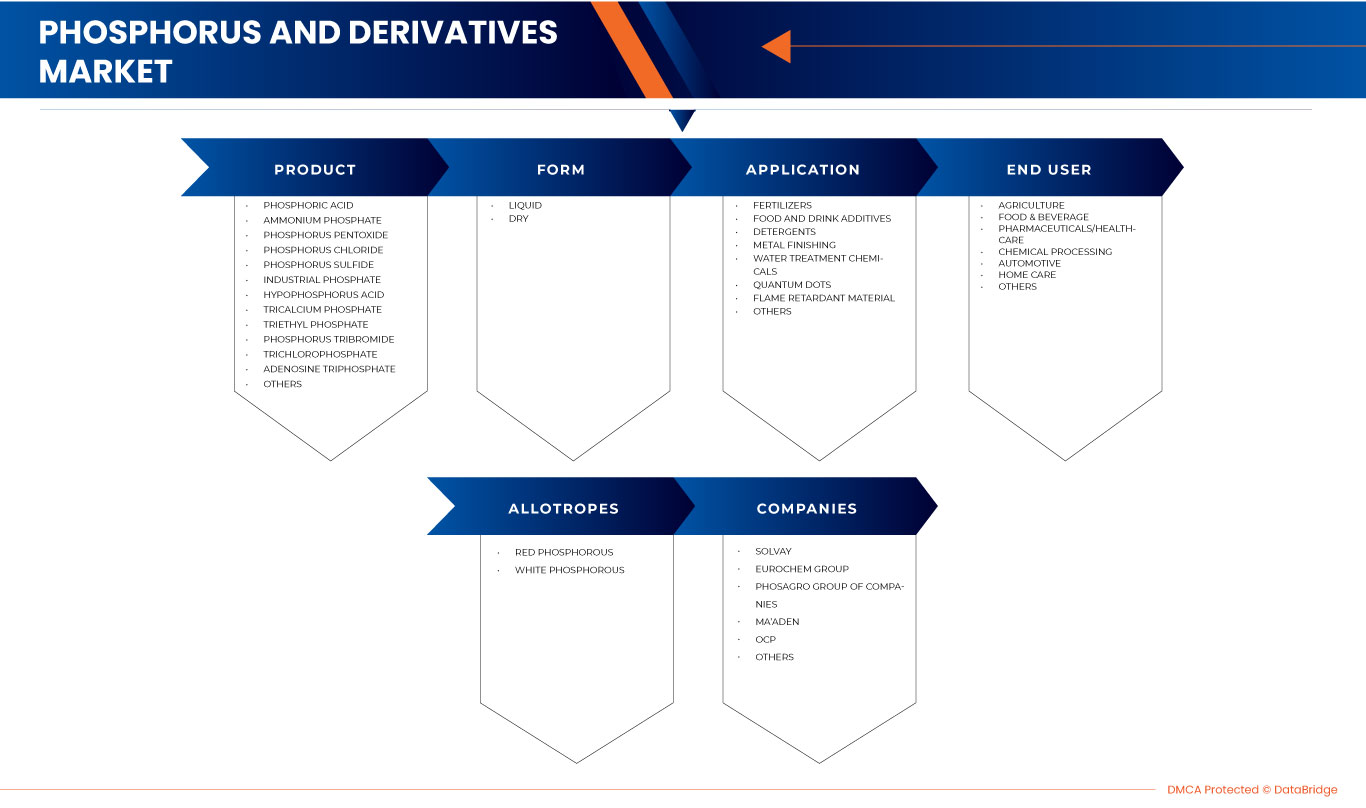
Product (Phosphoric Acid, Ammonium Phosphate, Phosphorus Pentoxide, Phosphorus Chloride, Phosphorus Sulfide, Industrial Phosphate, Hypophosphorus Acid, Tricalcium Phosphate, Triethyl Phosphate, Phosphorus Tribromide, Trichlorophosphate, Adenosine Triphosphate, and Others), Form (Dry and Liquid), Application (Fertilizers, Food and Drink Additives, Detergents, Metal Finishing, Water Treatment Chemicals, Quantum Dots, Flame Retardant Material, and Others), End User (Agriculture, Food & Beverage, Pharmaceuticals/Healthcare, Chemical Processing, Automotive, Home Care, and Others), Allotropes (Red Phosphorous and White Phosphorous) |
|
Countries Covered |
Morocco South Africa, Saudi Arabia, United Arab Emirates, Qatar, Egypt, Israel, and Rest of Middle East and Africa |
|
Market Players Covered |
ANEXIB Chemicals, Nippon Chemical Industrial CO., LTD., Mosaic Company, LANXESS , Solvay, Ma'aden, ICL, Xuzhou JianPing Chemical Co., Ltd., and Sekisui Diagnostics among others |
Middle East and Africa Phosphorus and Derivatives Market Definition
Phosphorous is a combustible nonmetallic element generally found in two allotropic forms: white phosphorous and red phosphorous. Phosphoric acid, phosphorous acid, phosphorus oxychloride, phosphorus pentachloride, phosphorus tribromide, sodium hypophosphite, tributyl phosphate, and triethyl phosphate are such derivatives of phosphorous. Phosphorus derivative phosphoric acid is a crystalline acid generally weak, colorless, and odorless. These inorganic materials are corrosive to the ferrous metal & alloys and possess good solubility in water. These tend to decompose in high temperatures. These may form toxic fumes when combined with alcohol. It gives soft drinks a tangy flavor and prevents the growth of mold and bacteria, which can multiply easily in a sugary solution. Most of the soda's acidity also comes from phosphoric acid.
Phosphorus is first turned into phosphorus pentoxide through a chemical manufacturing process. It's then treated again to become phosphoric acid.
Middle East and Africa Phosphorus and Derivatives Market Dynamics
This section deals with understanding the market drivers, opportunities, restraints, and challenges. All of this is discussed in detail below:
Drivers
- Increasing demand for fertilizers in agriculture industry
Phosphoric acid produces several fertilizers, including DAP, MAP, NPKs, and SSP.
Diammonium phosphate (DAP) is the most popular phosphatic fertilizer because of its physical properties. The composition of DAP is N-18% and P2O5 -46%. DAP fertilizers are perfect for any agriculture crop to provide full phosphorus nutrition throughout crop growth and development and a starter dose of nitrogen and low Sulphur. It can be applied in autumn for tilling and spring during sowing and pre-sowing cultivation. Dissolving in soil provides temporary alkalization of the pH of the soil solution around the fertilizer granule, thus stimulating better phosphorus uptake from the fertilizers on acid soils. Fertilizer sulfur also contributes to plants' better intake of nitrogen and phosphorus.
Thus, multiple uses of phosphoric acid to produce phosphate fertilizers are expected to drive the growth of the Middle East and Africa phosphoric acid market.
- Increasing demand in the pharmaceutical sector
Phosphoric acid is mainly used in many medical applications, such as dental cement, for preparing albumin derivatives, acidifying the urine, removing necrotic (dead cells or tissue) debris, anti-nausea medicines, teeth whiteners, and mouth washing liquid.
Phosphoric acid used in teeth whitening phosphoric acid can alter the tooth surface. Using 37% phosphoric acid following bleaching can significantly increase the decalcifying effect of the acid on the enamel surface, creating an uneven etched surface. Moreover, it can create sensitivity in the teeth.
Thus, the growing usage of phosphoric acid in medical applications is expected to drive the growth of the Middle East and Africa phosphoric acid market.
Restraint
- Stringent government regulations on phosphorus and derivatives usage
There are many regulations by different government regulatory bodies for the use and production of phosphoric acid.
The FDA protects the public health by ensuring the safety, efficacy, and security of human and veterinary drugs, biological products, chemicals, and others. USFDA has given some regulations for using phosphoric acid in food and regulations for handling phosphoric acid. Below are some of the parameters by FDA for protection purposes
Thus, due to the stringent government regulations on phosphoric acid, there are limitations on the use of phosphoric acid, which may impede the market growth in the forecast period.
Opportunity
Increasing innovation and new product launches
Leading market players have launched new products that exhibit improved capabilities. Manufacturers have taken the necessary steps to improve the accuracy of new products and overall functionality.
Market players are further focusing on producing phosphoric acid domestically and operating by exporting to other regions to expand their business.
Thus, growing innovations and new product launches are expected to offer an opportunity for the Middle East and Africa phosphoric acid market.
Challenge
Risks associated with over usage of phosphate based products
At state, provisional, and national levels, the phosphoric acid supply is regulated by various government rules as several risks could impact the usage of fertilizers, and there are several environmental impacts during the production of phosphoric acid.
The production of phosphate fertilizers usually uses as raw material sedimentary phosphate rock, which contains enhanced concentrations from U‐series radionuclides about 10–100 times higher than unperturbed soils.
Thus, due to the harmful impacts of phosphoric acid on air, water, soil, and human health, many government bodies have led the implementation of several regulations, high-standard certification schemes, and company registrations for the use of phosphoric acid, which may pose a challenge to the Middle East and Africa phosphoric acid market.
Recent Developments
- In March 2023, Solvay announced that it had been recognized as one of the 60 top suppliers for 2022 in Northrop Grumman Corporation's Middle East and Africa network of more than 10,000 suppliers. This will increase the company's brand image, among others.
- In March 2023, Airedale group announced that the company would continue growing by acquiring McCann chemicals. This will help in increasing the growth and diversification of the company's product portfolio.
Middle East and Africa Phosphorus and Derivatives Market Scope
Middle East and Africa phosphorus and derivatives market is segmented into five notable segments such as, product, form, application, end user, and allotropes. The growth among segments helps you analyze niche pockets of growth and strategies to approach the market and determine your core application areas and the difference in your target markets.
Product
- Phosphoric Acid
- Ammonium Phosphate
- Phosphorus Pentoxide
- Phosphorus Chloride
- Phosphorus Sulfide
- Industrial Phosphate
- Hypophosphorus Acid
- Tricalcium Phosphate
- Triethyl Phosphate
- Phosphorus Tribromide
- Trichlorophosphate
- Adenosine Triphosphate
- Others
On the basis of product, Middle East and Africa phosphorus and derivatives market is segmented into phosphoric acid, ammonium phosphate, phosphorus pentoxide, phosphorus chloride, phosphorus sulfide, industrial phosphate, hypophosphorus acid, tricalcium phosphate, triethyl phosphate, phosphorus tribromide, trichlorophosphate, adenosine triphosphate, and others.
Form
- Dry
- Liquid
On the basis of form, the Middle East and Africa phosphorus and derivatives market is segmented into dry and liquid.
Application
- Fertilizers
- Food and Drink Additives
- Detergents
- Metal Finishing
- Water Treatment Chemicals
- Quantum Dots
- Flame Retardant Material
- Others
On the basis of application, the Middle East and Africa phosphorus and derivatives market is segmented into fertilizers, food and drink additives, detergents, metal finishing, water treatment chemicals, quantum dots, flame retardant material, and others.
End User
- Agriculture
- Food & Beverage
- Pharmaceuticals/HealthCare
- Chemical Processing
- Automotive
- Home Care
- Others
On the basis of end user, the Middle East and Africa phosphorus and derivatives market is segmented into agriculture, food & beverage, pharmaceuticals/healthcare, chemical processing, automotive, home care, and others.
Allotropes
- Red Phosphorous
- White Phosphorous
On the basis of allotropes, the Middle East and Africa phosphorus and derivatives market is segmented into red phosphorous and white phosphorous.
Middle East and Africa Phosphorus and Derivatives Market Regional Analysis/Insights
The Middle East and Africa phosphorus and derivatives market is segmented into five notable segments such as product, form, application, end user, and allotropes.
The countries covered in this market report Middle East and Africa phosphorus and derivatives market are Morocco South Africa, Saudi Arabia, United Arab Emirates, Qatar, Egypt, Israel, and Rest of Middle East and Africa.
The country section of the report also provides individual market-impacting factors and domestic regulation changes that impact the current and future trends of the market. Data points such as new sales, replacement sales, country demographics, regulatory acts, and import-export tariffs are some of the major pointers used to forecast the market scenario for individual countries. Also, the presence and availability of phosphorus and its derivatives and the challenges faced due to stringent regulations are considered while providing forecast analysis of the country data.
Competitive Landscape and Middle East and Africa Phosphorus and Derivatives Market Share Analysis
Middle East and Africa phosphorus and derivatives market competitive landscape provide details by a competitor. Details include company overview, financials, revenue generated, market potential, business expansion, service facilities, partnership, strategic development, application dominance, and technology lifeline curve. The above data points only relate to the company's focus on the Middle East and Africa phosphorus and derivatives market.
Some of the major players operating in the Middle East and Africa phosphorus and derivatives market are ANEXIB Chemicals, Nippon Chemical Industrial CO., LTD., Mosaic Company, LANXESS, Solvay, Ma'aden, ICL, Xuzhou JianPing Chemical Co., Ltd., and Sekisui Diagnostics among others.
SKU-

- Interactive Data Analysis Dashboard
- Company Analysis Dashboard for high growth potential opportunities
- Research Analyst Access for customization & queries
- Competitor Analysis with Interactive dashboard
- Latest News, Updates & Trend analysis
- Harness the Power of Benchmark Analysis for Comprehensive Competitor Tracking
Table of Content
1 INTRODUCTION
1.1 OBJECTIVES OF THE STUDY
1.2 MARKET DEFINITION
1.3 OVERVIEW OF THE MIDDLE EAST & AFRICA PHOSPHORUS AND DERIVATIVES MARKET
1.4 LIMITATIONS
1.5 MARKETS COVERED
2 MARKET SEGMENTATION
2.1 MARKETS COVERED
2.2 GEOGRAPHICAL SCOPE
2.3 YEARS CONSIDERED FOR THE STUDY
2.4 CURRENCY AND PRICING
2.5 DBMR TRIPOD DATA VALIDATION MODEL
2.6 PRODUCT LIFELINE CURVE
2.7 MULTIVARIATE MODELLING
2.8 PRIMARY INTERVIEWS WITH KEY OPINION LEADERS
2.9 DBMR MARKET POSITION GRID
2.1 VENDOR SHARE ANALYSIS
2.11 MARKET APPLICATION COVERAGE GRID
2.12 DBMR MARKET CHALLENGE MATRIX
2.13 SECONDARY SOURCES
2.14 ASSUMPTIONS
3 EXECUTIVE SUMMARY
4 PREMIUM INSIGHTS
4.1 PESTEL ANALYSIS
4.1.1 POLITICAL FACTORS
4.1.2 ENVIRONMENTAL FACTORS
4.1.3 SOCIAL FACTORS
4.1.4 TECHNOLOGICAL FACTORS
4.1.5 ECONOMICAL FACTORS
4.1.6 LEGAL FACTORS
4.2 PORTER'S FIVE FORCES
4.3 RAW MATERIAL COVERAGE
4.4 PRODUCTION CONSUMPTION ANALYSIS
4.5 IMPORT-EXPORT SCENARIO
4.6 TECHNOLOGICAL ADVANCEMENTS BY MANUFACTURES
4.7 VENDOR SELECTION CRITERIA
4.8 PRODUCTION CAPACITY OUTLOOK
5 REGULATION COVERAGE
6 CLIMATE CHANGE SCENARIO
6.1 ENVIRONMENTAL CONCERNS
6.2 INDUSTRY RESPONSE
6.3 GOVERNMENT'S ROLE
6.4 ANALYST RECOMMENDATION
7 PRICING ANALYSIS OF PHOSPHORUS
8 SUPPLY CHAIN ANALYSIS
9 REGIONAL SUMMARIES
10 MARKET OVERVIEW
10.1 DRIVERS
10.1.1 INCREASING DEMAND FOR FERTILIZERS IN THE AGRICULTURE INDUSTRY
10.1.2 GROWING AWARENESS ABOUT THE BENEFITS OF PHOSPHORUS AND DERIVATIVES AMONG CONSUMERS
10.1.3 INCREASING DEMAND IN THE PHARMACEUTICAL SECTOR
10.1.4 RISING APPLICATIONS OF PHOSPHORUS AND DERIVATIVES IN SEVERAL INDUSTRIES
10.2 RESTRAINTS
10.2.1 STRINGENT GOVERNMENT REGULATIONS ON PHOSPHORUS AND DERIVATIVES USAGE
10.2.2 HARMFUL EFFECTS OF PHOSPHORUS AND DERIVATIVES ON THE ENVIRONMENT
10.3 OPPORTUNITIES
10.3.1 INCREASING USE OF PHOSPHORUS AND DERIVATIVES IN THE FOOD & BEVERAGE INDUSTRY
10.3.2 INCREASING INNOVATION AND NEW PRODUCT LAUNCHES
10.3.3 GROWING USE OF PHOSPHORUS AND DERIVATIVES IN FUEL CELLS
10.4 CHALLENGES
10.4.1 RISKS ASSOCIATED WITH OVER USAGE OF PHOSPHATE-BASED PRODUCTS
10.4.2 INCREASING ADOPTION OF GENETICALLY MODIFIED SEEDS
11 MIDDLE EAST & AFRICA PHOSPHORUS AND DERIVATIVES MARKET, BY PRODUCT
11.1 OVERVIEW:
11.2 PHOSPHORIC ACID
11.3 AMMONIUM PHOSPHATE
11.4 PHOSPHORUS PENTOXIDE
11.5 PHOSPHORUS CHLORIDE
11.6 PHOSPHORUS SULPHIDE
11.7 INDUSTRIAL PHOSPHATE
11.8 HYPHOSPHORUS ACID
11.9 TRICALCIUM PHOSPHATE
11.1 TRIETHYL PHOSPHATE
11.11 PHOSPHORUS TRIBROMIDE
11.12 TRICHLOROPHOSPHATE
11.13 ADENOSINE TRIPHOSPHATE
11.14 OTHERS
12 MIDDLE EAST & AFRICA PHOSPHORUS AND DERIVATIVES MARKET, BY FORM
12.1 OVERVIEW
12.2 DRY
12.3 LIQUID
13 MIDDLE EAST & AFRICA PHOSPHORUS AND DERIVATIVES MARKET, BY APPLICATION
13.1 OVERVIEW:
13.2 FERTILIZERS
13.3 FOOD AND DRINK ADDITIVES
13.4 DETERGENTS
13.5 METAL FINISHING
13.6 WATER TREATMENT CHEMICALS
13.7 QUANTUM DOTS
13.8 FLAME RETARDANT MATERIAL
13.9 OTHERS
14 MIDDLE EAST & AFRICA PHOSPHORUS AND DERIVATIVES MARKET, BY END USER
14.1 OVERVIEW:
14.2 AGRICULTURE
14.3 FOOD AND BEVERAGES
14.4 PHARMACEUTICALS/HEALTHCARE
14.5 CHEMICAL PROCESSING
14.6 AUTOMOTIVE
14.7 HOMECARE
14.8 OTHERS
15 MIDDLE EAST & AFRICA PHOSPHOROUS AND DERIVATIVES MARKET, BY ALLOTROPES
15.1 OVERVIEW
15.2 RED PHOSPHOROUS
15.3 WHITE PHOSPHOROUS
16 MIDDLE EAST & AFRICA PHOSPHORUS AND DERIVATIVES MARKET, BY REGION
16.1 MIDDLE EAST AND AFRICA
16.1.1 MOROCCO
16.1.2 EGYPT
16.1.3 ISRAEL
16.1.4 SAUDI ARABIA
16.1.5 SOUTH AFRICA
16.1.6 UNITED ARAB EMIRATES
16.1.7 QATAR
16.1.8 REST OF MIDDLE EAST AND AFRICA
17 MIDDLE EAST & AFRICA PHOSPHORUS AND DERIVATIVES MARKET: COMPANY LANDSCAPE
17.1 COMPANY SHARE ANALYSIS: MIDDLE EAST & AFRICA
17.2 EXPANSIONS
17.3 AGREEMENTS
17.4 RECOGNITIONS
17.5 COLLABORATION
17.6 NEW LAUNCHES/PRODUCTS
17.7 ACQUISITIONS
17.8 PRESENTATION
17.9 NEW PRODUCTION BUILDING
17.1 INVESTMENT
18 COMPANY PROFILE
18.1 SOLVAY
18.1.1 COMPANY SNAPSHOT
18.1.2 PRODUCTION CAPACITY
18.1.3 SWOT
18.1.4 REVENUE ANALYSIS
18.1.5 COMPANY SHARE ANALYSIS
18.1.6 PRODUCT PORTFOLIO
18.1.7 RECENT DEVELOPMENT
18.2 EUROCHEM GROUP
18.2.1 COMPANY SNAPSHOT
18.2.2 PRODUCTION CAPACITY
18.2.3 SWOT
18.2.4 COMPANY SHARE ANALYSIS
18.2.5 PRODUCT PORTFOLIO
18.2.6 RECENT DEVELOPMENT
18.3 PHOSAGRO GROUP OF COMPANIES
18.3.1 COMPANY SNAPSHOT
18.3.2 PRODUCTION CAPACITY
18.3.3 SWOT
18.3.4 REVENUE ANALYSIS
18.3.5 COMPANY SHARE ANALYSIS
18.3.6 PRODUCT PORTFOLIO
18.3.7 RECENT DEVELOPMENT
18.4 MA'ADEN
18.4.1 COMPANY SNAPSHOT
18.4.2 PRODUCTION CAPACITY
18.4.3 SWOT
18.4.4 REVENUE ANALYSIS
18.4.5 COMPANY SHARE ANALYSIS
18.4.6 PRODUCT PORTFOLIO
18.4.7 RECENT DEVELOPMENTS
18.5 OCP
18.5.1 COMPANY SNAPSHOT
18.5.2 PRODUCTION CAPACITY
18.5.3 SWOT
18.5.4 COMPANY SHARE ANALYSIS
18.5.5 PRODUCT PORTFOLIO
18.5.6 RECENT DEVELOPMENT
18.6 ADITYA BIRLA MANAGEMENT CORPORATION PVT. LTD.
18.6.1 COMPANY SNAPSHOT
18.6.2 SWOT
18.6.3 REVENUE ANALYSIS
18.6.4 PRODUCT PORTFOLIO
18.6.5 RECENT DEVELOPMENT
18.7 AIREDALE CHEMICAL COMPANY LIMITED
18.7.1 COMPANY SNAPSHOT
18.7.2 SWOT
18.7.3 PRODUCT PORTFOLIO
18.7.4 RECENT DEVELOPMENT
18.8 ANEXIB CHEMICALS
18.8.1 COMPANY SNAPSHOT
18.8.2 SWOT
18.8.3 PRODUCT PORTFOLIO
18.8.4 RECENT DEVELOPMENT
18.9 ANHUI GUANGXIN AGROCHEMICAL CO., LTD.
18.9.1 COMPANY SNAPSHOT
18.9.2 SWOT
18.9.3 PRODUCT PORTFOLIO
18.9.4 RECENT DEVELOPMENTS
18.1 EXCEL INDUSTRIES LTD. (2022)
18.10.1 COMPANY SNAPSHOT
18.10.2 SWOT
18.10.3 REVENUE ANALYSIS
18.10.4 PRODUCT PORTFOLIO
18.10.5 RECENT DEVELOPMENT
18.11 FUTONG CHEMICAL CO., LTD
18.11.1 COMPANY SNAPSHOT
18.11.2 SWOT
18.11.3 PRODUCT PORTFOLIO
18.11.4 RECENT DEVELOPMENT
18.12 ICL
18.12.1 COMPANY SNAPSHOT
18.12.2 SWOT
18.12.3 REVENUE ANALYSIS
18.12.4 PRODUCT PORTFOLIO
18.12.5 RECENT DEVELOPMENTS
18.13 INNOPHOS
18.13.1 COMPANY SNAPSHOT
18.13.2 SWOT
18.13.3 PRODUCT PORTFOLIO
18.13.4 RECENT DEVELOPMENT
18.14 JORDAN PHOSPHATE MINES COMPANY (PLC)
18.14.1 COMPANY SNAPSHOT
18.14.2 SWOT
18.14.3 REVENUE ANALYSIS
18.14.4 PRODUCT PORTFOLIO
18.14.5 RECENT DEVELOPMENT
18.15 KAZPHOSPHATE LLC
18.15.1 COMPANY SNAPSHOT
18.15.2 SWOT
18.15.3 PRODUCT PORTFOLIO
18.15.4 RECENT DEVELOPMENT
18.16 LANXESS
18.16.1 COMPANY SNAPSHOT
18.16.2 SWOT
18.16.3 REVENUE ANALYSIS
18.16.4 PRODUCT PORTFOLIO
18.16.5 RECENT DEVELOPMENTS
18.17 MOSAIC
18.17.1 COMPANY SNAPSHOT
18.17.2 SWOT
18.17.3 REVENUE ANALYSIS
18.17.4 PRODUCT PORTFOLIO
18.17.5 RECENT DEVELOPMENT
18.18 NIPPON CHEMICAL INDUSTRIAL CO., LTD.
18.18.1 COMPANY SNAPSHOT
18.18.2 SWOT
18.18.3 REVENUE ANALYSIS
18.18.4 PRODUCT PORTFOLIO
18.18.5 RECENT DEVELOPMENTS
18.19 NUTRIEN LTD. (2022)
18.19.1 COMPANY SNAPSHOT
18.19.2 SWOT
18.19.3 REVENUE ANALYSIS
18.19.4 PRODUCT PORTFOLIO
18.19.5 RECENT DEVELOPMENT
18.2 PCC ROKITA SPÓŁKA AKCYJNA. (A SUBSIDIARY OF PCC GROUP)
18.20.1 COMPANY SNAPSHOT
18.20.2 SWOT
18.20.3 REVENUE ANALYSIS
18.20.4 PRODUCT PORTFOLIO
18.20.5 RECENT DEVELOPMENT
18.21 SANDHYA GROUP
18.21.1 COMPANY SNAPSHOT
18.21.2 SWOT
18.21.3 PRODUCT PORTFOLIO
18.21.4 RECENT DEVELOPMENT
18.22 SEKISUI DIAGNOSTICS
18.22.1 COMPANY SNAPSHOT
18.22.2 SWOT
18.22.3 PRODUCT PORTFOLIO
18.22.4 RECENT DEVELOPMENT
18.23 SMC MIDDLE EAST & AFRICA
18.23.1 COMPANY SNAPSHOT
18.23.2 SWOT
18.23.3 PRODUCT PORTFOLIO
18.23.4 RECENT DEVELOPMENT
18.24 STREM (A SUBSIDIARY OF ASCENSUS)
18.24.1 COMPANY SNAPSHOT
18.24.2 SWOT
18.24.3 PRODUCT PORTFOLIO
18.24.4 RECENT DEVELOPMENTS
18.25 XUZHOU JIANPING CHEMICAL CO., LTD.
18.25.1 COMPANY SNAPSHOT
18.25.2 SWOT
18.25.3 PRODUCT PORTFOLIO
18.25.4 RECENT DEVELOPMENTS
19 QUESTIONNAIRE
20 RELATED REPORTS
List of Table
TABLE 1 MIDDLE EAST & AFRICA PHOSPHORUS AND DERIVATIVES MARKET, BY REGION, 2019-2022 (AVERAGE SELLING PRICE (USD) PER KG)
TABLE 2 THE RECOMMENDED DIETARY ALLOWANCE (RDA) FOR PHOSPHORUS IS THE FOLLOWING:
TABLE 3 MIDDLE EAST AND AFRICA PHOSPHORUS AND DERIVATIVES MARKET, BY COUNTRY, 2016-2030 (USD THOUSAND)
TABLE 4 MIDDLE EAST AND AFRICA PHOSPHORUS AND DERIVATIVES MARKET, BY COUNTRY, 2016-2030 (TONS)
TABLE 5 MIDDLE EAST AND AFRICA PHOSPHORUS AND DERIVATIVES MARKET, BY PRODUCT, 2016-2030 (USD THOUSAND)
TABLE 6 MIDDLE EAST AND AFRICA PHOSPHORUS AND DERIVATIVES MARKET, BY PRODUCT, 2016-2030 (TONS)
TABLE 7 MIDDLE EAST AND AFRICA PHOSPHORIC ACID IN PHOSPHORUS AND DERIVATIVES MARKET, BY TYPE, 2016-2030 (USD THOUSAND)
TABLE 8 MIDDLE EAST AND AFRICA PHOSPHORIC ACID IN PHOSPHORUS AND DERIVATIVES MARKET, BY TYPE, 2016-2030 (TONS)
TABLE 9 MIDDLE EAST AND AFRICA AMMONIUM PHOSPHATE IN PHOSPHORUS AND DERIVATIVES MARKET, BY TYPE, 2016-2030 (USD THOUSAND)
TABLE 10 MIDDLE EAST AND AFRICA AMMONIUM PHOSPHATE IN PHOSPHORUS AND DERIVATIVES MARKET, BY TYPE, 2016-2030 (TONS)
TABLE 11 MIDDLE EAST AND AFRICA PHOSPHORUS CHLORIDE IN PHOSPHORUS AND DERIVATIVES MARKET, BY TYPE, 2016-2030 (USD THOUSAND)
TABLE 12 MIDDLE EAST AND AFRICA PHOSPHORUS CHLORIDE IN PHOSPHORUS AND DERIVATIVES MARKET, BY TYPE, 2016-2030 (TONS)
TABLE 13 MIDDLE EAST AND AFRICA PHOSPHORUS SULFIDE IN PHOSPHORUS AND DERIVATIVES MARKET, BY TYPE, 2016-2030 (USD THOUSAND)
TABLE 14 MIDDLE EAST AND AFRICA PHOSPHORUS SULFIDE IN PHOSPHORUS AND DERIVATIVES MARKET, BY TYPE, 2016-2030 (TONS)
TABLE 15 MIDDLE EAST AND AFRICA PHOSPHORUS AND DERIVATIVES MARKET, BY FORM, 2016-2030 (USD THOUSAND)
TABLE 16 MIDDLE EAST AND AFRICA PHOSPHORUS AND DERIVATIVES MARKET, BY FORM, 2016-2030 (TONS)
TABLE 17 MIDDLE EAST AND AFRICA PHOSPHORUS AND DERIVATIVES MARKET, BY APPLICATION, 2016-2030 (USD THOUSAND)
TABLE 18 MIDDLE EAST AND AFRICA PHOSPHORUS AND DERIVATIVES MARKET, BY APPLICATION, 2016-2030 (TONS)
TABLE 19 MIDDLE EAST AND AFRICA PHOSPHORUS AND DERIVATIVES MARKET, BY END USER, 2016-2030 (USD THOUSAND)
TABLE 20 MIDDLE EAST AND AFRICA PHOSPHORUS AND DERIVATIVES MARKET, BY END USER, 2016-2030 (TONS)
TABLE 21 MIDDLE EAST AND AFRICA PHOSPHORUS AND DERIVATIVES MARKET, BY ALLOTROPES, 2016-2030 (USD THOUSAND)
TABLE 22 MIDDLE EAST AND AFRICA PHOSPHORUS AND DERIVATIVES MARKET, BY ALLOTROPES, 2016-2030 (TONS)
TABLE 23 MOROCCO PHOSPHORUS AND DERIVATIVES MARKET, BY PRODUCT, 2016-2030 (USD THOUSAND)
TABLE 24 MOROCCO PHOSPHORUS AND DERIVATIVES MARKET, BY PRODUCT, 2016-2030 (TONS)
TABLE 25 MOROCCO PHOSPHORIC ACID IN PHOSPHORUS AND DERIVATIVES MARKET, BY TYPE, 2016-2030 (USD THOUSAND)
TABLE 26 MOROCCO PHOSPHORIC ACID IN PHOSPHORUS AND DERIVATIVES MARKET, BY TYPE, 2016-2030 (TONS)
TABLE 27 MOROCCO AMMONIUM PHOSPHATE IN PHOSPHORUS AND DERIVATIVES MARKET, BY TYPE, 2016-2030 (USD THOUSAND)
TABLE 28 MOROCCO AMMONIUM PHOSPHATE IN PHOSPHORUS AND DERIVATIVES MARKET, BY TYPE, 2016-2030 (TONS)
TABLE 29 MOROCCO PHOSPHORUS CHLORIDE IN PHOSPHORUS AND DERIVATIVES MARKET, BY TYPE, 2016-2030 (USD THOUSAND)
TABLE 30 MOROCCO PHOSPHORUS CHLORIDE IN PHOSPHORUS AND DERIVATIVES MARKET, BY TYPE, 2016-2030 (TONS)
TABLE 31 MOROCCO PHOSPHORUS SULFIDE IN PHOSPHORUS AND DERIVATIVES MARKET, BY TYPE, 2016-2030 (USD THOUSAND)
TABLE 32 MOROCCO PHOSPHORUS SULFIDE IN PHOSPHORUS AND DERIVATIVES MARKET, BY TYPE, 2016-2030 (TONS)
TABLE 33 MOROCCO PHOSPHORUS AND DERIVATIVES MARKET, BY FORM, 2016-2030 (USD THOUSAND)
TABLE 34 MOROCCO PHOSPHORUS AND DERIVATIVES MARKET, BY FORM, 2016-2030 (TONS)
TABLE 35 MOROCCO PHOSPHORUS AND DERIVATIVES MARKET, BY APPLICATION, 2016-2030 (USD THOUSAND)
TABLE 36 MOROCCO PHOSPHORUS AND DERIVATIVES MARKET, BY APPLICATION, 2016-2030 (TONS)
TABLE 37 MOROCCO PHOSPHORUS AND DERIVATIVES MARKET, BY END USER, 2016-2030 (USD THOUSAND)
TABLE 38 MOROCCO PHOSPHORUS AND DERIVATIVES MARKET, BY END USER, 2016-2030 (TONS)
TABLE 39 MOROCCO PHOSPHORUS AND DERIVATIVES MARKET, BY ALLOTROPES, 2016-2030 (USD THOUSAND)
TABLE 40 MOROCCO PHOSPHORUS AND DERIVATIVES MARKET, BY ALLOTROPES, 2016-2030 (TONS)
TABLE 41 EGYPT PHOSPHORUS AND DERIVATIVES MARKET, BY PRODUCT, 2016-2030 (USD THOUSAND)
TABLE 42 EGYPT PHOSPHORUS AND DERIVATIVES MARKET, BY PRODUCT, 2016-2030 (TONS)
TABLE 43 EGYPT PHOSPHORIC ACID IN PHOSPHORUS AND DERIVATIVES MARKET, BY TYPE, 2016-2030 (USD THOUSAND)
TABLE 44 EGYPT PHOSPHORIC ACID IN PHOSPHORUS AND DERIVATIVES MARKET, BY TYPE, 2016-2030 (TONS)
TABLE 45 EGYPT AMMONIUM PHOSPHATE IN PHOSPHORUS AND DERIVATIVES MARKET, BY TYPE, 2016-2030 (USD THOUSAND)
TABLE 46 EGYPT AMMONIUM PHOSPHATE IN PHOSPHORUS AND DERIVATIVES MARKET, BY TYPE, 2016-2030 (TONS)
TABLE 47 EGYPT PHOSPHORUS CHLORIDE IN PHOSPHORUS AND DERIVATIVES MARKET, BY TYPE, 2016-2030 (USD THOUSAND)
TABLE 48 EGYPT PHOSPHORUS CHLORIDE IN PHOSPHORUS AND DERIVATIVES MARKET, BY TYPE, 2016-2030 (TONS)
TABLE 49 EGYPT PHOSPHORUS SULFIDE IN PHOSPHORUS AND DERIVATIVES MARKET, BY TYPE, 2016-2030 (USD THOUSAND)
TABLE 50 EGYPT PHOSPHORUS SULFIDE IN PHOSPHORUS AND DERIVATIVES MARKET, BY TYPE, 2016-2030 (TONS)
TABLE 51 EGYPT PHOSPHORUS AND DERIVATIVES MARKET, BY FORM, 2016-2030 (USD THOUSAND)
TABLE 52 EGYPT PHOSPHORUS AND DERIVATIVES MARKET, BY FORM, 2016-2030 (TONS)
TABLE 53 EGYPT PHOSPHORUS AND DERIVATIVES MARKET, BY APPLICATION, 2016-2030 (USD THOUSAND)
TABLE 54 EGYPT PHOSPHORUS AND DERIVATIVES MARKET, BY APPLICATION, 2016-2030 (TONS)
TABLE 55 EGYPT PHOSPHORUS AND DERIVATIVES MARKET, BY END USER, 2016-2030 (USD THOUSAND)
TABLE 56 EGYPT PHOSPHORUS AND DERIVATIVES MARKET, BY END USER, 2016-2030 (TONS)
TABLE 57 EGYPT PHOSPHORUS AND DERIVATIVES MARKET, BY ALLOTROPES, 2016-2030 (USD THOUSAND)
TABLE 58 EGYPT PHOSPHORUS AND DERIVATIVES MARKET, BY ALLOTROPES, 2016-2030 (TONS)
TABLE 59 ISRAEL PHOSPHORUS AND DERIVATIVES MARKET, BY PRODUCT, 2016-2030 (USD THOUSAND)
TABLE 60 ISRAEL PHOSPHORUS AND DERIVATIVES MARKET, BY PRODUCT, 2016-2030 (TONS)
TABLE 61 ISRAEL PHOSPHORIC ACID IN PHOSPHORUS AND DERIVATIVES MARKET, BY TYPE, 2016-2030 (USD THOUSAND)
TABLE 62 ISRAEL PHOSPHORIC ACID IN PHOSPHORUS AND DERIVATIVES MARKET, BY TYPE, 2016-2030 (TONS)
TABLE 63 ISRAEL AMMONIUM PHOSPHATE IN PHOSPHORUS AND DERIVATIVES MARKET, BY TYPE, 2016-2030 (USD THOUSAND)
TABLE 64 ISRAEL AMMONIUM PHOSPHATE IN PHOSPHORUS AND DERIVATIVES MARKET, BY TYPE, 2016-2030 (TONS)
TABLE 65 ISRAEL PHOSPHORUS CHLORIDE IN PHOSPHORUS AND DERIVATIVES MARKET, BY TYPE, 2016-2030 (USD THOUSAND)
TABLE 66 ISRAEL PHOSPHORUS CHLORIDE IN PHOSPHORUS AND DERIVATIVES MARKET, BY TYPE, 2016-2030 (TONS)
TABLE 67 ISRAEL PHOSPHORUS SULFIDE IN PHOSPHORUS AND DERIVATIVES MARKET, BY TYPE, 2016-2030 (USD THOUSAND)
TABLE 68 ISRAEL PHOSPHORUS SULFIDE IN PHOSPHORUS AND DERIVATIVES MARKET, BY TYPE, 2016-2030 (TONS)
TABLE 69 ISRAEL PHOSPHORUS AND DERIVATIVES MARKET, BY FORM, 2016-2030 (USD THOUSAND)
TABLE 70 ISRAEL PHOSPHORUS AND DERIVATIVES MARKET, BY FORM, 2016-2030 (TONS)
TABLE 71 ISRAEL PHOSPHORUS AND DERIVATIVES MARKET, BY APPLICATION, 2016-2030 (USD THOUSAND)
TABLE 72 ISRAEL PHOSPHORUS AND DERIVATIVES MARKET, BY APPLICATION, 2016-2030 (TONS)
TABLE 73 ISRAEL PHOSPHORUS AND DERIVATIVES MARKET, BY END USER, 2016-2030 (USD THOUSAND)
TABLE 74 ISRAEL PHOSPHORUS AND DERIVATIVES MARKET, BY END USER, 2016-2030 (TONS)
TABLE 75 ISRAEL PHOSPHORUS AND DERIVATIVES MARKET, BY ALLOTROPES, 2016-2030 (USD THOUSAND)
TABLE 76 ISRAEL PHOSPHORUS AND DERIVATIVES MARKET, BY ALLOTROPES, 2016-2030 (TONS)
TABLE 77 SAUDI ARABIA PHOSPHORUS AND DERIVATIVES MARKET, BY PRODUCT, 2016-2030 (USD THOUSAND)
TABLE 78 SAUDI ARABIA PHOSPHORUS AND DERIVATIVES MARKET, BY PRODUCT, 2016-2030 (TONS)
TABLE 79 SAUDI ARABIA PHOSPHORIC ACID IN PHOSPHORUS AND DERIVATIVES MARKET, BY TYPE, 2016-2030 (USD THOUSAND)
TABLE 80 SAUDI ARABIA PHOSPHORIC ACID IN PHOSPHORUS AND DERIVATIVES MARKET, BY TYPE, 2016-2030 (TONS)
TABLE 81 SAUDI ARABIA AMMONIUM PHOSPHATE IN PHOSPHORUS AND DERIVATIVES MARKET, BY TYPE, 2016-2030 (USD THOUSAND)
TABLE 82 SAUDI ARABIA AMMONIUM PHOSPHATE IN PHOSPHORUS AND DERIVATIVES MARKET, BY TYPE, 2016-2030 (TONS)
TABLE 83 SAUDI ARABIA PHOSPHORUS CHLORIDE IN PHOSPHORUS AND DERIVATIVES MARKET, BY TYPE, 2016-2030 (USD THOUSAND)
TABLE 84 SAUDI ARABIA PHOSPHORUS CHLORIDE IN PHOSPHORUS AND DERIVATIVES MARKET, BY TYPE, 2016-2030 (TONS)
TABLE 85 SAUDI ARABIA PHOSPHORUS SULFIDE IN PHOSPHORUS AND DERIVATIVES MARKET, BY TYPE, 2016-2030 (USD THOUSAND)
TABLE 86 SAUDI ARABIA PHOSPHORUS SULFIDE IN PHOSPHORUS AND DERIVATIVES MARKET, BY TYPE, 2016-2030 (TONS)
TABLE 87 SAUDI ARABIA PHOSPHORUS AND DERIVATIVES MARKET, BY FORM, 2016-2030 (USD THOUSAND)
TABLE 88 SAUDI ARABIA PHOSPHORUS AND DERIVATIVES MARKET, BY FORM, 2016-2030 (TONS)
TABLE 89 SAUDI ARABIA PHOSPHORUS AND DERIVATIVES MARKET, BY APPLICATION, 2016-2030 (USD THOUSAND)
TABLE 90 SAUDI ARABIA PHOSPHORUS AND DERIVATIVES MARKET, BY APPLICATION, 2016-2030 (TONS)
TABLE 91 SAUDI ARABIA PHOSPHORUS AND DERIVATIVES MARKET, BY END USER, 2016-2030 (USD THOUSAND)
TABLE 92 SAUDI ARABIA PHOSPHORUS AND DERIVATIVES MARKET, BY END USER, 2016-2030 (TONS)
TABLE 93 SAUDI ARABIA PHOSPHORUS AND DERIVATIVES MARKET, BY ALLOTROPES, 2016-2030 (USD THOUSAND)
TABLE 94 SAUDI ARABIA PHOSPHORUS AND DERIVATIVES MARKET, BY ALLOTROPES, 2016-2030 (TONS)
TABLE 95 SOUTH AFRICA PHOSPHORUS AND DERIVATIVES MARKET, BY PRODUCT, 2016-2030 (USD THOUSAND)
TABLE 96 SOUTH AFRICA PHOSPHORUS AND DERIVATIVES MARKET, BY PRODUCT, 2016-2030 (TONS)
TABLE 97 SOUTH AFRICA PHOSPHORIC ACID IN PHOSPHORUS AND DERIVATIVES MARKET, BY TYPE, 2016-2030 (USD THOUSAND)
TABLE 98 SOUTH AFRICA PHOSPHORIC ACID IN PHOSPHORUS AND DERIVATIVES MARKET, BY TYPE, 2016-2030 (TONS)
TABLE 99 SOUTH AFRICA AMMONIUM PHOSPHATE IN PHOSPHORUS AND DERIVATIVES MARKET, BY TYPE, 2016-2030 (USD THOUSAND)
TABLE 100 SOUTH AFRICA AMMONIUM PHOSPHATE IN PHOSPHORUS AND DERIVATIVES MARKET, BY TYPE, 2016-2030 (TONS)
TABLE 101 SOUTH AFRICA PHOSPHORUS CHLORIDE IN PHOSPHORUS AND DERIVATIVES MARKET, BY TYPE, 2016-2030 (USD THOUSAND)
TABLE 102 SOUTH AFRICA PHOSPHORUS CHLORIDE IN PHOSPHORUS AND DERIVATIVES MARKET, BY TYPE, 2016-2030 (TONS)
TABLE 103 SOUTH AFRICA PHOSPHORUS SULFIDE IN PHOSPHORUS AND DERIVATIVES MARKET, BY TYPE, 2016-2030 (USD THOUSAND)
TABLE 104 SOUTH AFRICA PHOSPHORUS SULFIDE IN PHOSPHORUS AND DERIVATIVES MARKET, BY TYPE, 2016-2030 (TONS)
TABLE 105 SOUTH AFRICA PHOSPHORUS AND DERIVATIVES MARKET, BY FORM, 2016-2030 (USD THOUSAND)
TABLE 106 SOUTH AFRICA PHOSPHORUS AND DERIVATIVES MARKET, BY FORM, 2016-2030 (TONS)
TABLE 107 SOUTH AFRICA PHOSPHORUS AND DERIVATIVES MARKET, BY APPLICATION, 2016-2030 (USD THOUSAND)
TABLE 108 SOUTH AFRICA PHOSPHORUS AND DERIVATIVES MARKET, BY APPLICATION, 2016-2030 (TONS)
TABLE 109 SOUTH AFRICA PHOSPHORUS AND DERIVATIVES MARKET, BY END USER, 2016-2030 (USD THOUSAND)
TABLE 110 SOUTH AFRICA PHOSPHORUS AND DERIVATIVES MARKET, BY END USER, 2016-2030 (TONS)
TABLE 111 SOUTH AFRICA PHOSPHORUS AND DERIVATIVES MARKET, BY ALLOTROPES, 2016-2030 (USD THOUSAND)
TABLE 112 SOUTH AFRICA PHOSPHORUS AND DERIVATIVES MARKET, BY ALLOTROPES, 2016-2030 (TONS)
TABLE 113 UNITED ARAB EMIRATES PHOSPHORUS AND DERIVATIVES MARKET, BY PRODUCT, 2016-2030 (USD THOUSAND)
TABLE 114 UNITED ARAB EMIRATES PHOSPHORUS AND DERIVATIVES MARKET, BY PRODUCT, 2016-2030 (TONS)
TABLE 115 UNITED ARAB EMIRATES PHOSPHORIC ACID IN PHOSPHORUS AND DERIVATIVES MARKET, BY TYPE, 2016-2030 (USD THOUSAND)
TABLE 116 UNITED ARAB EMIRATES PHOSPHORIC ACID IN PHOSPHORUS AND DERIVATIVES MARKET, BY TYPE, 2016-2030 (TONS)
TABLE 117 UNITED ARAB EMIRATES AMMONIUM PHOSPHATE IN PHOSPHORUS AND DERIVATIVES MARKET, BY TYPE, 2016-2030 (USD THOUSAND)
TABLE 118 UNITED ARAB EMIRATES AMMONIUM PHOSPHATE IN PHOSPHORUS AND DERIVATIVES MARKET, BY TYPE, 2016-2030 (TONS)
TABLE 119 UNITED ARAB EMIRATES PHOSPHORUS CHLORIDE IN PHOSPHORUS AND DERIVATIVES MARKET, BY TYPE, 2016-2030 (USD THOUSAND)
TABLE 120 UNITED ARAB EMIRATES PHOSPHORUS CHLORIDE IN PHOSPHORUS AND DERIVATIVES MARKET, BY TYPE, 2016-2030 (TONS)
TABLE 121 UNITED ARAB EMIRATES PHOSPHORUS SULFIDE IN PHOSPHORUS AND DERIVATIVES MARKET, BY TYPE, 2016-2030 (USD THOUSAND)
TABLE 122 UNITED ARAB EMIRATES PHOSPHORUS SULFIDE IN PHOSPHORUS AND DERIVATIVES MARKET, BY TYPE, 2016-2030 (TONS)
TABLE 123 UNITED ARAB EMIRATES PHOSPHORUS AND DERIVATIVES MARKET, BY FORM, 2016-2030 (USD THOUSAND)
TABLE 124 UNITED ARAB EMIRATES PHOSPHORUS AND DERIVATIVES MARKET, BY FORM, 2016-2030 (TONS)
TABLE 125 UNITED ARAB EMIRATES PHOSPHORUS AND DERIVATIVES MARKET, BY APPLICATION, 2016-2030 (USD THOUSAND)
TABLE 126 UNITED ARAB EMIRATES PHOSPHORUS AND DERIVATIVES MARKET, BY APPLICATION, 2016-2030 (TONS)
TABLE 127 UNITED ARAB EMIRATES PHOSPHORUS AND DERIVATIVES MARKET, BY END USER, 2016-2030 (USD THOUSAND)
TABLE 128 UNITED ARAB EMIRATES PHOSPHORUS AND DERIVATIVES MARKET, BY END USER, 2016-2030 (TONS)
TABLE 129 UNITED ARAB EMIRATES PHOSPHORUS AND DERIVATIVES MARKET, BY ALLOTROPES, 2016-2030 (USD THOUSAND)
TABLE 130 UNITED ARAB EMIRATES PHOSPHORUS AND DERIVATIVES MARKET, BY ALLOTROPES, 2016-2030 (TONS)
TABLE 131 QATAR PHOSPHORUS AND DERIVATIVES MARKET, BY PRODUCT, 2016-2030 (USD THOUSAND)
TABLE 132 QATAR PHOSPHORUS AND DERIVATIVES MARKET, BY PRODUCT, 2016-2030 (TONS)
TABLE 133 QATAR PHOSPHORIC ACID IN PHOSPHORUS AND DERIVATIVES MARKET, BY TYPE, 2016-2030 (USD THOUSAND)
TABLE 134 QATAR PHOSPHORIC ACID IN PHOSPHORUS AND DERIVATIVES MARKET, BY TYPE, 2016-2030 (TONS)
TABLE 135 QATAR AMMONIUM PHOSPHATE IN PHOSPHORUS AND DERIVATIVES MARKET, BY TYPE, 2016-2030 (USD THOUSAND)
TABLE 136 QATAR AMMONIUM PHOSPHATE IN PHOSPHORUS AND DERIVATIVES MARKET, BY TYPE, 2016-2030 (TONS)
TABLE 137 QATAR PHOSPHORUS CHLORIDE IN PHOSPHORUS AND DERIVATIVES MARKET, BY TYPE, 2016-2030 (USD THOUSAND)
TABLE 138 QATAR PHOSPHORUS CHLORIDE IN PHOSPHORUS AND DERIVATIVES MARKET, BY TYPE, 2016-2030 (TONS)
TABLE 139 QATAR PHOSPHORUS SULFIDE IN PHOSPHORUS AND DERIVATIVES MARKET, BY TYPE, 2016-2030 (USD THOUSAND)
TABLE 140 QATAR PHOSPHORUS SULFIDE IN PHOSPHORUS AND DERIVATIVES MARKET, BY TYPE, 2016-2030 (TONS)
TABLE 141 QATAR PHOSPHORUS AND DERIVATIVES MARKET, BY FORM, 2016-2030 (USD THOUSAND)
TABLE 142 QATAR PHOSPHORUS AND DERIVATIVES MARKET, BY FORM, 2016-2030 (TONS)
TABLE 143 QATAR PHOSPHORUS AND DERIVATIVES MARKET, BY APPLICATION, 2016-2030 (USD THOUSAND)
TABLE 144 QATAR PHOSPHORUS AND DERIVATIVES MARKET, BY APPLICATION, 2016-2030 (TONS)
TABLE 145 QATAR PHOSPHORUS AND DERIVATIVES MARKET, BY END USER, 2016-2030 (USD THOUSAND)
TABLE 146 QATAR PHOSPHORUS AND DERIVATIVES MARKET, BY END USER, 2016-2030 (TONS)
TABLE 147 QATAR PHOSPHORUS AND DERIVATIVES MARKET, BY ALLOTROPES, 2016-2030 (USD THOUSAND)
TABLE 148 QATAR PHOSPHORUS AND DERIVATIVES MARKET, BY ALLOTROPES, 2016-2030 (TONS)
TABLE 149 REST OF MIDDLE EAST AND AFRICA PHOSPHORUS AND DERIVATIVES MARKET, BY PRODUCT, 2016-2030 (USD THOUSAND)
TABLE 150 REST OF MIDDLE EAST AND AFRICA PHOSPHORUS AND DERIVATIVES MARKET, BY PRODUCT, 2016-2030 (TONS)
List of Figure
FIGURE 1 MIDDLE EAST & AFRICA PHOSPHORUS AND DERIVATIVES MARKET: SEGMENTATION
FIGURE 2 MIDDLE EAST & AFRICA PHOSPHORUS AND DERIVATIVES MARKET: DATA TRIANGULATION
FIGURE 3 MIDDLE EAST & AFRICA PHOSPHORUS AND DERIVATIVES MARKET: DROC ANALYSIS
FIGURE 4 MIDDLE EAST & AFRICA PHOSPHORUS AND DERIVATIVES MARKET: MIDDLE EAST & AFRICA VS REGIONAL MARKET ANALYSIS
FIGURE 5 MIDDLE EAST & AFRICA PHOSPHORUS AND DERIVATIVES MARKET: COMPANY RESEARCH ANALYSIS
FIGURE 6 MIDDLE EAST & AFRICA PHOSPHORUS AND DERIVATIVES MARKET: PRODUCT LIFELINE CURVE
FIGURE 7 MIDDLE EAST & AFRICA PHOSPHORUS AND DERIVATIVES MARKET: MULTIVARIATE MODELLING
FIGURE 8 MIDDLE EAST & AFRICA PHOSPHORUS AND DERIVATIVES MARKET: INTERVIEW DEMOGRAPHICS
FIGURE 9 MIDDLE EAST & AFRICA PHOSPHORUS AND DERIVATIVES MARKET: DBMR MARKET POSITION GRID
FIGURE 10 MIDDLE EAST & AFRICA PHOSPHORUS AND DERIVATIVES MARKET: VENDOR SHARE ANALYSIS
FIGURE 11 MIDDLE EAST & AFRICA PHOSPHORUS AND DERIVATIVES MARKET: MARKET APPLICATION COVERAGE GRID
FIGURE 12 MIDDLE EAST & AFRICA PHOSPHORUS AND DERIVATIVES: THE MARKET CHALLENGE MATRIX
FIGURE 13 MIDDLE EAST & AFRICA PHOSPHORUS AND DERIVATIVES MARKET: SEGMENTATION
FIGURE 14 RISING APPLICATIONS OF PHOSPHORUS AND DERIVATIVES IN SEVERAL INDUSTRIES ARE DRIVING THE GROWTH OF THE MIDDLE EAST & AFRICA PHOSPHORUS AND DERIVATIVES MARKET IN THE FORECAST PERIOD OF 2023 TO 2030
FIGURE 15 THE PHOSPHORIC ACID SEGMENT IN THE PRODUCT SEGMENT IS EXPECTED TO ACCOUNT FOR THE LARGEST SHARE OF THE MIDDLE EAST & AFRICA PHOSPHORUS AND DERIVATIVES MARKET IN 2023 & 2030
FIGURE 16 PRODUCTION PROCESS OF PHOSPHORUS AND ITS DERIVATIVES
FIGURE 17 UNITED STATES CONSUMPTION OF PHOSPHATE ROCK (2019 – 2022)
FIGURE 18 IMPORT EXPORT SCENARIO OF PHOSPHORUS
FIGURE 19 DRIVERS, RESTRAINTS, OPPORTUNITIES, AND CHALLENGES OF THE MIDDLE EAST & AFRICA PHOSPHORUS AND DERIVATIVES MARKET
FIGURE 20 FERTILIZER CONSUMPTION IN EUROPEAN COUNTRIES (2019) (KILOGRAMS PER HECTARE OF LAND)
FIGURE 21 MIDDLE EAST & AFRICA PHOSPHORUS AND DERIVATIVES MARKET, BY PRODUCT, 2022
FIGURE 22 MIDDLE EAST & AFRICA PHOSPHORUS AND DERIVATIVES MARKET, BY FORM, 2022
FIGURE 23 MIDDLE EAST & AFRICA PHOSPHORUS AND DERIVATIVES MARKET, BY APPLICATION, 2022
FIGURE 24 MIDDLE EAST & AFRICA PHOSPHORUS AND DERIVATIVES MARKET, BY END USER, 2022
FIGURE 25 MIDDLE EAST & AFRICA PHOSPHORUS AND DERIVATIVES MARKET, BY ALLOTROPES, 2022
FIGURE 26 MIDDLE EAST AND AFRICA PHOSPHORUS AND DERIVATIVES MARKET: SNAPSHOT (2022)
FIGURE 27 MIDDLE EAST AND AFRICA PHOSPHORUS AND DERIVATIVES MARKET: BY COUNTRY (2022)
FIGURE 28 MIDDLE EAST AND AFRICA PHOSPHORUS AND DERIVATIVES MARKET: BY COUNTRY (2023 & 2030)
FIGURE 29 MIDDLE EAST AND AFRICA PHOSPHORUS AND DERIVATIVES MARKET: BY COUNTRY (2022 & 2030)
FIGURE 30 MIDDLE EAST AND AFRICA PHOSPHORUS AND DERIVATIVES MARKET: BY PRODUCT (2023 - 2030)
FIGURE 31 MIDDLE EAST & AFRICA PHOSPHORUS AND DERIVATIVES MARKET: COMPANY SHARE 2022 (%)
Middle East And Africa Phosphorus And Derivatives Market, Supply Chain Analysis and Ecosystem Framework
To support market growth and help clients navigate the impact of geopolitical shifts, DBMR has integrated in-depth supply chain analysis into its Middle East And Africa Phosphorus And Derivatives Market research reports. This addition empowers clients to respond effectively to global changes affecting their industries. The supply chain analysis section includes detailed insights such as Middle East And Africa Phosphorus And Derivatives Market consumption and production by country, price trend analysis, the impact of tariffs and geopolitical developments, and import and export trends by country and HSN code. It also highlights major suppliers with data on production capacity and company profiles, as well as key importers and exporters. In addition to research, DBMR offers specialized supply chain consulting services backed by over a decade of experience, providing solutions like supplier discovery, supplier risk assessment, price trend analysis, impact evaluation of inflation and trade route changes, and comprehensive market trend analysis.
Data collection and base year analysis are done using data collection modules with large sample sizes. The stage includes obtaining market information or related data through various sources and strategies. It includes examining and planning all the data acquired from the past in advance. It likewise envelops the examination of information inconsistencies seen across different information sources. The market data is analysed and estimated using market statistical and coherent models. Also, market share analysis and key trend analysis are the major success factors in the market report. To know more, please request an analyst call or drop down your inquiry.
The key research methodology used by DBMR research team is data triangulation which involves data mining, analysis of the impact of data variables on the market and primary (industry expert) validation. Data models include Vendor Positioning Grid, Market Time Line Analysis, Market Overview and Guide, Company Positioning Grid, Patent Analysis, Pricing Analysis, Company Market Share Analysis, Standards of Measurement, Global versus Regional and Vendor Share Analysis. To know more about the research methodology, drop in an inquiry to speak to our industry experts.
Data Bridge Market Research is a leader in advanced formative research. We take pride in servicing our existing and new customers with data and analysis that match and suits their goal. The report can be customized to include price trend analysis of target brands understanding the market for additional countries (ask for the list of countries), clinical trial results data, literature review, refurbished market and product base analysis. Market analysis of target competitors can be analyzed from technology-based analysis to market portfolio strategies. We can add as many competitors that you require data about in the format and data style you are looking for. Our team of analysts can also provide you data in crude raw excel files pivot tables (Fact book) or can assist you in creating presentations from the data sets available in the report.


