
Middle East And Africa Thermocouple Temperature Sensors Market
Market Size in USD Million
 USD
830.30 Million
USD
1,130.21 Million
2025
2033
USD
830.30 Million
USD
1,130.21 Million
2025
2033
| 2026 - 2033 | |
| USD 830.30 Million | |
| USD 1,130.21 Million | |
| % | |
|
What is the Middle East and Africa Thermocouple Temperature Sensors Market Size and Overview?
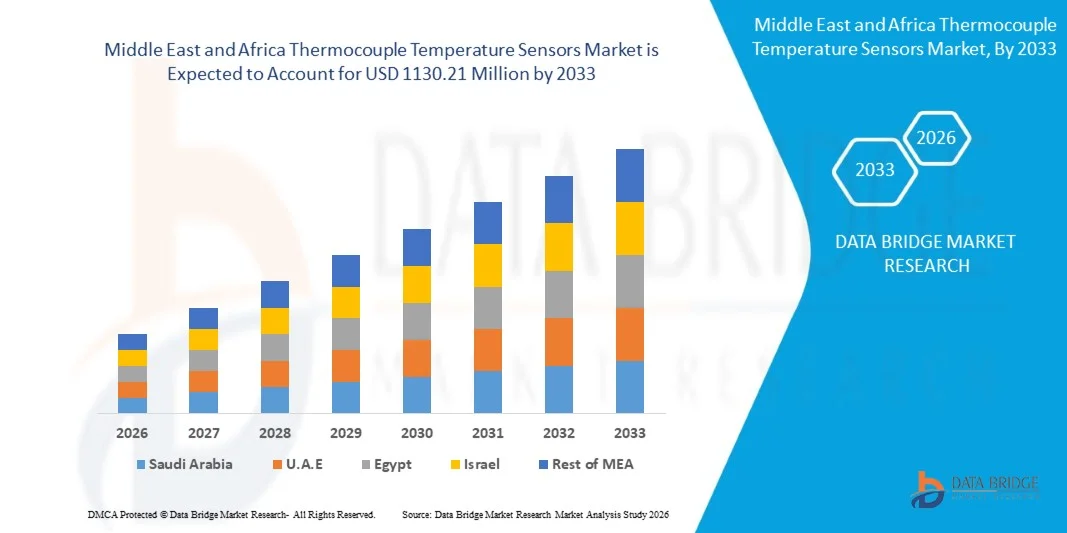
The Middle East and Africa thermocouple temperature sensors market was valued at USD 830.30 Million in 2025 and is projected to reach USD 1130.21 Million by 2033, growing at a CAGR of 3.93% from 2026 to 2033. The Thermocouple Temperature Sensors Market is experiencing consistent growth driven by rising demand for accurate temperature measurement, increasing industrial automation, and expanding applications across energy, automotive, aerospace, and manufacturing sectors.
The growing need for reliable monitoring in high-temperature and harsh industrial environments, combined with stricter safety, quality, and emission regulations, is compelling industries such as oil & gas, power generation, chemicals, and metal processing to adopt advanced thermocouple-based sensing solutions. Thermocouple sensors are increasingly replacing conventional temperature monitoring methods in many applications, offering wide temperature range capability, fast response time, durability, and cost-effectiveness for continuous industrial process control and safety monitoring.
Key Market Trends & Insights
- Saudi Arabia dominated the Middle East and Africa thermocouple temperature sensors market with the largest revenue share of 34.12% in 2025, driven by strong demand from oil & gas, petrochemical, and power generation industries. The country’s large-scale industrial expansion under Vision 2030, combined with increasing investments in refinery modernization and industrial automation, is significantly boosting adoption of high-accuracy temperature sensing solutions. In addition, rapid deployment of smart manufacturing systems and predictive maintenance technologies across energy-intensive sectors is strengthening demand for thermocouple-based monitoring. Strong presence of global oil majors and industrial EPC contractors further supports market leadership. Continuous expansion of downstream refining capacity and industrial safety regulations is accelerating installation of advanced temperature sensing systems. Growing integration of automation in harsh operating environments is further reinforcing Saudi Arabia’s dominance in the regional market.
- The base metal thermocouple segment dominated the market with a share of 78.6% in 2025, owing to its cost-effectiveness, durability, wide operating temperature range, and extensive adoption across industrial applications.
- A.E. is expected to be the fastest-growing market with a CAGR of 7.4% from 2026 to 2033, supported by rapid industrial diversification, expansion of petrochemical clusters, and increasing adoption of smart manufacturing technologies. The country is investing heavily in advanced industrial infrastructure, particularly in oil & gas processing, renewable energy projects, and chemical manufacturing facilities. Rising implementation of Industry 4.0 technologies, including IoT-enabled sensors and real-time monitoring systems, is driving strong demand for thermocouple temperature sensors. Growth of aerospace, metals, and food processing industries is further expanding application scope. Government initiatives to enhance energy efficiency and operational safety are encouraging adoption of high-performance temperature measurement solutions. In addition, increasing foreign direct investment (FDI) in industrial zones such as JAFZA and Khalifa Industrial Zone is accelerating technology adoption. The U.A.E.’s focus on becoming a regional industrial innovation hub is further boosting market expansion.
- The (-200°C to 1250°C) temperature range segment dominated the market with a 38.62% share in 2025, driven by its versatility across key industries such as oil & gas, power generation, and metals & mining. This range is widely preferred for industrial processes requiring medium-to-high temperature monitoring with high accuracy. Strong adoption in refinery operations, furnace control systems, and chemical processing units is supporting market dominance. Increasing automation in industrial plants is further driving demand for reliable temperature sensing solutions within this range. Its suitability for both continuous and extreme industrial operations enhances its applicability across MEA industries.
- The oil & gas application segment dominated the market with a 41.28% share in 2025, owing to extensive use of thermocouple temperature sensors in upstream, midstream, and downstream operations. The Middle East’s strong dependency on hydrocarbon production, particularly in Saudi Arabia and UAE, is a key growth driver. These sensors are widely used in drilling operations, refinery units, and pipeline monitoring systems to ensure operational safety and process optimization. Increasing adoption of automation and predictive maintenance in oil fields is further boosting demand. Expansion of petrochemical complexes and LNG infrastructure is strengthening market penetration.
Market Size & Forecast
- Middle East and Africa Market Value (2025): USD 830.30 Million
- Expected Market Value (2033): USD 1130.21 Million
- Forecast CAGR (2026–2033): 3.93%
- Leading Region in 2025: North America
- Fastest Growing Region: Asia-Pacific
Report Scope and Middle East and Africa Thermocouple Temperature Sensors Market Segmentation
|
Attributes |
Thermocouple Temperature Sensors Key Market Insights |
|
Segments Covered |
|
|
Countries Covered |
Middle East and Africa
|
|
Key Market Players |
|
|
Market Opportunities |
|
|
Value Added Data Infosets |
|
What is the Key Trend in the Middle East and Africa Thermocouple Temperature Sensors Market?
Trend: Expansion of Industrial Automation and Predictive Maintenance in Thermocouple Temperature Sensors Market
Industrial facilities across the Middle East and Africa are increasingly integrating Thermocouple Temperature Sensors into automated monitoring and predictive maintenance systems to improve operational efficiency and reduce downtime. Oil & gas refineries, petrochemical plants, and power generation facilities are deploying real-time temperature monitoring solutions to enhance process safety and optimize energy consumption. For instance, large-scale refinery expansions in Saudi Arabia and industrial zone developments in the UAE are driving the adoption of advanced temperature sensing systems integrated with IoT-enabled control platforms. The shift toward Industry 4.0 and smart manufacturing is further strengthening demand for high-accuracy thermocouples capable of operating across extreme temperature ranges, particularly in (-200°C to 1500°C) industrial environments.
Middle East and Africa Thermocouple Temperature Sensors Market Dynamics
Key Market Driver: Strong Growth in Oil & Gas, Petrochemical, and Industrial Infrastructure Expansion
The primary driver of the Middle East and Africa thermocouple temperature sensors market is the rapid expansion of oil & gas production, petrochemical processing, and heavy industrial infrastructure. Countries such as Saudi Arabia, the UAE, and Qatar are heavily investing in refinery upgrades, LNG facilities, and downstream chemical plants, all of which require precise temperature monitoring for safe and efficient operations. For example, Saudi Arabia’s continued development of integrated refining and petrochemical complexes in Jubail and Yanbu is significantly increasing deployment of base metal and noble metal thermocouples. In addition, rising investments in power generation capacity, desalination plants, and metals & mining operations are further accelerating demand for robust temperature sensing technologies across harsh operating environments.
Key Restraint/Challenge: Supply Chain Constraints and High Cost of High-Temperature Sensor Technologies
A major challenge in the Middle East and Africa Thermocouple Temperature Sensors market is the high cost of advanced sensor systems combined with supply chain volatility for specialized materials such as platinum and nickel alloys used in noble metal thermocouples. Fluctuations in raw material pricing and dependence on imports for high-precision sensor components create procurement delays and increase overall system costs. In addition, integration of advanced thermocouples with digital monitoring systems, calibration requirements, and maintenance complexity further limits adoption among small and mid-scale industrial operators. These challenges are particularly evident in cost-sensitive sectors such as food processing and water treatment facilities across emerging African economies.
Key Market Opportunity: Integration of Smart Sensors, IoT, and AI-Enabled Industrial Monitoring Systems
The market presents significant growth opportunities through the integration of Thermocouple Temperature Sensors with IoT platforms, AI-driven analytics, and cloud-based industrial monitoring systems. Smart factories in the UAE and Saudi Arabia are increasingly deploying connected sensor networks to enable real-time temperature tracking, predictive maintenance, and automated fault detection. For instance, industrial automation initiatives in Abu Dhabi’s manufacturing hubs and Saudi Vision 2030-backed smart industrial zones are encouraging adoption of intelligent sensor systems. Furthermore, the expansion of renewable energy projects, hydrogen production facilities, and advanced manufacturing clusters is creating new demand for high-precision thermocouples capable of supporting digital industrial ecosystems and remote monitoring applications across the Middle East and Africa region.
Middle East and Africa Thermocouple Temperature Sensors Market Scope
The thermocouple temperature sensors market is segmented on the basis of type, construction type, temperature range, and application.
By Type
On the basis of type, the global thermocouple temperature sensors market is segmented into Base metal thermocouple and noble metal thermocouple. The base metal thermocouple segment dominated the market with a share of 78.6% in 2025, owing to its cost-effectiveness, durability, wide operating temperature range, and extensive adoption across industrial applications. Base metal thermocouples, including Type K, Type J, Type T, and Type E sensors, are widely used in manufacturing, automotive, power generation, chemical processing, and oil & gas industries due to their reliable temperature measurement capabilities. Their ability to operate in harsh industrial environments, including high vibration, pressure, and temperature fluctuations, has increased their demand across process industries. In addition, the availability of economical materials such as nickel-based alloys makes base metal thermocouples suitable for large-scale industrial installations. Growing industrial automation, expansion of manufacturing facilities, and increasing focus on process monitoring and operational efficiency are further supporting segment growth. Rising adoption of temperature monitoring systems in industrial equipment and machinery is also strengthening the dominance of this segment.
The noble metal thermocouple segment is expected to witness the fastest growth at a CAGR of 6.8% from 2026 to 2033, driven by increasing demand for high-precision temperature sensing solutions in extreme temperature applications. Noble metal thermocouples, including platinum-rhodium-based sensors, offer superior accuracy, chemical stability, and resistance to oxidation, making them suitable for aerospace, semiconductor, pharmaceutical, and advanced manufacturing industries. The growing requirement for precise temperature measurement in high-temperature furnaces, laboratory equipment, and research applications is accelerating adoption. In addition, increasing investments in aerospace manufacturing, semiconductor production, and advanced material processing are creating new growth opportunities. The demand for reliable sensors capable of operating above 1500°C is further contributing to the expansion of noble metal thermocouple applications.
By Construction Type
On the basis of construction type, the global thermocouple temperature sensors market is segmented into Grounded Thermocouples, Exposed Thermocouples, and Ungrounded Thermocouples. The Grounded thermocouples segment dominated the market with a share of 45.3% in 2025, supported by faster response time, improved heat transfer capability, and widespread usage in industrial temperature measurement applications. Grounded thermocouples provide direct contact between the sensing element and protective sheath, enabling quick temperature detection and accurate monitoring in manufacturing equipment, engines, processing systems, and industrial machinery. These sensors are extensively used in applications where rapid response and durability are required, including automotive testing, chemical processing, and power generation facilities. Their ability to withstand mechanical stress and harsh operating conditions has increased adoption among industrial users. Furthermore, growing automation across industries and increasing demand for real-time process monitoring are driving the utilization of grounded thermocouples. The segment continues to maintain its leading position due to its balance between performance, reliability, and cost efficiency.
The ungrounded thermocouples segment is projected to register the fastest growth at a CAGR of 7.1% from 2026 to 2033, driven by rising demand for electrically isolated temperature measurement solutions. Ungrounded thermocouples provide improved protection against electrical interference and are increasingly preferred in sensitive applications involving electronic systems, laboratory equipment, and advanced industrial machinery. The growing adoption of automation, smart manufacturing, and connected industrial systems is increasing the need for accurate and interference-free temperature sensing. Industries such as semiconductor manufacturing, healthcare equipment, and aerospace are increasingly adopting ungrounded sensors due to their enhanced safety and measurement stability. In addition, rising investments in advanced process control technologies are expected to accelerate demand for these sensors during the forecast period.
By Temperature Range
On the basis of temperature range, the global thermocouple temperature sensors market is segmented into (-200°C) To 900°C, (-200°C) To 1250°C, 0 To 750°C, (-250°C) To 350°C, 0 To 1500°C, and 0 To 1700°C. The 0 To 750°C temperature range segment dominated the market with a share of 31.4% in 2025, due to its extensive usage across general industrial applications, automotive systems, food processing equipment, and manufacturing operations. Sensors operating within this range provide reliable temperature measurement for a wide variety of processes where moderate temperature monitoring is required. The segment benefits from high adoption in industrial machinery, HVAC systems, process control equipment, and production lines. Increasing industrial automation and demand for efficient monitoring systems are supporting the growth of this temperature range category. In addition, its compatibility with commonly used thermocouple types such as Type K and Type J has further increased deployment across industries. The cost-effectiveness and availability of sensors within this range continue to make it the preferred choice for multiple applications globally.
The 0 To 1700°C temperature range segment is expected to witness the fastest growth at a CAGR of 7.4% from 2026 to 2033, driven by increasing demand from high-temperature industries such as metals & mining, aerospace, power generation, and advanced manufacturing. These thermocouples are designed for extreme operating environments where accurate measurement of very high temperatures is critical. Growing expansion of steel production, foundries, thermal processing, and industrial furnace applications is increasing the requirement for high-temperature sensors. In addition, technological advancements in platinum-based thermocouples and high-performance materials are improving sensor durability and accuracy. Rising investments in energy infrastructure and industrial modernization projects are further supporting segment growth.
By Application
On the basis of application, the global thermocouple temperature sensors market is segmented into Automotive, Chemical and Petrochemical, Power Generation, Metals and Mining, Oil and Gas, Food and Beverage, Life Science, Aerospace, Waste and Water Treatment, and Others. The Automotive segment dominated the market with a share of 22.7% in 2025, supported by increasing adoption of temperature monitoring systems in vehicle components, engines, exhaust systems, batteries, and manufacturing processes. Automotive manufacturers extensively use thermocouple sensors for engine testing, emission monitoring, thermal management, and electric vehicle battery temperature control. The rapid expansion of electric vehicles and hybrid vehicle technologies is further increasing demand for advanced temperature sensing solutions. In addition, automotive production facilities are adopting automated monitoring systems to improve efficiency, quality control, and safety. Growing vehicle electrification, stringent emission regulations, and increasing automotive R&D activities are strengthening the adoption of thermocouple temperature sensors in this segment.
The aerospace segment is expected to witness the fastest growth at a CAGR of 7.6% from 2026 to 2033, driven by increasing demand for high-performance temperature sensors in aircraft engines, propulsion systems, and aerospace testing applications. Aerospace industries require highly accurate and durable sensors capable of operating under extreme temperatures, pressure, and vibration conditions. Rising aircraft production, development of advanced propulsion technologies, and increasing space exploration activities are creating significant opportunities for thermocouple sensor manufacturers. In addition, the growing focus on aircraft safety, fuel efficiency, and performance optimization is increasing the adoption of advanced temperature monitoring systems. The expansion of defense aerospace programs and commercial aviation investments is further expected to accelerate segment growth during the forecast period.
Middle East and Africa Thermocouple Temperature Sensors Market Regional Analysis
The Middle East and Africa thermocouple temperature sensors market is witnessing steady growth, driven by increasing demand from oil & gas, petrochemical, power generation, manufacturing, and industrial automation sectors. The region’s focus on industrial expansion, energy infrastructure development, and adoption of advanced monitoring technologies is accelerating the deployment of accurate temperature sensing solutions. Rising investments in refinery modernization, smart manufacturing systems, and predictive maintenance technologies are further supporting market growth. Increasing emphasis on operational safety, process efficiency, and automation across harsh industrial environments is creating strong demand for reliable thermocouple temperature sensors throughout the region.
Saudi Arabia Thermocouple Temperature Sensors Market Insight
The Saudi Arabia thermocouple temperature sensors market dominated the Middle East and Africa region with the largest revenue share of 34.12% in 2025, supported by strong demand from oil & gas, petrochemical, and power generation industries. The country’s large-scale industrial expansion under Vision 2030, combined with increasing investments in refinery modernization, downstream processing facilities, and industrial automation, is significantly boosting adoption of high-accuracy temperature sensing solutions.
The strong presence of global energy companies and industrial EPC contractors is supporting widespread deployment of thermocouple sensors across critical applications such as furnaces, turbines, reactors, and processing equipment. In addition, growing integration of smart manufacturing systems, IoT-enabled monitoring, and predictive maintenance technologies across energy-intensive industries is strengthening market demand. Continuous expansion of refining capacity, improving industrial safety standards, and increasing automation in extreme operating environments are further reinforcing Saudi Arabia’s leadership position in the regional market.
U.A.E. Thermocouple Temperature Sensors Market Insight
The U.A.E. thermocouple temperature sensors market is expected to be the fastest-growing market in the Middle East and Africa region, with a CAGR of 7.4% from 2026 to 2033, driven by rapid industrial diversification, expansion of petrochemical clusters, and increasing adoption of smart manufacturing technologies. The country is investing significantly in advanced industrial infrastructure, including oil & gas processing facilities, renewable energy projects, chemical manufacturing plants, and industrial zones. The rising adoption of Industry 4.0 solutions, including IoT-enabled sensors, automated process control, and real-time monitoring systems, is increasing demand for advanced thermocouple temperature sensors. Growth in aerospace, metals processing, food & beverage, and manufacturing industries is further expanding application opportunities. Government initiatives focused on improving energy efficiency, industrial safety, and operational reliability are encouraging the adoption of high-performance temperature measurement technologies. In addition, increasing foreign direct investment (FDI) in industrial hubs such as JAFZA and Khalifa Industrial Zone is accelerating technology adoption and positioning the U.A.E. as a key industrial innovation center in the region.
Which are the Top Companies in Middle East and Africa Thermocouple Temperature Sensors Market?
The Thermocouple Temperature Sensors industry is primarily led by well-established companies, including:
• ABB Ltd. (Switzerland)
• Emerson Electric Co. (U.S.)
• Honeywell International Inc. (U.S.)
• Siemens AG (Germany)
• Schneider Electric SE (France)
• Endress+Hauser Group (Switzerland)
• Yokogawa Electric Corporation (Japan)
• Omega Engineering Inc. (U.S.)
• Watlow Electric Manufacturing Company (U.S.)
• Fluke Corporation (U.S.)
• TE Connectivity Ltd. (Switzerland)
• Texas Instruments Incorporated (U.S.)
• Amphenol Corporation (U.S.)
• NXP Semiconductors N.V. (Netherlands)
• Sensata Technologies Inc. (U.S.)
• Analog Devices Inc. (U.S.)
• Keysight Technologies Inc. (U.S.)
• Danfoss A/S (Denmark)
• WIKA Alexander Wiegand SE & Co. KG (Germany)
• Pyromation Inc. (U.S.)
• Tempsens Instruments (India)
• Conax Technologies (U.S.)
• Omega Engineering (India operations)
• Minco Products Inc. (U.S.)
• JUMO GmbH & Co. KG (Germany)
Latest Developments in Middle East and Africa Thermocouple Temperature Sensors Market
- In March 2021, Emerson Electric Co. expanded its temperature measurement solutions portfolio with advanced process temperature technologies, including thermocouple-based sensing solutions designed for demanding industrial environments. The developments focused on improving measurement reliability, durability, and performance in applications such as oil & gas, chemical processing, and power generation, supporting the growing demand for accurate industrial temperature monitoring systems
- In November 2021, researchers developed a flexible film thermocouple temperature sensor using microelectromechanical system (MEMS)-based manufacturing techniques. The innovation focused on creating miniature, bendable, and fast-response temperature sensors suitable for advanced applications requiring compact and flexible sensing solutions. The development highlighted the growing trend toward miniaturized thermocouple technologies for next-generation temperature monitoring applications
- In May 2022, Endress+Hauser Group continued strengthening its industrial temperature measurement portfolio with advancements in modular RTD and thermocouple thermometer solutions designed for process industries. The company’s temperature assemblies focused on improving measurement accuracy, safety compliance, and reliability in applications including chemical processing, energy, and industrial manufacturing
- In February 2023, Endress+Hauser Group introduced updated safety documentation and product enhancements for its thermocouple thermometer series, supporting hazardous-area applications with improved compliance for industrial process environments. The updates reinforced the use of advanced thermocouple systems in industries requiring high reliability, explosion protection, and continuous temperature monitoring
- In April 2024, Emerson Electric Co. continued expanding its temperature sensing technologies with enhanced thermocouple solutions designed for harsh industrial conditions. Emerson’s temperature measurement products emphasized improved durability, vibration resistance, and accurate monitoring for process industries such as energy, chemical, and manufacturing sectors
- In August 2024, researchers developed a high-temperature thermocouple using additive manufacturing techniques by integrating tungsten-nickel and molybdenum materials with ceramic structures. The development aimed to improve thermal resistance and enable temperature measurement in extreme environments, creating potential applications in aerospace, automotive, microelectronics, and advanced industrial systems
- In March 2025, Endress+Hauser Group continued advancements in process temperature measurement solutions by expanding documentation and application support for its thermocouple thermometer product families used in industrial environments. These developments supported increased adoption of reliable temperature sensing solutions across process industries, including chemical, energy, and manufacturing applications
- In October 2025, researchers introduced a machine-learning-based approach for self-validating thermocouples, enabling automated detection of calibration drift and improving measurement reliability in harsh industrial environments. The technology demonstrated how artificial intelligence and advanced analytics can enhance thermocouple accuracy, predictive maintenance, and long-term sensor performance
SKU-

- Interactive Data Analysis Dashboard
- Company Analysis Dashboard for high growth potential opportunities
- Research Analyst Access for customization & queries
- Competitor Analysis with Interactive dashboard
- Latest News, Updates & Trend analysis
- Harness the Power of Benchmark Analysis for Comprehensive Competitor Tracking
Middle East And Africa Thermocouple Temperature Sensors Market, Supply Chain Analysis and Ecosystem Framework
To support market growth and help clients navigate the impact of geopolitical shifts, DBMR has integrated in-depth supply chain analysis into its Middle East And Africa Thermocouple Temperature Sensors Market research reports. This addition empowers clients to respond effectively to global changes affecting their industries. The supply chain analysis section includes detailed insights such as Middle East And Africa Thermocouple Temperature Sensors Market consumption and production by country, price trend analysis, the impact of tariffs and geopolitical developments, and import and export trends by country and HSN code. It also highlights major suppliers with data on production capacity and company profiles, as well as key importers and exporters. In addition to research, DBMR offers specialized supply chain consulting services backed by over a decade of experience, providing solutions like supplier discovery, supplier risk assessment, price trend analysis, impact evaluation of inflation and trade route changes, and comprehensive market trend analysis.
Data collection and base year analysis are done using data collection modules with large sample sizes. The stage includes obtaining market information or related data through various sources and strategies. It includes examining and planning all the data acquired from the past in advance. It likewise envelops the examination of information inconsistencies seen across different information sources. The market data is analysed and estimated using market statistical and coherent models. Also, market share analysis and key trend analysis are the major success factors in the market report. To know more, please request an analyst call or drop down your inquiry.
The key research methodology used by DBMR research team is data triangulation which involves data mining, analysis of the impact of data variables on the market and primary (industry expert) validation. Data models include Vendor Positioning Grid, Market Time Line Analysis, Market Overview and Guide, Company Positioning Grid, Patent Analysis, Pricing Analysis, Company Market Share Analysis, Standards of Measurement, Global versus Regional and Vendor Share Analysis. To know more about the research methodology, drop in an inquiry to speak to our industry experts.
Data Bridge Market Research is a leader in advanced formative research. We take pride in servicing our existing and new customers with data and analysis that match and suits their goal. The report can be customized to include price trend analysis of target brands understanding the market for additional countries (ask for the list of countries), clinical trial results data, literature review, refurbished market and product base analysis. Market analysis of target competitors can be analyzed from technology-based analysis to market portfolio strategies. We can add as many competitors that you require data about in the format and data style you are looking for. Our team of analysts can also provide you data in crude raw excel files pivot tables (Fact book) or can assist you in creating presentations from the data sets available in the report.


