
Market Analysis and Size
Torque vectoring solutions are most important and crucial systems which ensure safety and help in improving the car’s performance. These systems basically provide or distribute torque between the wheels which allows the vehicle to effectively turn over a bend or curve. Torque vectoring is a holistic, predictive approach to vehicle dynamics using a combination of hardware and electronic systems. The Global Torque Vectoring market is growing rapidly due to emergence of EVS & and its torque vectoring system. The companies are even launching new products to gain a larger market share.
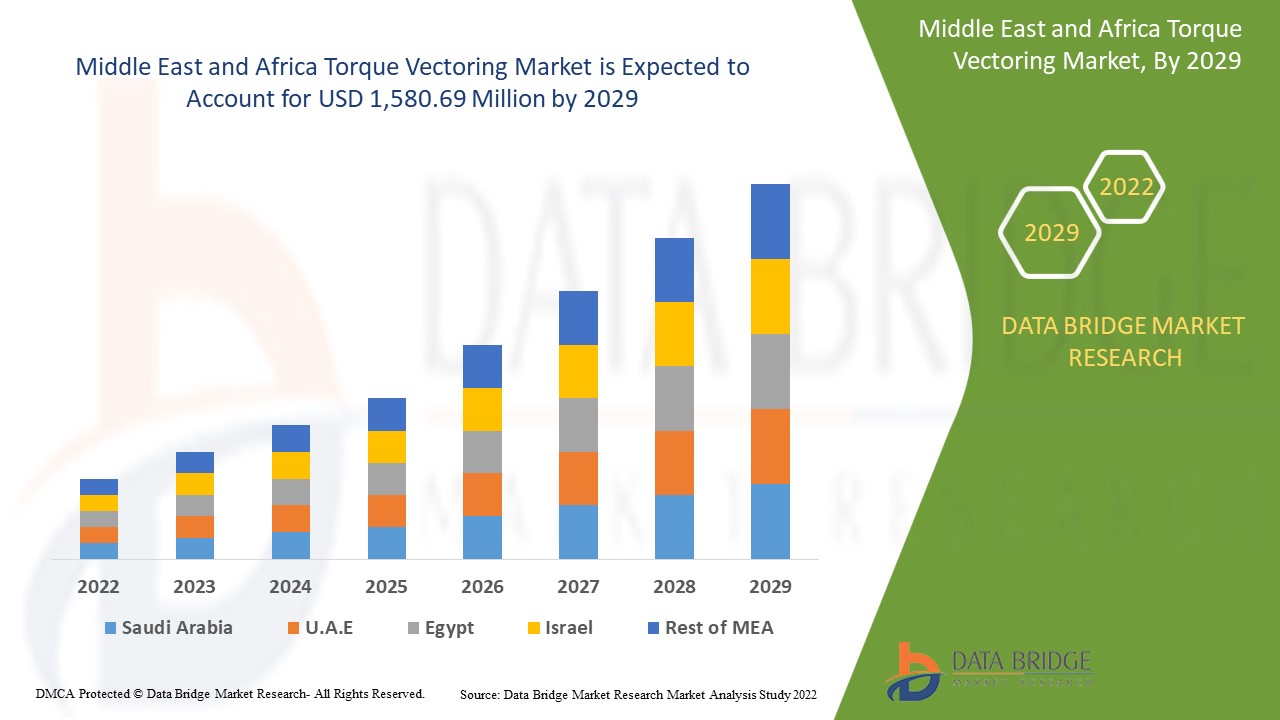
Data Bridge Market Research analyses that the Torque vectoring market is expected to reach the value of USD 1,580.69 million by 2029. "Hardware" accounts for the most prominent component segment. The torque vectoring market report also covers pricing analysis, patent analysis, and technological advancements in depth.
|
Report Metric |
Details |
|
Forecast Period |
2022 to 2029 |
|
Base Year |
2021 |
|
Historic Year |
2020 |
|
Quantitative Units |
USD Million |
|
Segments Covered |
By Component (Hardware and Services), Technology (Active Torque Vectoring Systems (ATVS) and Passive Torque Vectoring Systems (PTVS)), By Clutch Actuation Type (Electric and Hydraulic), By Driving Wheel Type (Front-Wheel Drive (FWD), All-Wheel Drive/Four-Wheel Drive (AWD/4WD) and Rear-Wheel Drive (RWD)), Vehicle Type (Passenger Cars, Commercial Vehicles and Off Road Vehicle), Propulsion Type (Diesel/Petrol/CNG and Electric Vehicle) |
|
Countries Covered |
Saudi Arabia, U.A.E., South Africa, Egypt, Israel, Kuwait, Rest of Middle East and Africa |
|
Market Players Covered |
Eaton, Inc., Dana Limited, JTEKT Corporation, Magna International Inc., Robert Bosch GmbH, Continental AG, MITSUBISHI MOTORS CORPORATION, Haldex, , THE TIMKEN COMPANY, Linamar Corporation, Ricardo, ZF Friedrichshafen AG among others |
Market Definition
Torque vectoring solutions are most important and crucial systems which ensures safety and helps in improving the car’s performance. These systems basically provide or distributes torque between the wheels which allows the vehicle to effectively turn over a bend or curve. Torque vectoring is a holistic, predictive approach to vehicle dynamics using a combination of hardware and electronic systems. It provides the most suitable distribution of torque to a wheel at any point based on the driver’s intentions and the driving conditions. There are basically two types which are prominently used, one is brake-based torque vectoring and the other one is electric-based torque vectoring.
Torque Vectoring Market Dynamics
This section deals with understanding the market drivers, opportunities, restraints and challenges. All of this is discussed in detail as below:
Drivers
- Increase In Population & Rapid Urbanization
Over a decade, industrialization and urbanization have played a significant role in the emergence and growth of the automotive industry. The growing global population and the majority of the population shifting towards urban areas for a better opportunity and better living standards plays a vital role in shaping the automotive industry sector.
- Emergence of EVS And Its Torque Vectoring System
The automotive industry has shown enormous growth due to the rising demand for luxurious electric vehicles. All-electric vehicles (E.V.s) are called battery electric vehicles that use a battery to store the electrical energy that powers the vehicles. Some of the factors driving the sales of electric vehicles include stringent government regulations towards vehicle emissions and increasing demand for fuel-efficient, high performance, and low emission vehicles. This adds to the adoption of electric vehicles as all-electric vehicles as zero-emission, which effectively minimizes carbon emission.
- Intelligent Torque Vectoring Approach for ADAS Vehicles
Advanced driver-assistance systems (ADAS) are electronic systems implanted in automobiles to assist driving vehicles or self-driving cars. This system uses sensors such as radars and cameras for analysis and takes automatic action based on the vehicle's surroundings. This system implemented in automobiles enables the enhancement of safety systems in terms of driving by avoiding collisions, adopting cruise control, anti-locking of brakes, automation in lighting, pedestrian crash avoidance mitigation (PCAM), and many others.
- Upsurge In Demand for Luxury And Performance Vehicles
A luxury smart connected vehicle can connect over a wireless network to nearby devices with advanced luxury features such as higher-quality interior materials, engines, transmissions, sound systems, telematics, and safety features. These vehicles have features that aren't available on lower-priced models of vehicles.
Restraints/Challenges
- High Cost Associated With Implementing Torque Vectoring/AWD/4WD Systems
Torque vectoring solutions are the most crucial systems which ensure safety and help in improving the car's performance. These systems distribute torque between the wheels, allowing the vehicle to bend or curve effectively. Two types are prominently used brake-based torque vectoring and the other is electric-based torque vectoring. Pricing of both the system are different Electron-based torque vectoring is slightly more expensive than the other with a difference of USD 1,000 to USD 2,000, due to the usage of more electronic components and electromagnetic principle.
- High Carbon Footprint of The Automotive Sector
A carbon footprint is the total amount of greenhouse gases (including carbon dioxide and methane) generated by a system or a process that drastically affects the environment. Climate change and sustainability have become important factors that play a growing role in business management. Worldwide there is more and more pressure on companies to limit their greenhouse gas emissions and take action to become more environmentally friendly.
Post COVID-19 Impact on Torque Vectoring Market
COVID-19 created a major impact on the torque vectoring market as almost every country has opted for the shutdown for every production facility except the ones dealing in producing the essential goods. The government has taken some strict actions such as the shutdown of production and sale of non-essential goods, blocked international trade, and many more to prevent the spread of COVID-19. The only business which is dealing in this pandemic situation is the essential services that are allowed to open and run the processes.
The growth of the torque vectoring market is rising due to the government policies to boost international trade post COVID. Also the benefits offered by torque vectoring market for fishing market and seafood demand is rising the demand for torque vectoring market in the market. However, factors such as congestion associated with trade routes and trade restrictions between some nations are restraining the market growth. The shutdown of production facilities during the pandemic situation has had a significant impact on the market.
Manufacturers are making various strategic decisions to bounce back post-COVID-19. The players are conducting multiple research and development activities to improve the technology involved in the torque vectoring market. With this, the companies will bring advanced and accurate solutions to the market. In addition, the government initiatives to boost international trade has led to the market's growth.
Recent Developments
- In March 2022, Prodrive Holdings Limited launched world’s first all-terrain Hyper Car. The keay feature of this car launch was its 600 bhp four-wheel drive all-terrain adventure vehicle with an unrivalled ability and performance across any landscape. Through this company expanded its market by offering innovative solution for its consumer
- In October 2021, MITSUBISHI MOTORS CORPORATION launched advanced electric torque vectoring systems for Outlander crossover SUV. All-wheel control technologies included for the vehicle will help the vehicle to be stable, offer better control and operational. This allowed the company to expand its torque vectoring systems offering, capabilities and portfolio across all regions
Middle East and Africa Torque Vectoring Market Scope
The torque vectoring market is segmented on the basis of component, technology, clutch actuation type, driving wheel type, vehicle type and propulsion type. The growth amongst these segments will help you analyze meagre growth segments in the industries and provide the users with a valuable market overview and market insights to help them make strategic decisions for identifying core market applications.
By Component
- Hardware
- Services
On the basis of system, the Middle East and Africa torque vectoring market is segmented into hardware and services.
By Technology
- Active Torque Vectoring Systems (ATVS)
- Passive Torque Vectoring Systems (PTVS)
On the basis of technology, the Middle East and Africa torque vectoring market has been segmented into Active Torque Vectoring Systems (ATVS) and Passive Torque Vectoring Systems (PTVS).
By Clutch Actuation Type
- Electric
- Hydraulic
On the basis of clutch actuation type, the Middle East and Africa torque vectoring market has been segmented into electric and hydraulic.
By Driving Wheel Type
- Front-Wheel Drive (FWD)
- All-Wheel Drive/Four-Wheel Drive (AWD/4WD)
- Rear-Wheel Drive (RWD)
On the basis of driving wheel type, the Middle East and Africa torque vectoring market has been segmented into Front-Wheel Drive (FWD), All-Wheel Drive/Four-Wheel Drive (AWD/4WD) and Rear-Wheel Drive (RWD).
By Vehicle Type
- Passenger Cars
- Commercial Vehicles
- Off Road Vehicle
On the basis of vehicle type, the Middle East and Africa torque vectoring market has been segmented into passenger cars, commercial vehicles and off road vehicle.
By Propulsion Type
- Diesel/Petrol/CNG
- Electric Vehicle
On the basis of propulsion type, the Middle East and Africa torque vectoring market has been segmented into Diesel/Petrol/CNG and electric vehicle.
Torque Vectoring Market Regional Analysis/Insights
The torque vectoring market is analysed and market size insights and trends are provided by country, system, type, vessel length and freezing capacity as referenced above.
The countries covered in the torque vectoring market report are Saudi Arabia, U.A.E., South Africa, Egypt, Israel, Kuwait and Rest of Middle East and Africa.
Saudi Arabia dominates the Middle East and Africa torque vectoring market. Saudi Arabia is likely to be the fastest-growing Middle East and Africa torque vectoring market. The rising infrastructure, commercial, and demand for luxury automobile in emerging countries such as Saudi Arabia and U.A.E. are credited with the market's dominance. Saudi Arabia dominates the Middle East and Africa region due to the high demand.
The country section of the report also provides individual market impacting factors and changes in market regulation that impact the current and future trends of the market. Data points like down-stream and upstream value chain analysis, technical trends and porter's five forces analysis, case studies are some of the pointers used to forecast the market scenario for individual countries. Also, the presence and availability of Middle East and Africa brands and their challenges faced due to large or scarce competition from local and domestic brands, impact of domestic tariffs and trade routes are considered while providing forecast analysis of the country data.
Competitive Landscape and Torque Vectoring Market Share Analysis
The torque vectoring market competitive landscape provides details by competitor. Details included are company overview, company financials, revenue generated, market potential, investment in research and development, new market initiatives, Middle East and Africa presence, production sites and facilities, production capacities, company strengths and weaknesses, product launch, product width and breadth, application dominance. The above data points provided are only related to the companies' focus related to torque vectoring market.
Some of the major players operating in the torque vectoring market are Eaton, Inc., Dana Limited, JTEKT Corporation, Magna International Inc., Robert Bosch GmbH, Continental AG, MITSUBISHI MOTORS CORPORATION, Haldex, THE TIMKEN COMPANY, Linamar Corporation, Ricardo, ZF Friedrichshafen AG among others.
SKU-

- Interactive Data Analysis Dashboard
- Company Analysis Dashboard for high growth potential opportunities
- Research Analyst Access for customization & queries
- Competitor Analysis with Interactive dashboard
- Latest News, Updates & Trend analysis
- Harness the Power of Benchmark Analysis for Comprehensive Competitor Tracking
Table of Content
1 INTRODUCTION
1.1 OBJECTIVES OF THE STUDY
1.2 MARKET DEFINITION
1.3 OVERVIEW OF MIDDLE EAST & AFRICA TORQUE VECTORING MARKET
1.4 CURRENCY AND PRICING
1.5 LIMITATIONS
1.6 MARKETS COVERED
2 MARKET SEGMENTATION
2.1 MARKETS COVERED
2.2 GEOGRAPHICAL SCOPE
2.3 YEARS CONSIDERED FOR THE STUDY
2.4 DBMR TRIPOD DATA VALIDATION MODEL
2.5 PRIMARY INTERVIEWS WITH KEY OPINION LEADERS
2.6 DBMRMARKET POSITION GRID
2.7 VENDOR SHARE ANALYSIS
2.8 MULTIVARIATE MODELING
2.9 COMPONENT TIMELINE CURVE
2.1 SECONDARY SOURCES
2.11 ASSUMPTIONS
3 EXECUTIVE SUMMARY
4 PREMIUM INSIGHTS
4.1 PORTER FIVE FORCES ANALYSIS
4.2 REGULATORY FRAMEWORK
5 MARKET OVERVIEW
5.1 DRIVERS
5.1.1 INCREASE IN POPULATION & RAPID URBANIZATION
5.1.2 EMERGENCE OF EVS & AND ITS TORQUE VECTORING SYSTEM
5.1.3 INTELLIGENT TORQUE VECTORING APPROACH FOR ADAS VEHICLES
5.1.4 UPSURGE IN DEMAND FOR LUXURY AND PERFORMANCE VEHICLES
5.2 RESTRAINTS
5.2.1 HIGH COST ASSOCIATED WITH IMPLEMENTING TORQUE VECTORING/AWD/4WD SYSTEMS
5.2.2 HIGH CARBON FOOTPRINT OF THE AUTOMOTIVE SECTOR
5.3 OPPORTUNITIES
5.3.1 HEAVING ADOPTION OF TORQUE VECTORING SYSTEM IN OFF-ROAD VEHICLES
5.3.2 GROWING AWARENESS ABOUT ENHANCED SAFETY AND VEHICLE DYNAMICS
5.4 CHALLENGES
5.4.1 HAMPERED SUPPLY OF SEMICONDUCTOR EQUIPMENT LIMITS TORQUE VECTORING SYSTEM
5.4.2 CHANGING AUTOMOTIVE PRODUCT LIFE CYCLE AND LONG PRODUCTION CYCLE OF AUTOMOTIVE VEHICLES
6 MIDDLE EAST & AFRICA TORQUE VECTORING MARKET, BY COMPONENT
6.1 OVERVIEW
6.2 HARDWARE
6.2.1 DRIVE CONTROL UNIT (DCU)
6.2.2 MOTOR CONTROLLERS
6.2.3 SENSORS
6.2.4 MOTOR
6.2.5 CAN BUS
6.2.6 OTHERS
6.3 SERVICES
7 MIDDLE EAST & AFRICA TORQUE VECTORING MARKET, BY TECHNOLOGY
7.1 OVERVIEW
7.2 ACTIVE TORQUE VECTORING SYSTEMS (ATVS)
7.3 PASSIVE TORQUE VECTORING SYSTEMS (PTVS)
8 MIDDLE EAST & AFRICA TORQUE VECTORING MARKET, BY CLUTCH ACTUATION TYPE
8.1 OVERVIEW
8.2 ELECTRIC
8.3 HYDRAULIC
9 MIDDLE EAST & AFRICA TORQUE VECTORING MARKET, BY DRIVING WHEEL TYPE
9.1 OVERVIEW
9.2 FRONT-WHEEL DRIVE (FWD)
9.3 ALL-WHEEL DRIVE/FOUR-WHEEL DRIVE (AWD/4WD)
9.4 REAR-WHEEL DRIVE (RWD)
10 MIDDLE EAST & AFRICA TORQUE VECTORING MARKET, BY VEHICLE TYPE
10.1 OVERVIEW
10.2 PASSENGER CARS
10.2.1 BY TYPE
10.2.1.1 SEDAN
10.2.1.2 HATCHBACK
10.2.1.3 CROSSOVERS
10.2.1.4 SUV
10.2.1.5 OTHERS
10.2.2 BY TECHNOLOGY
10.2.2.1 ACTIVE TORQUE VECTORING SYSTEMS (ATVS)
10.2.2.2 PASSIVE TORQUE VECTORING SYSTEMS (PTVS)
10.3 COMMERCIAL VEHICLES
10.3.1 BY TYPE
10.3.1.1 LIGHT COMMERCIAL VEHICLE
10.3.1.2 HEAVY COMMERCIAL VEHICLE
10.3.1.2.1 BUS
10.3.1.2.2 TRUCKS
10.3.2 BY TECHNOLOGY
10.3.2.1 ACTIVE TORQUE VECTORING SYSTEMS (ATVS)
10.3.2.2 PASSIVE TORQUE VECTORING SYSTEMS (PTVS)
10.4 OFF ROAD VEHICLE
10.4.1 BY TECHNOLOGY
10.4.1.1 ACTIVE TORQUE VECTORING SYSTEMS (ATVS)
10.4.1.2 PASSIVE TORQUE VECTORING SYSTEMS (PTVS)
11 MIDDLE EAST & AFRICA TORQUE VECTORING MARKET, BY PROPULSION TYPE
11.1 OVERVIEW
11.2 DIESEL/PETROL/CNG
11.3 ELECTRIC VEHICLE
11.3.1 BATTERY ELECTRIC VEHICLE (BEV)
11.3.2 HYBRID ELECTRIC VEHICLE (HEV)
12 MIDDLE EAST & AFRICA TORQUE VECTORING MARKET, BY REGION
12.1 MIDDLE EAST AND AFRICA
12.1.1 SAUDI ARABIA (LEFT HAND DRIVE)
12.1.2 U.A.E. (LEFT HAND DRIVE)
12.1.3 SOUTH AFRICA (RIGHT HAND DRIVE)
12.1.4 EGYPT (LEFT HAND DRIVE)
12.1.5 ISRAEL (LEFT HAND DRIVE)
12.1.6 KUWAIT (LEFT HAND DRIVE)
12.1.7 REST OF MIDDLE EAST AND AFRICA
13 MIDDLE EAST & AFRICA TORQUE VECTORING MARKET, COMPANY LANDSCAPE
13.1 COMPANY SHARE ANALYSIS: MIDDLE EAST & AFRICA
14 SWOT ANALYSIS
15 COMPANY PROFILE
15.1 AMERICAN AXLE & MANUFACTURING, INC.
15.1.1 COMPANY SNAPSHOT
15.1.2 REVENUE ANALYSIS
15.1.3 COMPANY PROFILE
15.1.4 PRODUCT PORTFOLIO
15.1.5 RECENT DEVELOPMENTS
15.2 CONTINENTAL AG
15.2.1 COMPANY SNAPSHOT
15.2.2 REVENUE ANALYSIS
15.2.3 COMPANY SHARE ANALYSIS
15.2.4 PRODUCT PORTFOLIO
15.2.5 RECENT DEVELOPMENT
15.3 EATON
15.3.1 COMPANY SNAPSHOT
15.3.2 REVENUE ANALYSIS
15.3.3 COMPANY SHARE ANALYSIS
15.3.4 PRODUCT PORTFOLIO
15.3.5 RECENT DEVELOPMENTS
15.4 SCHAEFFLER AG
15.4.1 COMPANY SNAPSHOT
15.4.2 REVENUE ANALYSIS
15.4.3 COMPANY SHARE ANALYSIS
15.4.4 PRODUCT PORTFOLIO
15.4.5 RECENT DEVELOPMENTS
15.5 JTEKT CORPORATION
15.5.1 COMPANY SNAPSHOT
15.5.2 REVENUE ANALYSIS
15.5.3 COMPANY SHARE ANALYSIS
15.5.4 PRODUCT PORTFOLIO
15.5.5 RECENT DEVELOPMENTS
15.6 BORGWARNER INC.
15.6.1 COMPANY SNAPSHOT
15.6.2 REVENUE ANALYSIS
15.6.3 PRODUCT PORTFOLIO
15.6.4 RECENT DEVELOPMENTS
15.7 DANA LIMITED
15.7.1 COMPANY SNAPSHOT
15.7.2 REVENUE ANALYSIS
15.7.3 PRODUCT PORTFOLIO
15.7.4 RECENT DEVELOPMENTS
15.8 DRAKO MOTORS, INC.
15.8.1 COMPANY SNAPSHOT
15.8.2 PRODUCTS PORTFOLIO
15.8.3 RECENT DEVELOPMENT
15.9 GKN AUTOMOTIVE LIMITED
15.9.1 COMPANY SNAPSHOT
15.9.2 REVENUE ANALYSIS
15.9.3 PRODUCTS PORTFOLIO
15.9.4 RECENT DEVELOPMENTS
15.1 HALDEX
15.10.1 COMPANY SNPASHOT
15.10.2 REVENUE ANALYSIS
15.10.3 PRODUCT PORTFOLIO
15.10.4 RECENT DEVELOPMENT
15.11 HEWLAND ENGINEERING LTD
15.11.1 COMPANY SNAPSHOT
15.11.2 PRODUCT PORTFOLIO
15.11.3 RECENT DEVELOPMENTS
15.12 LINAMAR CORPORATION
15.12.1 COMPANY SNAPSHOT
15.12.2 REVENUE ANALYSIS
15.12.3 PRODUCT PORTFOLIO
15.12.4 RECENT DEVELOPMENTS
15.13 MAGNA INTERNATIONAL INC.
15.13.1 COMPANY SNAPSHOT
15.13.2 REVENUE ANALYSIS
15.13.3 PRODUCT PORTFOLIO
15.13.4 RECENT DEVELOPMENTS
15.14 MITSUBISHI MOTORS CORPORATION
15.14.1 COMPANY SNAPSHOT
15.14.2 REVENUE ANALYSIS
15.14.3 PRODUCTS PORTFOLIO
15.14.4 RECENT DEVELOPMENT
15.15 MODELON
15.15.1 COMPANY SNAPSHOT
15.15.2 REVENUE ANALYSIS
15.15.3 PRODUCT PORTFOLIO
15.15.4 RECENT DEVELOPMENT
15.16 PRODRIVE HOLDINGS LIMITED
15.16.1 COMPANY SNAPSHOT
15.16.2 PRODUCTS PORTFOLIO
15.16.3 RECENT DEVELOPMENT
15.17 PROTEAN
15.17.1 COMPANY SNAPSHOT
15.17.2 PRODUCT PORTFOLIO
15.17.3 RECENT DEVELOPMENTS
15.18 RICARDO
15.18.1 COMPANY SNAPSHOT
15.18.2 REVENUE ANALYSIS
15.18.3 PRODUCT PORTFOLIO
15.18.4 RECENT DEVELOPMENTS
15.19 ROBERT BOSCH GMBH
15.19.1 COMPANY SNAPSHOT
15.19.2 REVENUE ANALYSIS
15.19.3 PRODUCT PORTFOLIO
15.19.4 RECENT DEVELOPMENT
15.2 THE TIMKEN COMPANY
15.20.1 COMPANY SNAPSHOT
15.20.2 PRODUCT PORTFOLIO
15.20.3 RECENT DEVELOPMENT
15.21 UNIVANCE CORPORATION
15.21.1 COMPANY SNAPSHOT
15.21.2 PRODUCT PORTFOLIO
15.21.3 RECENT DEVELOPMENT
15.22 ZF FRIEDRICHSHAFEN AG
15.22.1 COMPANY SNAPSHOT
15.22.2 SOLUTION PORTFOLIO
15.22.3 RECENT DEVELOPMENTS
16 QUESTIONNAIRE
17 RELATED REPORTS
List of Table
TABLE 1 PERFORMANCE TABLE
TABLE 2 CARBON EMISSION LEVEL OF VARIOUS TYPES OF CARS & SUVS
TABLE 3 MIDDLE EAST & AFRICA TORQUE VECTORING MARKET, BY COMPONENT, 2020-2029 (USD MILLION)
TABLE 4 MIDDLE EAST & AFRICA HARDWARE IN TORQUE VECTORING MARKET, BY REGION, 2020-2029 (USD MILLION)
TABLE 5 MIDDLE EAST & AFRICA HARDWARE IN TORQUE VECTORING MARKET, BY TYPE, 2020-2029 (USD MILLION)
TABLE 6 MIDDLE EAST & AFRICA SERVICES IN TORQUE VECTORING MARKET, BY REGION, 2020-2029 (USD MILLION)
TABLE 7 MIDDLE EAST & AFRICA TORQUE VECTORING MARKET, BY TECHNOLOGY, 2020-2029 (USD MILLION)
TABLE 8 MIDDLE EAST & AFRICA ACTIVE TORQUE VECTORING SYSTEMS (ATVS) IN TORQUE VECTORING MARKET, BY REGION, 2020-2029 (USD MILLION)
TABLE 9 MIDDLE EAST & AFRICA PASSIVE TORQUE VECTORING SYSTEMS (PTVS) IN TORQUE VECTORING MARKET, BY REGION, 2020-2029 (USD MILLION)
TABLE 10 MIDDLE EAST & AFRICA TORQUE VECTORING MARKET, BY CLUTCH ACTUATION TYPE, 2020-2029 (USD MILLION)
TABLE 11 MIDDLE EAST & AFRICA ELECTRIC IN TORQUE VECTORING MARKET, BY REGION, 2020-2029 (USD MILLION)
TABLE 12 MIDDLE EAST & AFRICA HYDRAULIC IN TORQUE VECTORING MARKET, BY REGION, 2020-2029 (USD MILLION)
TABLE 13 MIDDLE EAST & AFRICA TORQUE VECTORING MARKET, BY DRIVING WHEEL TYPE, 2020-2029 (USD MILLION)
TABLE 14 MIDDLE EAST & AFRICA FRONT-WHEEL DRIVE (FWD) IN TORQUE VECTORING MARKET, BY REGION, 2020-2029 (USD MILLION)
TABLE 15 MIDDLE EAST & AFRICA ALL-WHEEL DRIVE/FOUR-WHEEL DRIVE (AWD/4WD) IN TORQUE VECTORING MARKET, BY REGION, 2020-2029 (USD MILLION)
TABLE 16 MIDDLE EAST & AFRICA REAR-WHEEL DRIVE (RWD) IN TORQUE VECTORING MARKET, BY REGION, 2020-2029 (USD MILLION)
TABLE 17 MIDDLE EAST & AFRICA TORQUE VECTORING MARKET, BY VEHICLE TYPE, 2020-2029 (USD MILLION)
TABLE 18 MIDDLE EAST & AFRICA PASSENGER CARS IN TORQUE VECTORING MARKET, BY REGION, 2020-2029 (USD MILLION)
TABLE 19 MIDDLE EAST & AFRICA PASSENGER CARS IN TORQUE VECTORING MARKET, BY TYPE, 2020-2029 (USD MILLION)
TABLE 20 MIDDLE EAST & AFRICA PASSENGER CARS IN TORQUE VECTORING MARKET, BY TECHNOLOGY, 2020-2029 (USD MILLION)
TABLE 21 MIDDLE EAST & AFRICA COMMERCIAL VEHICLES IN TORQUE VECTORING MARKET, BY REGION, 2020-2029 (USD MILLION)
TABLE 22 MIDDLE EAST & AFRICA COMMERCIAL VEHICLE IN TORQUE VECTORING MARKET, BY TYPE, 2020-2029 (USD MILLION)
TABLE 23 MIDDLE EAST & AFRICA HEAVY COMMERCIAL VEHICLE IN TORQUE VECTORING MARKET, BY TYPE, 2020-2029 (USD MILLION)
TABLE 24 MIDDLE EAST & AFRICA COMMERCIAL VEHICLE IN TORQUE VECTORING MARKET, BY TECHNOLOGY, 2020-2029 (USD MILLION)
TABLE 25 MIDDLE EAST & AFRICA OFF ROAD VEHICLE IN TORQUE VECTORING MARKET, BY REGION, 2020-2029 (USD MILLION)
TABLE 26 MIDDLE EAST & AFRICA OFF ROAD VEHICLE IN TORQUE VECTORING MARKET, BY TECHNOLOGY, 2020-2029 (USD MILLION)
TABLE 27 MIDDLE EAST & AFRICA TORQUE VECTORING MARKET, BY PROPULSION TYPE, 2020-2029 (USD MILLION)
TABLE 28 MIDDLE EAST & AFRICA DIESEL/PETROL/CNG IN TORQUE VECTORING MARKET, BY REGION, 2020-2029 (USD MILLION)
TABLE 29 MIDDLE EAST & AFRICA ELECTRIC VEHICLE IN TORQUE VECTORING MARKET, BY REGION, 2020-2029 (USD MILLION)
TABLE 30 MIDDLE EAST & AFRICA ELECTRIC VEHICLE IN TORQUE VECTORING MARKET, BY TYPE, 2020-2029 (USD MILLION)
TABLE 31 MIDDLE EAST AND AFRICA TORQUE VECTORING MARKET, BY COUNTRY, 2020-2029 (USD MILLION)
TABLE 32 MIDDLE EAST AND AFRICA (LEFT HAND DRIVE) TORQUE VECTORING MARKET, BY COUNTRY, 2020-2029 (USD MILLION)
TABLE 33 MIDDLE EAST AND AFRICA (RIGHT HAND DRIVE) TORQUE VECTORING MARKET, BY COUNTRY, 2020-2029 (USD MILLION)
TABLE 34 MIDDLE EAST AND AFRICA TORQUE VECTORING MARKET, BY COMPONENT, 2020-2029 (USD MILLION)
TABLE 35 MIDDLE EAST AND AFRICA HARDWARE IN TORQUE VECTORING MARKET, BY TYPE, 2020-2029 (USD MILLION)
TABLE 36 MIDDLE EAST AND AFRICA TORQUE VECTORING MARKET, BY TECHNOLOGY, 2020-2029 (USD MILLION)
TABLE 37 MIDDLE EAST AND AFRICA TORQUE VECTORING MARKET, BY CLUTCH ACTUATION TYPE, 2020-2029 (USD MILLION)
TABLE 38 MIDDLE EAST AND AFRICA TORQUE VECTORING MARKET, BY DRIVING WHEEL TYPE, 2020-2029 (USD MILLION)
TABLE 39 MIDDLE EAST AND AFRICA TORQUE VECTORING MARKET, BY VEHICLE TYPE, 2020-2029 (USD MILLION)
TABLE 40 MIDDLE EAST AND AFRICA PASSENGER CARS IN TORQUE VECTORING MARKET, BY TYPE, 2020-2029 (USD MILLION)
TABLE 41 MIDDLE EAST AND AFRICA PASSENGER CARS IN TORQUE VECTORING MARKET, BY TECHNOLOGY, 2020-2029 (USD MILLION)
TABLE 42 MIDDLE EAST AND AFRICA COMMERCIAL VEHICLE IN TORQUE VECTORING MARKET, BY TYPE, 2020-2029 (USD MILLION)
TABLE 43 MIDDLE EAST AND AFRICA HEAVY COMMERCIAL VEHICLE IN TORQUE VECTORING MARKET, BY TYPE, 2020-2029 (USD MILLION)
TABLE 44 MIDDLE EAST AND AFRICA COMMERCIAL VEHICLE IN TORQUE VECTORING MARKET, BY TECHNOLOGY, 2020-2029 (USD MILLION)
TABLE 45 MIDDLE EAST AND AFRICA OFF ROAD VEHICLE IN TORQUE VECTORING MARKET, BY TECHNOLOGY, 2020-2029 (USD MILLION)
TABLE 46 MIDDLE EAST AND AFRICA TORQUE VECTORING MARKET, BY PROPULSION TYPE, 2020-2029 (USD MILLION)
TABLE 47 MIDDLE EAST AND AFRICA ELECTRIC VEHICLE IN TORQUE VECTORING MARKET, BY TECHNOLOGY, 2020-2029 (USD MILLION)
TABLE 48 SAUDI ARABIA (LEFT HAND DRIVE) TORQUE VECTORING MARKET, BY COMPONENT, 2020-2029 (USD MILLION)
TABLE 49 SAUDI ARABIA (LEFT HAND DRIVE) HARDWARE IN TORQUE VECTORING MARKET, BY TYPE, 2020-2029 (USD MILLION)
TABLE 50 SAUDI ARABIA (LEFT HAND DRIVE) TORQUE VECTORING MARKET, BY TECHNOLOGY, 2020-2029 (USD MILLION)
TABLE 51 SAUDI ARABIA (LEFT HAND DRIVE) TORQUE VECTORING MARKET, BY CLUTCH ACTUATION TYPE, 2020-2029 (USD MILLION)
TABLE 52 SAUDI ARABIA (LEFT HAND DRIVE) TORQUE VECTORING MARKET, BY DRIVING WHEEL TYPE, 2020-2029 (USD MILLION)
TABLE 53 SAUDI ARABIA (LEFT HAND DRIVE) TORQUE VECTORING MARKET, BY VEHICLE TYPE, 2020-2029 (USD MILLION)
TABLE 54 SAUDI ARABIA (LEFT HAND DRIVE) PASSENGER CARS IN TORQUE VECTORING MARKET, BY TYPE, 2020-2029 (USD MILLION)
TABLE 55 SAUDI ARABIA (LEFT HAND DRIVE) PASSENGER CARS IN TORQUE VECTORING MARKET, BY TECHNOLOGY, 2020-2029 (USD MILLION)
TABLE 56 SAUDI ARABIA (LEFT HAND DRIVE) COMMERCIAL VEHICLE IN TORQUE VECTORING MARKET, BY TYPE, 2020-2029 (USD MILLION)
TABLE 57 SAUDI ARABIA (LEFT HAND DRIVE) HEAVY COMMERCIAL VEHICLE IN TORQUE VECTORING MARKET, BY TYPE, 2020-2029 (USD MILLION)
TABLE 58 SAUDI ARABIA (LEFT HAND DRIVE) COMMERCIAL VEHICLE IN TORQUE VECTORING MARKET, BY TECHNOLOGY, 2020-2029 (USD MILLION)
TABLE 59 SAUDI ARABIA (LEFT HAND DRIVE) OFF ROAD VEHICLE IN TORQUE VECTORING MARKET, BY TECHNOLOGY, 2020-2029 (USD MILLION)
TABLE 60 SAUDI ARABIA (LEFT HAND DRIVE) TORQUE VECTORING MARKET, BY PROPULSION TYPE, 2020-2029 (USD MILLION)
TABLE 61 SAUDI ARABIA (LEFT HAND DRIVE) ELECTRIC VEHICLE IN TORQUE VECTORING MARKET, BY TECHNOLOGY, 2020-2029 (USD MILLION)
TABLE 62 U.A.E. (LEFT HAND DRIVE) TORQUE VECTORING MARKET, BY COMPONENT, 2020-2029 (USD MILLION)
TABLE 63 U.A.E. (LEFT HAND DRIVE) HARDWARE IN TORQUE VECTORING MARKET, BY TYPE, 2020-2029 (USD MILLION)
TABLE 64 U.A.E. (LEFT HAND DRIVE) TORQUE VECTORING MARKET, BY TECHNOLOGY, 2020-2029 (USD MILLION)
TABLE 65 U.A.E. (LEFT HAND DRIVE) TORQUE VECTORING MARKET, BY CLUTCH ACTUATION TYPE, 2020-2029 (USD MILLION)
TABLE 66 U.A.E. (LEFT HAND DRIVE) TORQUE VECTORING MARKET, BY DRIVING WHEEL TYPE, 2020-2029 (USD MILLION)
TABLE 67 U.A.E. (LEFT HAND DRIVE) TORQUE VECTORING MARKET, BY VEHICLE TYPE, 2020-2029 (USD MILLION)
TABLE 68 U.A.E. (LEFT HAND DRIVE) PASSENGER CARS IN TORQUE VECTORING MARKET, BY TYPE, 2020-2029 (USD MILLION)
TABLE 69 U.A.E. (LEFT HAND DRIVE) PASSENGER CARS IN TORQUE VECTORING MARKET, BY TECHNOLOGY, 2020-2029 (USD MILLION)
TABLE 70 U.A.E. (LEFT HAND DRIVE) COMMERCIAL VEHICLE IN TORQUE VECTORING MARKET, BY TYPE, 2020-2029 (USD MILLION)
TABLE 71 U.A.E. (LEFT HAND DRIVE) HEAVY COMMERCIAL VEHICLE IN TORQUE VECTORING MARKET, BY TYPE, 2020-2029 (USD MILLION)
TABLE 72 U.A.E. (LEFT HAND DRIVE) COMMERCIAL VEHICLE IN TORQUE VECTORING MARKET, BY TECHNOLOGY, 2020-2029 (USD MILLION)
TABLE 73 U.A.E. (LEFT HAND DRIVE) OFF ROAD VEHICLE IN TORQUE VECTORING MARKET, BY TECHNOLOGY, 2020-2029 (USD MILLION)
TABLE 74 U.A.E. (LEFT HAND DRIVE) TORQUE VECTORING MARKET, BY PROPULSION TYPE, 2020-2029 (USD MILLION)
TABLE 75 U.A.E. (LEFT HAND DRIVE) ELECTRIC VEHICLE IN TORQUE VECTORING MARKET, BY TECHNOLOGY, 2020-2029 (USD MILLION)
TABLE 76 SOUTH AFRICA (RIGHT HAND DRIVE) TORQUE VECTORING MARKET, BY COMPONENT, 2020-2029 (USD MILLION)
TABLE 77 SOUTH AFRICA (RIGHT HAND DRIVE) HARDWARE IN TORQUE VECTORING MARKET, BY TYPE, 2020-2029 (USD MILLION)
TABLE 78 SOUTH AFRICA (RIGHT HAND DRIVE) TORQUE VECTORING MARKET, BY TECHNOLOGY, 2020-2029 (USD MILLION)
TABLE 79 SOUTH AFRICA (RIGHT HAND DRIVE) TORQUE VECTORING MARKET, BY CLUTCH ACTUATION TYPE, 2020-2029 (USD MILLION)
TABLE 80 SOUTH AFRICA (RIGHT HAND DRIVE) TORQUE VECTORING MARKET, BY DRIVING WHEEL TYPE, 2020-2029 (USD MILLION)
TABLE 81 SOUTH AFRICA (RIGHT HAND DRIVE) TORQUE VECTORING MARKET, BY VEHICLE TYPE, 2020-2029 (USD MILLION)
TABLE 82 SOUTH AFRICA (RIGHT HAND DRIVE) PASSENGER CARS IN TORQUE VECTORING MARKET, BY TYPE, 2020-2029 (USD MILLION)
TABLE 83 SOUTH AFRICA (RIGHT HAND DRIVE) PASSENGER CARS IN TORQUE VECTORING MARKET, BY TECHNOLOGY, 2020-2029 (USD MILLION)
TABLE 84 SOUTH AFRICA (RIGHT HAND DRIVE) COMMERCIAL VEHICLE IN TORQUE VECTORING MARKET, BY TYPE, 2020-2029 (USD MILLION)
TABLE 85 SOUTH AFRICA (RIGHT HAND DRIVE) HEAVY COMMERCIAL VEHICLE IN TORQUE VECTORING MARKET, BY TYPE, 2020-2029 (USD MILLION)
TABLE 86 SOUTH AFRICA (RIGHT HAND DRIVE) COMMERCIAL VEHICLE IN TORQUE VECTORING MARKET, BY TECHNOLOGY, 2020-2029 (USD MILLION)
TABLE 87 SOUTH AFRICA (RIGHT HAND DRIVE) OFF ROAD VEHICLE IN TORQUE VECTORING MARKET, BY TECHNOLOGY, 2020-2029 (USD MILLION)
TABLE 88 SOUTH AFRICA (RIGHT HAND DRIVE) TORQUE VECTORING MARKET, BY PROPULSION TYPE, 2020-2029 (USD MILLION)
TABLE 89 SOUTH AFRICA (RIGHT HAND DRIVE) ELECTRIC VEHICLE IN TORQUE VECTORING MARKET, BY TECHNOLOGY, 2020-2029 (USD MILLION)
TABLE 90 EGYPT (LEFT HAND DRIVE) TORQUE VECTORING MARKET, BY COMPONENT, 2020-2029 (USD MILLION)
TABLE 91 EGYPT (LEFT HAND DRIVE) HARDWARE IN TORQUE VECTORING MARKET, BY TYPE, 2020-2029 (USD MILLION)
TABLE 92 EGYPT (LEFT HAND DRIVE) TORQUE VECTORING MARKET, BY TECHNOLOGY, 2020-2029 (USD MILLION)
TABLE 93 EGYPT (LEFT HAND DRIVE) TORQUE VECTORING MARKET, BY CLUTCH ACTUATION TYPE, 2020-2029 (USD MILLION)
TABLE 94 EGYPT (LEFT HAND DRIVE) TORQUE VECTORING MARKET, BY DRIVING WHEEL TYPE, 2020-2029 (USD MILLION)
TABLE 95 EGYPT (LEFT HAND DRIVE) TORQUE VECTORING MARKET, BY VEHICLE TYPE, 2020-2029 (USD MILLION)
TABLE 96 EGYPT (LEFT HAND DRIVE) PASSENGER CARS IN TORQUE VECTORING MARKET, BY TYPE, 2020-2029 (USD MILLION)
TABLE 97 EGYPT (LEFT HAND DRIVE) PASSENGER CARS IN TORQUE VECTORING MARKET, BY TECHNOLOGY, 2020-2029 (USD MILLION)
TABLE 98 EGYPT (LEFT HAND DRIVE) COMMERCIAL VEHICLE IN TORQUE VECTORING MARKET, BY TYPE, 2020-2029 (USD MILLION)
TABLE 99 EGYPT (LEFT HAND DRIVE) HEAVY COMMERCIAL VEHICLE IN TORQUE VECTORING MARKET, BY TYPE, 2020-2029 (USD MILLION)
TABLE 100 EGYPT (LEFT HAND DRIVE) COMMERCIAL VEHICLE IN TORQUE VECTORING MARKET, BY TECHNOLOGY, 2020-2029 (USD MILLION)
TABLE 101 EGYPT (LEFT HAND DRIVE) OFF ROAD VEHICLE IN TORQUE VECTORING MARKET, BY TECHNOLOGY, 2020-2029 (USD MILLION)
TABLE 102 EGYPT (LEFT HAND DRIVE) TORQUE VECTORING MARKET, BY PROPULSION TYPE, 2020-2029 (USD MILLION)
TABLE 103 EGYPT (LEFT HAND DRIVE) ELECTRIC VEHICLE IN TORQUE VECTORING MARKET, BY TECHNOLOGY, 2020-2029 (USD MILLION)
TABLE 104 ISRAEL (LEFT HAND DRIVE) TORQUE VECTORING MARKET, BY COMPONENT, 2020-2029 (USD MILLION)
TABLE 105 ISRAEL (LEFT HAND DRIVE) HARDWARE IN TORQUE VECTORING MARKET, BY TYPE, 2020-2029 (USD MILLION)
TABLE 106 ISRAEL (LEFT HAND DRIVE) TORQUE VECTORING MARKET, BY TECHNOLOGY, 2020-2029 (USD MILLION)
TABLE 107 ISRAEL (LEFT HAND DRIVE) TORQUE VECTORING MARKET, BY CLUTCH ACTUATION TYPE, 2020-2029 (USD MILLION)
TABLE 108 ISRAEL (LEFT HAND DRIVE) TORQUE VECTORING MARKET, BY DRIVING WHEEL TYPE, 2020-2029 (USD MILLION)
TABLE 109 ISRAEL (LEFT HAND DRIVE) TORQUE VECTORING MARKET, BY VEHICLE TYPE, 2020-2029 (USD MILLION)
TABLE 110 ISRAEL (LEFT HAND DRIVE) PASSENGER CARS IN TORQUE VECTORING MARKET, BY TYPE, 2020-2029 (USD MILLION)
TABLE 111 ISRAEL (LEFT HAND DRIVE) PASSENGER CARS IN TORQUE VECTORING MARKET, BY TECHNOLOGY, 2020-2029 (USD MILLION)
TABLE 112 ISRAEL (LEFT HAND DRIVE) COMMERCIAL VEHICLE IN TORQUE VECTORING MARKET, BY TYPE, 2020-2029 (USD MILLION)
TABLE 113 ISRAEL (LEFT HAND DRIVE) HEAVY COMMERCIAL VEHICLE IN TORQUE VECTORING MARKET, BY TYPE, 2020-2029 (USD MILLION)
TABLE 114 ISRAEL (LEFT HAND DRIVE) COMMERCIAL VEHICLE IN TORQUE VECTORING MARKET, BY TECHNOLOGY, 2020-2029 (USD MILLION)
TABLE 115 ISRAEL (LEFT HAND DRIVE) OFF ROAD VEHICLE IN TORQUE VECTORING MARKET, BY TECHNOLOGY, 2020-2029 (USD MILLION)
TABLE 116 ISRAEL (LEFT HAND DRIVE) TORQUE VECTORING MARKET, BY PROPULSION TYPE, 2020-2029 (USD MILLION)
TABLE 117 ISRAEL (LEFT HAND DRIVE) ELECTRIC VEHICLE IN TORQUE VECTORING MARKET, BY TECHNOLOGY, 2020-2029 (USD MILLION)
TABLE 118 KUWAIT (LEFT HAND DRIVE) TORQUE VECTORING MARKET, BY COMPONENT, 2020-2029 (USD MILLION)
TABLE 119 KUWAIT (LEFT HAND DRIVE) HARDWARE IN TORQUE VECTORING MARKET, BY TYPE, 2020-2029 (USD MILLION)
TABLE 120 KUWAIT (LEFT HAND DRIVE) TORQUE VECTORING MARKET, BY TECHNOLOGY, 2020-2029 (USD MILLION)
TABLE 121 KUWAIT (LEFT HAND DRIVE) TORQUE VECTORING MARKET, BY CLUTCH ACTUATION TYPE, 2020-2029 (USD MILLION)
TABLE 122 KUWAIT (LEFT HAND DRIVE) TORQUE VECTORING MARKET, BY DRIVING WHEEL TYPE, 2020-2029 (USD MILLION)
TABLE 123 KUWAIT (LEFT HAND DRIVE) TORQUE VECTORING MARKET, BY VEHICLE TYPE, 2020-2029 (USD MILLION)
TABLE 124 KUWAIT (LEFT HAND DRIVE) PASSENGER CARS IN TORQUE VECTORING MARKET, BY TYPE, 2020-2029 (USD MILLION)
TABLE 125 KUWAIT (LEFT HAND DRIVE) PASSENGER CARS IN TORQUE VECTORING MARKET, BY TECHNOLOGY, 2020-2029 (USD MILLION)
TABLE 126 KUWAIT (LEFT HAND DRIVE) COMMERCIAL VEHICLE IN TORQUE VECTORING MARKET, BY TYPE, 2020-2029 (USD MILLION)
TABLE 127 KUWAIT (LEFT HAND DRIVE) HEAVY COMMERCIAL VEHICLE IN TORQUE VECTORING MARKET, BY TYPE, 2020-2029 (USD MILLION)
TABLE 128 KUWAIT (LEFT HAND DRIVE) COMMERCIAL VEHICLE IN TORQUE VECTORING MARKET, BY TECHNOLOGY, 2020-2029 (USD MILLION)
TABLE 129 KUWAIT (LEFT HAND DRIVE) OFF ROAD VEHICLE IN TORQUE VECTORING MARKET, BY TECHNOLOGY, 2020-2029 (USD MILLION)
TABLE 130 KUWAIT (LEFT HAND DRIVE) TORQUE VECTORING MARKET, BY PROPULSION TYPE, 2020-2029 (USD MILLION)
TABLE 131 KUWAIT (LEFT HAND DRIVE) ELECTRIC VEHICLE IN TORQUE VECTORING MARKET, BY TECHNOLOGY, 2020-2029 (USD MILLION)
TABLE 132 REST OF MIDDLE EAST AND AFRICA TORQUE VECTORING MARKET, BY COMPONENT, 2020-2029 (USD MILLION)
List of Figure
FIGURE 1 MIDDLE EAST & AFRICA TORQUE VECTORING MARKET: SEGMENTATION
FIGURE 2 MIDDLE EAST & AFRICA TORQUE VECTORING MARKET: DATA TRIANGULATION
FIGURE 3 MIDDLE EAST & AFRICA TORQUE VECTORING MARKET: DROC ANALYSIS
FIGURE 4 MIDDLE EAST & AFRICA TORQUE VECTORING MARKET: MIDDLE EAST & AFRICA VS REGIONAL ANALYSIS
FIGURE 5 MIDDLE EAST & AFRICA TORQUE VECTORING MARKET: COMPANY RESEARCH ANALYSIS
FIGURE 6 MIDDLE EAST & AFRICA TORQUE VECTORING MARKET: INTERVIEW DEMOGRAPHICS
FIGURE 7 MIDDLE EAST & AFRICA TORQUE VECTORING MARKET: DBMRMARKET POSITION GRID
FIGURE 8 MIDDLE EAST & AFRICA TORQUE VECTORING MARKET: VENDOR SHARE ANALYSIS
FIGURE 9 MIDDLE EAST & AFRICA TORQUE VECTORING MARKET: SEGMENTATION
FIGURE 10 INTELLIGENT TORQUE VECTORING APPROACH FOR ADAS VEHICLES IS EXPECTED TO DRIVE MIDDLE EAST & AFRICA TORQUE VECTORING MARKET IN THE FORECAST PERIOD OF 2022 TO 2029
FIGURE 11 HARDWARE SEGMENT IS EXPECTED TO ACCOUNT FOR THE LARGEST SHARE OF MIDDLE EAST & AFRICA TORQUE VECTORING MARKET IN 2022 & 2029
FIGURE 12 NORTH AMERICA IS EXPECTED TO DOMINATE AND ASIA-PACIFIC IS THE FASTEST GROWING REGION IN THE MIDDLE EAST & AFRICA TORQUE VECTORING MARKET IN THE FORECAST PERIOD OF 2022 TO 2029
FIGURE 13 DRIVERS, RESTRAINTS, OPPORTUNITIES, AND CHALLENGES OF THE MIDDLE EAST & AFRICA TORQUE VECTORING MARKET
FIGURE 14 PERCENTAGE OF URABANIZATION ACROSS THE GLOBE
FIGURE 15 AVAILABILITY OF ADAS TECHNOLOGY IN NEW VEHICLE MODELS
FIGURE 16 ROAD TRANSPORT EMISSIONS
FIGURE 17 MIDDLE EAST & AFRICA TORQUE VECTORING MARKET: BY COMPONENT, 2021
FIGURE 18 MIDDLE EAST & AFRICA TORQUE VECTORING MARKET: BY TECHNOLOGY, 2021
FIGURE 19 MIDDLE EAST & AFRICA TORQUE VECTORING MARKET: BY CLUTCH ACTUATION TYPE, 2021
FIGURE 20 MIDDLE EAST & AFRICA TORQUE VECTORING MARKET: BY DRIVING WHEEL TYPE, 2021
FIGURE 21 MIDDLE EAST & AFRICA TORQUE VECTORING MARKET: BY VEHICLE TYPE, 2021
FIGURE 22 MIDDLE EAST & AFRICA TORQUE VECTORING MARKET: BY PROPULSION TYPE, 2021
FIGURE 23 MIDDLE EAST AND AFRICA TORQUE VECTORING MARKET: SNAPSHOT (2021)
FIGURE 24 MIDDLE EAST AND AFRICA TORQUE VECTORING MARKET: BY COUNTRY (2021)
FIGURE 25 MIDDLE EAST AND AFRICA TORQUE VECTORING MARKET: BY COUNTRY (2022 & 2029)
FIGURE 26 MIDDLE EAST AND AFRICA TORQUE VECTORING MARKET: BY COUNTRY (2021 & 2029)
FIGURE 27 MIDDLE EAST AND AFRICA TORQUE VECTORING MARKET: BY COMPONENT (2022-2029)
FIGURE 28 MIDDLE EAST & AFRICA TORQUE VECTORING MARKET: COMPANY SHARE 2021 (%)
Data collection and base year analysis are done using data collection modules with large sample sizes. The stage includes obtaining market information or related data through various sources and strategies. It includes examining and planning all the data acquired from the past in advance. It likewise envelops the examination of information inconsistencies seen across different information sources. The market data is analysed and estimated using market statistical and coherent models. Also, market share analysis and key trend analysis are the major success factors in the market report. To know more, please request an analyst call or drop down your inquiry.
The key research methodology used by DBMR research team is data triangulation which involves data mining, analysis of the impact of data variables on the market and primary (industry expert) validation. Data models include Vendor Positioning Grid, Market Time Line Analysis, Market Overview and Guide, Company Positioning Grid, Patent Analysis, Pricing Analysis, Company Market Share Analysis, Standards of Measurement, Global versus Regional and Vendor Share Analysis. To know more about the research methodology, drop in an inquiry to speak to our industry experts.
Data Bridge Market Research is a leader in advanced formative research. We take pride in servicing our existing and new customers with data and analysis that match and suits their goal. The report can be customized to include price trend analysis of target brands understanding the market for additional countries (ask for the list of countries), clinical trial results data, literature review, refurbished market and product base analysis. Market analysis of target competitors can be analyzed from technology-based analysis to market portfolio strategies. We can add as many competitors that you require data about in the format and data style you are looking for. Our team of analysts can also provide you data in crude raw excel files pivot tables (Fact book) or can assist you in creating presentations from the data sets available in the report.


