
Middle East And Africa Vitamin A Market
Market Size in USD Million
 USD
29.06 Million
USD
38.27 Million
2024
2032
USD
29.06 Million
USD
38.27 Million
2024
2032
| 2025 - 2032 | |
| USD 29.06 Million | |
| USD 38.27 Million | |
| % | |
|
Vitamin A Market Size
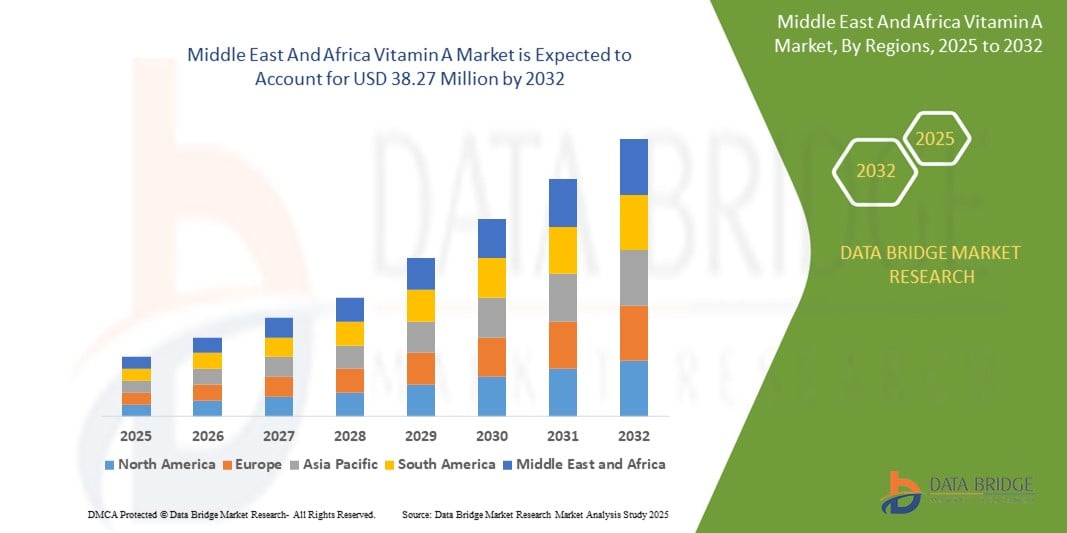
- The Middle East and Africa vitamin A market size was valued at USD 29.06 million in 2024 and is expected to reach USD 38.27 million by 2032, at a CAGR of 3.5% during the forecast period
- The market growth is largely fueled by rising awareness of micronutrient deficiencies and the expanding application of vitamin A across pharmaceuticals, dietary supplements, animal feed, and personal care sectors. Governments and health organizations are increasingly promoting supplementation programs to combat vitamin A deficiency, particularly in developing countries, significantly driving product demand globally
- Furthermore, the growing popularity of fortified foods, clean-label supplements, and vitamin-enriched cosmetic formulations is reinforcing vitamin A’s relevance across industries. These converging factors are accelerating the uptake of vitamin A, thereby significantly boosting the market's expansion across both developed and emerging regions
Vitamin A Market Analysis
- Vitamin A is a fat-soluble compound essential for immune function, vision, reproduction, and cellular health, available in both pre-formed and provitamin forms. It is widely used in pharmaceutical formulations, nutritional supplements, animal feed additives, and cosmetic products to promote health, enhance growth, and support skin rejuvenation
- The increasing demand for vitamin A is primarily driven by the need to address global health challenges related to malnutrition, growing consumption of functional foods, and rising demand for anti-aging skincare products. Regulatory support, technological advancements in production, and expanding health-conscious consumer bases are further strengthening the market trajectory
- South Africa dominated the vitamin A market with a share of 69.4%in 2024, due to high demand from the animal feed industry, widespread use in fortified food programs, and growing health awareness among consumers
- Saudi Arabia is expected to be the fastest growing region in the vitamin A market with a share of during the forecast period due to increasing health awareness, rising demand for fortified foods and skincare products, and government-backed nutrition enhancement programs
- Conventional segment dominated the market with a market share of 63.6% in 2024, due to its longstanding presence in food and pharmaceutical manufacturing and cost-effective production methods. Conventional vitamin A products are widely used in fortification programs and industrial-scale applications where stringent cost control is essential
Report Scope and Vitamin A Market Segmentation
|
Attributes |
Vitamin A Key Market Insights |
|
Segments Covered |
|
|
Countries Covered |
Middle East and Africa
|
|
Key Market Players |
|
|
Market Opportunities |
|
|
Value Added Data Infosets |
In addition to the insights on market scenarios such as market value, growth rate, segmentation, geographical coverage, and major players, the market reports curated by the Data Bridge Market Research also include in-depth expert analysis, pricing analysis, brand share analysis, consumer survey, demography analysis, supply chain analysis, value chain analysis, raw material/consumables overview, vendor selection criteria, PESTLE Analysis, Porter Analysis, and regulatory framework. |
Vitamin A Market Trends
“Rising Prevalence of Vitamin A Deficiency”
- The Middle East and Africa region has one of the highest rates of vitamin A deficiency (VAD) globally, especially among children and pregnant women, leading to increased demand for fortified foods and supplements to combat associated health issues such as vision impairments and compromised immunity
- For instance, countries have launched large-scale government-supported vitamin A supplementation and food fortification programs in partnership with global bodies such as UNICEF and GAIN (Global Alliance for Improved Nutrition) to combat widespread VAD
- Growing health awareness among consumers is leading to increased demand for vitamin A-fortified staples such as edible oil, milk, and infant formula—particularly in urban areas where access to fortified products is rising through modern retail and e-commerce channels
- Food and beverage companies are expanding their fortified product portfolios, focusing on vitamin A integration into ready-to-eat foods, dairy alternatives, and health-focused beverages to address consumer concerns over nutrient gaps
- The rise of preventive healthcare and functional nutrition trends across Middle East and Africa, is pushing demand for vitamin A in dietary supplements, multivitamins, and immunity-boosting products
- Continued investments in public-private partnerships for fighting malnutrition, rising disposable incomes, and an expanding middle class are increasing consumption of value-added, nutrient-dense foods, indirectly boosting the vitamin A market across the region
Vitamin A Market Dynamics
Driver
“Growing Demand from the Various End-User Industries”
- The rising demand for vitamin A spans multiple industries including food & beverage, pharmaceuticals, animal feed, personal care, and dietary supplements, supporting broad-based market growth in Middle East and Africa
- For instance, the booming animal feed sector is utilizing vitamin A extensively to promote livestock health and improve immune function, fueling strong bulk demand across poultry, aquaculture, and dairy production
- Personal care companies are increasingly incorporating retinol (vitamin A derivative) into beauty and skincare formulations due to its proven benefits in anti-aging, acne treatment, and skin repair
- The pharmaceutical sector continues to expand vitamin A use in eye health formulations, pediatric vitamins, dermatology treatments, and healthcare supplements targeting immunity and growth, particularly in urban, aging populations
- Multinational companies such as BASF, DSM, and ZMC Group are expanding their production and distribution networks in the Middle East and Africa region to support rising demand and improve local access to specialty-grade vitamin A products
Restraint/Challenge
“High Cost of Vitamin A”
- Vitamin A production involves complex synthesis and stringent quality control, resulting in high manufacturing costs that can make the end products unaffordable for portions of the population, especially in developing or rural area
- For instance, volatility in key raw materials such as palm oil and beta-ionone, used in vitamin A manufacturing, significantly impacts its market price and supply stability, especially given frequent disruptions in agricultural exports
- Strict regional and global regulatory frameworks demand tight purity, dosage, and safety standards, increasing compliance and operational costs for manufacturers and importers
- Small- and medium-sized enterprises (SMEs) often face technological and financial barriers in adopting cost-effective production processes, limiting local market competition and keeping prices high
- While demand is increasing, affordability remains a barrier in scaling fortification programs or supplement adoption in low-income populations, highlighting the need for government subsidies or donor-backed nutrition programs
Vitamin A Market Scope
The market is segmented on the basis of type, product category, form, and application.
- By Type
On the basis of type, the vitamin A market is segmented into pre-formed vitamin A, provitamin A, and combined vitamin A. The pre-formed vitamin A segment dominated the largest market revenue share in 2024, primarily due to its high bioavailability and widespread use in fortified foods, supplements, and therapeutic formulations. This form, commonly found as retinyl palmitate or retinyl acetate, is directly usable by the human body, making it a preferred option for addressing deficiencies rapidly, especially in developing regions where malnutrition remains a concern. Pre-formed vitamin A is also frequently used in skincare products for its proven benefits in promoting healthy vision and skin regeneration.
The provitamin A segment is projected to witness the fastest growth rate from 2025 to 2032, driven by increasing consumer preference for plant-derived nutrients and the growing demand for natural and vegan-friendly products. Provitamin A, primarily in the form of beta-carotene, is sourced from fruits and vegetables and is widely recognized for its antioxidant properties. The rising trend toward clean-label and plant-based supplements is accelerating the use of provitamin A across dietary supplements, food, and personal care applications.
- By Product Category
On the basis of product category, the vitamin A market is segmented into clean labeled ingredient and conventional. The conventional segment held the largest market revenue share of 63.6% in 2024, owing to its longstanding presence in food and pharmaceutical manufacturing and cost-effective production methods. Conventional vitamin A products are widely used in fortification programs and industrial-scale applications where stringent cost control is essential.
The clean labeled ingredient segment is anticipated to grow at the fastest pace from 2025 to 2032, propelled by rising consumer awareness about product transparency, traceability, and health consciousness. As more consumers seek additives that are minimally processed and derived from natural sources, clean label vitamin A—especially sourced from plant carotenoids or produced through fermentation—is gaining significant traction in premium product formulations across food, cosmetics, and supplements.
- By Form
On the basis of form, the vitamin A market is segmented into powder and liquid. The powder segment accounted for the largest revenue share in 2024 due to its longer shelf life, ease of transport, and wide applicability in food fortification, animal feed, and pharmaceutical formulations. Powdered vitamin A is often microencapsulated for stability and can be easily blended into dry mixes, offering manufacturers high flexibility in end-product design.
The liquid segment is expected to register the fastest growth rate from 2025 to 2032, supported by its high absorption efficiency and rising demand in personal care and cosmetic formulations. Liquid vitamin A is particularly preferred in serums, emulsions, and functional beverages where rapid absorption and precise dosing are critical. The growing popularity of liquid nutraceuticals and cosmetic oils is also contributing to the segment's growth.
- By Application
On the basis of application, the vitamin A market is segmented into pharmaceuticals, food products, animal feed, personal care & cosmetics, dietary supplements, beverages, and others. The animal feed segment dominated the market in 2024, accounting for the largest revenue share, driven by the essential role of vitamin A in livestock health, reproduction, and growth. Vitamin A supplementation is a standard in poultry, swine, and cattle feed, where deficiencies can lead to reduced productivity and increased susceptibility to disease.
The personal care & cosmetics segment is expected to witness the fastest CAGR from 2025 to 2032, fueled by the rising demand for anti-aging and skin-enhancing formulations. Vitamin A derivatives, such as retinol and retinoic acid, are well-regarded for promoting cell turnover, reducing wrinkles, and improving skin texture. The increasing consumer focus on wellness and skincare, along with the incorporation of vitamin A into clean and natural beauty products, is significantly boosting its usage in this segment.
Vitamin A Market Regional Analysis
- South Africa dominated the vitamin A market with the largest revenue share of 69.4% in 2024, driven by high demand from the animal feed industry, widespread use in fortified food programs, and growing health awareness among consumers
- The market is seeing consistent growth due to increased government-led nutritional interventions, rising prevalence of vitamin A deficiency, and expanding use of dietary supplements and pharmaceutical-grade vitamins in healthcare
- South Africa's well-developed agricultural and healthcare sectors, combined with its established distribution networks, have positioned the country as a leading hub for vitamin A consumption and formulation within the region
Saudi Arabia Vitamin A Market Insight
Saudi Arabia is projected to register the fastest CAGR in the Middle East and Africa vitamin A market from 2025 to 2032. This growth is fueled by increasing health awareness, rising demand for fortified foods and skincare products, and government-backed nutrition enhancement programs. The country’s growing investments in healthcare infrastructure, regulatory support for supplementation, and expanding pharmaceutical and cosmetic industries are driving sustained demand for high-quality vitamin A formulations
U.A.E. Vitamin A Market Insight
The U.A.E. is emerging as a key growth market, driven by rising consumer interest in wellness, increased use of dietary supplements, and a booming cosmetics sector that heavily incorporates vitamin A derivatives. High-income consumer segments, an expanding retail and healthcare network, and strong demand for premium nutraceutical and personal care products are supporting the market's growth. The country's commitment to modern healthcare and nutrition standards enhances its potential as a leading vitamin A market in the Gulf region
Vitamin A Market Share
The vitamin A industry is primarily led by well-established companies, including:
- DSM (Netherlands)
- BASF (Germany)
- Lonza Group (Switzerland)
- Glanbia Plc (Ireland)
- ADM (U.S.)
- Farbest Brands (U.S.)
- SternVitamin GmbH & Co. KG (Germany)
- Adisseo (France)
- BTSA Biotechnologias Aplicadas S.L. (Spain)
- Rabar Pty Ltd (Australia)
- Zagro (Singapore)
- Wright Enrichment Inc. (U.S.)
- Adisseo (China)
- Showa Denko K.K. (Japan)
- Farbest Brands (U.S.)
- Jubilant Life Sciences Ltd. (India)
- Vertellus Holdings LLC (U.S.)
Latest Developments in Middle East and Africa Vitamin A Market
- In December 2024, the Health Department in Kanpur launched a month-long vitamin A supplementation program targeting approximately 468,000 children aged nine months to five years. The initiative, inaugurated by Chief Medical Officer Dr. Alok Ranjan and supported by District Immunisation Officer Dr. U.B. Singh, reflects growing governmental emphasis on preventive healthcare and child nutrition. This large-scale public health campaign is expected to drive increased demand for pharmaceutical-grade vitamin A formulations, strengthening market growth at the regional level and reinforcing the role of supplements in combating micronutrient deficiencies
- In 2023, Tri Tito Karnavian, Chair of the Family Welfare Empowerment Mobilization Team (TP-PKK), launched a crucial initiative to distribute vitamin A supplements to children aged 6 to 59 months in Southwest Papua Province. Conducted on a Wednesday, the program highlights a strong commitment to improving child nutrition and public health in the region
- In June 2022, the world’s first bio-based vitamin A entered application testing with cosmetics manufacturers, following a major scientific advancement by DSM. This breakthrough marks a significant step for the cosmetics sector, providing a sustainable and innovative alternative to conventional vitamin A sources
- In 2022, BASF expanded its large-scale vitamin A formulation facility in Ludwigshafen, Germany. This expansion was strategically implemented to boost production capabilities and meet the rising global demand for vitamin A across multiple end-use industries
- In February 2020, DSM invested in a fully automated, high-tech packing line for vitamin A production. This move enhanced product traceability, quality, and reliability, reinforcing the company’s market leadership and strengthening its position in meeting stringent customer demands globally
SKU-

- Interactive Data Analysis Dashboard
- Company Analysis Dashboard for high growth potential opportunities
- Research Analyst Access for customization & queries
- Competitor Analysis with Interactive dashboard
- Latest News, Updates & Trend analysis
- Harness the Power of Benchmark Analysis for Comprehensive Competitor Tracking
Middle East And Africa Vitamin A Market, Supply Chain Analysis and Ecosystem Framework
To support market growth and help clients navigate the impact of geopolitical shifts, DBMR has integrated in-depth supply chain analysis into its Middle East And Africa Vitamin A Market research reports. This addition empowers clients to respond effectively to global changes affecting their industries. The supply chain analysis section includes detailed insights such as Middle East And Africa Vitamin A Market consumption and production by country, price trend analysis, the impact of tariffs and geopolitical developments, and import and export trends by country and HSN code. It also highlights major suppliers with data on production capacity and company profiles, as well as key importers and exporters. In addition to research, DBMR offers specialized supply chain consulting services backed by over a decade of experience, providing solutions like supplier discovery, supplier risk assessment, price trend analysis, impact evaluation of inflation and trade route changes, and comprehensive market trend analysis.
Data collection and base year analysis are done using data collection modules with large sample sizes. The stage includes obtaining market information or related data through various sources and strategies. It includes examining and planning all the data acquired from the past in advance. It likewise envelops the examination of information inconsistencies seen across different information sources. The market data is analysed and estimated using market statistical and coherent models. Also, market share analysis and key trend analysis are the major success factors in the market report. To know more, please request an analyst call or drop down your inquiry.
The key research methodology used by DBMR research team is data triangulation which involves data mining, analysis of the impact of data variables on the market and primary (industry expert) validation. Data models include Vendor Positioning Grid, Market Time Line Analysis, Market Overview and Guide, Company Positioning Grid, Patent Analysis, Pricing Analysis, Company Market Share Analysis, Standards of Measurement, Global versus Regional and Vendor Share Analysis. To know more about the research methodology, drop in an inquiry to speak to our industry experts.
Data Bridge Market Research is a leader in advanced formative research. We take pride in servicing our existing and new customers with data and analysis that match and suits their goal. The report can be customized to include price trend analysis of target brands understanding the market for additional countries (ask for the list of countries), clinical trial results data, literature review, refurbished market and product base analysis. Market analysis of target competitors can be analyzed from technology-based analysis to market portfolio strategies. We can add as many competitors that you require data about in the format and data style you are looking for. Our team of analysts can also provide you data in crude raw excel files pivot tables (Fact book) or can assist you in creating presentations from the data sets available in the report.


