
Middle East Dredging Market
Market Size in USD Million
 USD
1.80 Million
USD
2.20 Million
2024
2032
USD
1.80 Million
USD
2.20 Million
2024
2032
| 2025 - 2032 | |
| USD 1.80 Million | |
| USD 2.20 Million | |
| % | |
|
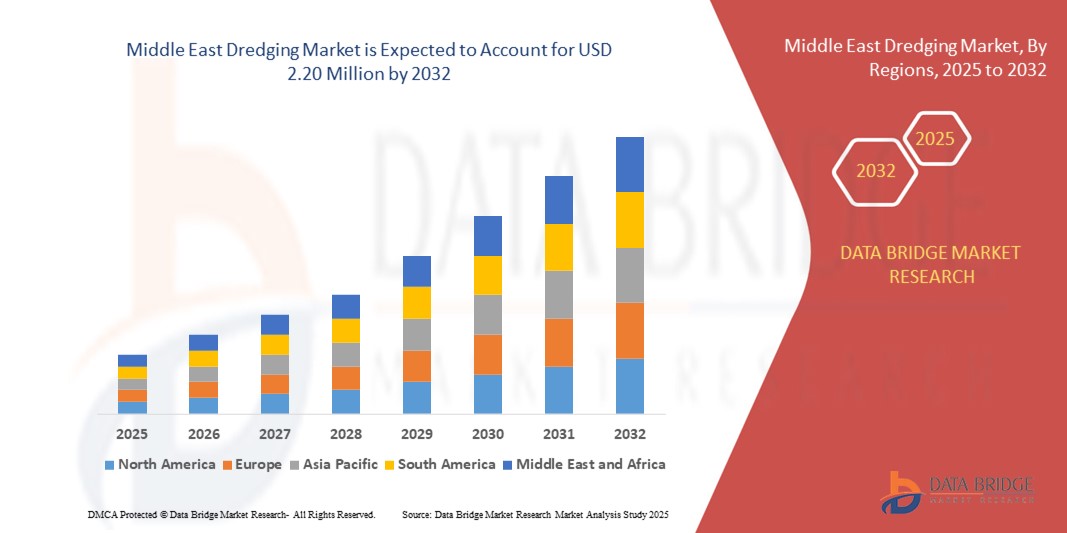
What is the Middle East Dredging Market Size and Growth Rate?
- The Middle East dredging market size was valued at USD 1.80 million in 2024 and is expected to reach USD 2.20 million by 2032, at a CAGR of2.50% during the forecast period
- Rapid growth in mining activities across the region with rising demand for efficient and cost-effective solutions are the major factors driving the market growth. Government funding propelling the growth of dredging initiatives will further aggravate the market growth
- Moreover, infrastructure dredging is on the upswing due to the growth of energy and oil & gas sectors, which is further bolstering the market growth. However, stringent government regulations related to environmental safety are restraining the market growth
What are the Major Takeaways of Middle East Dredging Market?
- The Middle East dredging market is currently experiencing a notable rise in mining activities, indicating a rapid and substantial market expansion across the region. This robust growth can be attributed to the increasing demand for dredging services and associated activities. The Middle East region is witnessing a significant increase in dredging operations, indicating a thriving industry that extends beyond local borders
- U.A.E. is projected to dominate the Middle East dredging market with a revenue share of 41.87% in 2024, driven by extensive port expansion projects, artificial island developments, and coastal protection initiatives such as the Palm Jebel Ali and Khalifa Port expansions
- Saudi Arabia is expected to register the fastest CAGR of 7.24% from 2025 to 2032, supported by mega-projects under Vision 2030 such as NEOM, the Red Sea Project, and Jeddah Islamic Port expansion
- Hydraulic Dredgers dominated the market with 41.6% of revenue in 2024, driven by large-scale applications in port deepening and land reclamation projects
Report Scope and Middle East Dredging Market Segmentation
|
Attributes |
Middle East Dredging Key Market Insights |
|
Segments Covered |
|
|
Countries Covered |
Middle East
|
|
Key Market Players |
|
|
Market Opportunities |
|
|
Value Added Data Infosets |
In addition to the insights on market scenarios such as market value, growth rate, segmentation, geographical coverage, and major players, the market reports curated by the Data Bridge Market Research also include in-depth expert analysis, pricing analysis, brand share analysis, consumer survey, demography analysis, supply chain analysis, value chain analysis, raw material/consumables overview, vendor selection criteria, PESTLE Analysis, Porter Analysis, and regulatory framework. |
What is the Key Trend in the Middle East Dredging Market?
Sustainable and Technologically Advanced Dredging Solutions Driving Market Transformation
- A key trend in the global dredging market is the increasing shift toward eco-friendly dredging techniques and automation-driven solutions to minimize environmental impact while enhancing operational efficiency
- Manufacturers are adopting advanced GPS, LiDAR, and IoT-enabled monitoring systems to ensure precision dredging, reduce fuel consumption, and comply with stricter marine environmental regulations
- For instance, in 2024, Van Oord (Netherlands) introduced a fully electric trailing suction hopper dredger to cut carbon emissions by 20%, setting a benchmark for sustainable marine operations
- Hydrodynamic dredging methods and sediment recycling technologies are gaining momentum to support coastal resilience projects, land reclamation, and renewable energy infrastructure
- Companies such as Boskalis (Netherlands) and DEME (Belgium) are heavily investing in hybrid propulsion systems and biofuels to align with global decarbonization targets
- This trend is steering the dredging industry toward green maritime practices, enabling projects to balance economic growth with environmental stewardship while meeting global ESG objectives
What are the Key Drivers of Middle East Dredging Market?
- Rising global trade activities and port expansions are driving demand for dredging to maintain navigable waterways and accommodate larger vessels
- In January 2024, Jan De Nul (Belgium) deployed its next-gen cutter suction dredger for a deep-water port expansion in India, highlighting growing investments in maritime infrastructure
- Urban development and land reclamation projects, particularly in Asia-Pacific and the Middle East, are boosting demand for dredging services to create new residential, commercial, and industrial zones
- The rapid growth of offshore wind farms and oil & gas exploration is fueling the need for seabed preparation, pipeline trenching, and foundation stabilization
- Government initiatives promoting coastal protection and climate adaptation are increasing investment in dredging for flood control, beach nourishment, and wetland restoration
- Together, these factors are establishing dredging as a critical enabler of global trade, energy security, and climate resilience, ensuring steady market growth over the coming decade
Which Factor is challenging the Growth of the Middle East Dredging Market?
- A major challenge for the dredging market is the high capital expenditure required for advanced dredgers, coupled with rising fuel and maintenance costs
- For instance, several small contractors in Southeast Asia postponed fleet upgrades in 2023 due to rising costs of hybrid propulsion systems and Tier III-compliant engines
- Environmental concerns and stringent regulations on sediment disposal, noise emissions, and marine biodiversity protection increase project complexities and timelines
- Volatility in raw material prices for dredger components (steel, hydraulic systems) and disruptions in global supply chains further strain operational budgets
- Shortages of skilled personnel and safety compliance challenges, particularly in deep-water and offshore operations, hinder efficient project execution
- Overcoming these challenges will require collaborative regulatory frameworks, R&D investment in cost-effective green technologies, and capacity building to create a resilient, future-ready dredging industry
How is the Middle East Dredging Market Segmented?
The market is segmented on the basis of product type, technology, and end-use industry.
- By Offering
The Dredging market is segmented into Mechanical Dredgers, Hydraulic Dredgers, Mechanical/Hydraulic Dredgers, Hydrodynamic Dredgers, and Auxiliary Equipment. Hydraulic Dredgers dominated the market with 41.6% of revenue in 2024, driven by large-scale applications in port deepening and land reclamation projects. Mechanical Dredgers are widely used in confined waterways due to their precision in handling coarse materials. Hydrodynamic Dredgers are gaining traction for eco-friendly sediment management, minimizing turbidity and environmental disruption
Hydrodynamic Dredgers are projected to grow fastest as regulatory bodies push for sustainable dredging practices worldwide.
- By Service Type
The market is divided into Maintenance Dredging, Capital Dredging, and Remedial Dredging. Maintenance Dredging led with 46.8% of revenue in 2024, as ports and rivers require regular sediment removal to sustain navigability. Capital Dredging is accelerating due to port expansions, industrial corridors, and urban waterfront developments. Remedial Dredging, though smaller in scale, is critical for environmental restoration and contamination removal.
Capital Dredging is expected to grow fastest due to rising global trade and megaproject developments. Government funding and public-private partnerships are increasing investments in long-term maintenance cycles.
- By Material
The market is categorized into Sandy & Gravel, Clay & Slit, Rock, and Others. Sandy & Gravel dominated with 38.5% share in 2024, driven by demand for beach nourishment and land reclamation. Clay & Slit materials are widely targeted in river and lake dredging to maintain water flow and reduce flood risks. Rock dredging is gaining momentum due to offshore energy projects requiring deep seabed interventions.
Rock dredging is projected to grow fastest as deep-water mining and energy infrastructure expand. Advanced cutting equipment is reducing operational challenges in rocky and mixed-material environments.
- By Dredging Depth
The market is segmented into Shallow Water Dredging and Deep Water Dredging. Shallow Water Dredging led with 57.2% of revenue in 2024, supported by inland waterways, ports, and coastal protection projects. Deep Water Dredging is crucial for offshore oil, gas, and renewable energy developments, often requiring advanced vessels. Technological advancements are improving efficiency in deep-sea excavation and sediment transport. Shallow water operations remain cost-effective and accessible for regional governments and private operators.
Deep Water Dredging is expected to grow fastest as global demand for subsea resources intensifies. Climate resilience initiatives are increasing demand for shallow dredging to prevent coastal erosion.
- By Area of Operation
The market includes Sea, Harbour, River, Lakes & Canals, and Others. The Sea segment dominated with 34.9% share in 2024, driven by offshore wind farms and subsea pipeline construction. Harbour dredging supports global shipping by enabling larger vessels to dock safely. Rivers and canals play a vital role in inland trade and flood prevention, fueling steady demand. Lake dredging aids water quality restoration and recreational developments.
The Harbour segment is expected to grow rapidly with modernization of trade hubs worldwide. Specialized vessels are increasingly designed to operate across multiple environments.
- By Transportation Mode
The market is divided into Pipeline and Barges. Pipelines led with 61.4% share in 2024, favored for long-distance sediment transport in large-scale projects. Barges are essential for rocky terrains and deep-sea applications where pipelines are impractical. Hybrid systems combining pipelines and barges are becoming more common for operational flexibility. Innovations in sediment pumping technology are improving pipeline efficiency and reducing fuel costs.
Pipeline transport is projected to maintain dominance due to cost advantages and scalability. Barge systems remain critical for remote and island developments with limited infrastructure.
- By Deployment
The market is segmented into Offshore and Onshore. Offshore dredging accounted for 55.8% of revenue in 2024, driven by oil & gas, offshore wind, and subsea mining activities. Onshore dredging is widely used for urban development, flood control, and agricultural irrigation systems. Offshore operations require advanced, high-capacity dredgers, increasing capital intensity. Onshore projects are adopting modular equipment to reduce costs and improve mobility. Government initiatives for renewable energy are strengthening offshore dredging demand.
Onshore dredging is projected to grow steadily with smart city and coastal protection programs.
- By Application
The market is segmented into Urban Development, Trade Activity, Trade Maintenance, Coastal Protection, Energy Infrastructure, Land Reclamation, and Leisure. Trade Maintenance dominated with 29.7% share in 2024, ensuring navigability for global shipping routes. Urban Development projects are leveraging dredging to create waterfronts and real estate zones. Coastal Protection is gaining momentum due to rising sea levels and storm surges. Energy Infrastructure, particularly offshore wind farms, is driving specialized dredging services.
Land Reclamation is expanding rapidly in Asia-Pacific to address population growth. Leisure applications, including marinas and tourism zones, contribute to niche market growth.
- By End-User
The market is divided into Oil & Gas, Metal & Mining, Renewables, Government, Food & Agriculture, and Others. Government projects dominated with 36.4% share in 2024, backed by public funding for ports and flood management. Oil & Gas operations demand deep-water dredging for subsea installations. Renewables, especially offshore wind, are emerging as high-growth contributors. Metal & Mining uses dredging for underwater mineral extraction and tailings management. Food & Agriculture relies on dredging for irrigation channels and aquaculture expansion.
Renewables are projected to grow fastest as clean energy transitions accelerate globally.
Which Country Holds the Largest Share of the Middle East Dredging Market?
- U.A.E. is projected to dominate the Middle East dredging market with a revenue share of 41.87% in 2024, driven by extensive port expansion projects, artificial island developments, and coastal protection initiatives such as the Palm Jebel Ali and Khalifa Port expansions
- The nation’s strategic position as a global trade and logistics hub has accelerated investments in capital and maintenance dredging to support larger vessel traffic and deepen harbor channels
- In addition, U.A.E.’s focus on sustainable dredging practices and adoption of advanced equipment has attracted leading international dredging contractors, boosting regional technological capabilities
Which Region is the Fastest Growing Region in the Dredging Market?
Saudi Arabia is expected to register the fastest CAGR of 7.24% from 2025 to 2032, supported by mega-projects under Vision 2030 such as NEOM, the Red Sea Project, and Jeddah Islamic Port expansion. Growing demand for land reclamation to develop tourism and industrial zones, coupled with coastal protection to combat rising sea levels, is driving dredging activities. Furthermore, strategic partnerships between domestic firms and global dredging players are accelerating technology transfer and expanding the kingdom’s dredging capabilities to meet future infrastructure demands.
Which are the Top Companies in Middle East Dredging Market?
The Dredging industry is primarily led by well-established companies, including:
- Boskalis (Netherlands)
- Tidewater Co. (U.S.)
- DEME (Belgium)
- Jan De Nul (Belgium)
- Van Oord nv (Netherlands)
- Holland Dredging Industries BV (Netherlands)
- ARCHIRODON S.A. (Greece)
- National Marine Dredging Company (U.A.E.)
- Union Dredgers & Marine Contracting LLC (U.A.E.)
- Gulf Cobla (L.L.C.) (U.A.E.)
- Xylem (U.S.)
- LAGERSMIT (Netherlands)
- Al Nasser Holdings LLC (U.A.E.)
What are the Recent Developments in Middle East Dredging Market?
- In December 2023, DEME, in partnership with Saudi Archirodon, secured the second phase of the Port of NEOM transformation project in northwest Saudi Arabia. The strategic development, crucial for NEOM's economic goals, involves constructing a sustainable port basin that can accommodate the world's largest ships, reflecting DEME's technical prowess and engineering expertise
- In December 2023, ARCHIRODON S.A., in collaboration with DEME, secured the contract for the second phase of Port of NEOM's transformation, positioning the port strategically for global trade. The initiative, which commenced in December 2023, aimed to create a basin facilitating the entry of the world's largest ships, contributing to NEOM's economic ambitions and regional significance
- In October 2023, National Marine Dredging Company (NMDC) unveiled its new brand, emphasizing plans to enhance existing partnerships and establish cross-sector collaborations for sustainable business growth. NMDC Group's CEO, Mr. Yasser Zaghloul, highlighted a commitment to a sustainable energy future through innovation and strategic alliances. The Abu Dhabi-based dredging leader aims to explore collaborations with governments and the private sector to contribute to industry-wide decarbonization targets. NMDC remains dedicated to fostering growth while aligning with Abu Dhabi's cultural renaissance and the U.A.E.'s sustainable initiatives
- In October 2023, Boskalis entered into a contract with Royal IHC for the construction of a cutting-edge trailing suction hopper dredger, set to be one of the largest in their fleet. Featuring a 31,000 m3 hopper capacity, the vessel will boast energy-efficient innovations, including full diesel-electric installation, Azipods propulsion, and the ability to utilize (green) methanol as an alternative fuel. With anticipated service commencement in mid-2026, this development underscores Boskalis' commitment to a more sustainable dredging fleet
- In March 2023, Holland Dredging Industries BV successfully delivered and installed an innovative draghead on a sea hopper dredger. The new draghead, featuring replaceable nozzles, plates, and teeth, includes stainless steel plates on the visor for rubber protection. HDD reports a remarkable 30% reduction in loading time with this enhancement, showcasing the company's commitment to efficiency. HDD also highlights its capability to supply all components for transforming existing ships into hopper dredgers, collaborating with Dutch shipyards for the process. The addition of stainless steel plates on the visor enhances rubber protection. This innovative draghead has proven to reduce loading times by 30%, showcasing HDD's commitment to efficiency in dredging activities. HDD also offers comprehensive components for TSHDs, enabling the transformation of existing ships into efficient hopper dredgers through collaborations with Dutch shipyards
SKU-

- Interactive Data Analysis Dashboard
- Company Analysis Dashboard for high growth potential opportunities
- Research Analyst Access for customization & queries
- Competitor Analysis with Interactive dashboard
- Latest News, Updates & Trend analysis
- Harness the Power of Benchmark Analysis for Comprehensive Competitor Tracking
Middle East Dredging Market, Supply Chain Analysis and Ecosystem Framework
To support market growth and help clients navigate the impact of geopolitical shifts, DBMR has integrated in-depth supply chain analysis into its Middle East Dredging Market research reports. This addition empowers clients to respond effectively to global changes affecting their industries. The supply chain analysis section includes detailed insights such as Middle East Dredging Market consumption and production by country, price trend analysis, the impact of tariffs and geopolitical developments, and import and export trends by country and HSN code. It also highlights major suppliers with data on production capacity and company profiles, as well as key importers and exporters. In addition to research, DBMR offers specialized supply chain consulting services backed by over a decade of experience, providing solutions like supplier discovery, supplier risk assessment, price trend analysis, impact evaluation of inflation and trade route changes, and comprehensive market trend analysis.
Data collection and base year analysis are done using data collection modules with large sample sizes. The stage includes obtaining market information or related data through various sources and strategies. It includes examining and planning all the data acquired from the past in advance. It likewise envelops the examination of information inconsistencies seen across different information sources. The market data is analysed and estimated using market statistical and coherent models. Also, market share analysis and key trend analysis are the major success factors in the market report. To know more, please request an analyst call or drop down your inquiry.
The key research methodology used by DBMR research team is data triangulation which involves data mining, analysis of the impact of data variables on the market and primary (industry expert) validation. Data models include Vendor Positioning Grid, Market Time Line Analysis, Market Overview and Guide, Company Positioning Grid, Patent Analysis, Pricing Analysis, Company Market Share Analysis, Standards of Measurement, Global versus Regional and Vendor Share Analysis. To know more about the research methodology, drop in an inquiry to speak to our industry experts.
Data Bridge Market Research is a leader in advanced formative research. We take pride in servicing our existing and new customers with data and analysis that match and suits their goal. The report can be customized to include price trend analysis of target brands understanding the market for additional countries (ask for the list of countries), clinical trial results data, literature review, refurbished market and product base analysis. Market analysis of target competitors can be analyzed from technology-based analysis to market portfolio strategies. We can add as many competitors that you require data about in the format and data style you are looking for. Our team of analysts can also provide you data in crude raw excel files pivot tables (Fact book) or can assist you in creating presentations from the data sets available in the report.


