
North America Acidulants Market
Market Size in USD Billion
 USD
1.49 Billion
USD
2.62 Billion
2024
2032
USD
1.49 Billion
USD
2.62 Billion
2024
2032
| 2025 - 2032 | |
| USD 1.49 Billion | |
| USD 2.62 Billion | |
| % | |
|
North America Acidulants Market Size
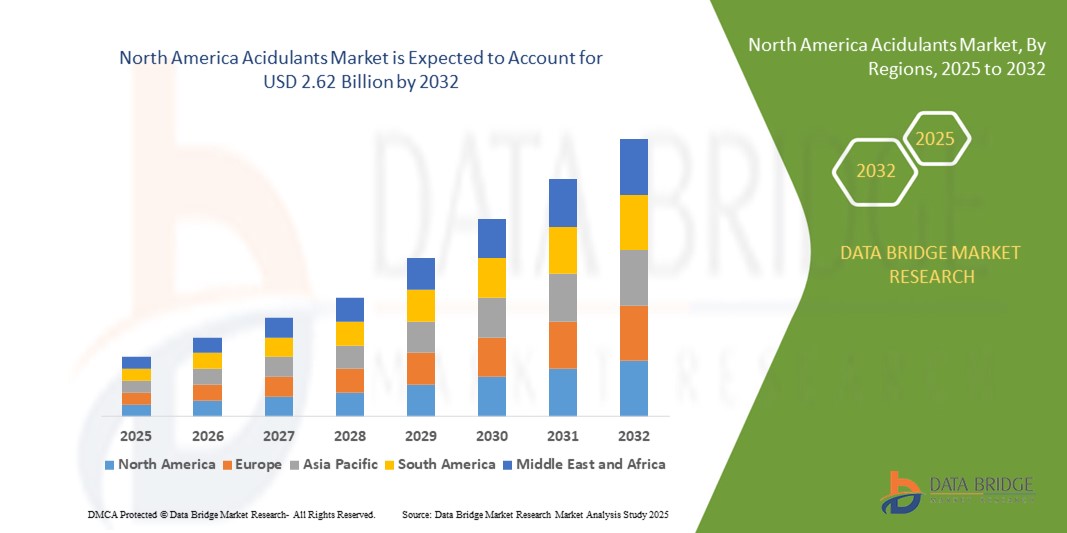
- The North America acidulants market size was valued at USD 1.49 billion in 2024 and is expected to reach USD 2.62 billion by 2032, at a CAGR of 7.70% during the forecast period
- The acidulants market in North America is witnessing steady growth, supported by the region’s robust healthcare infrastructure and increasing emphasis on efficiency within the medical supply chain. A growing prevalence of chronic diseases has heightened the demand for safe, stable, and well-regulated medical supplies, where acidulants play a vital role—particularly in ensuring product integrity, pH balance, and microbial stability
- Healthcare digitization across North America is further transforming logistics and warehousing operations. This digital shift not only streamlines inventory and transportation but also integrates quality control systems that rely on acidulants for various pharmaceutical formulations. As a result, acidulants are becoming increasingly critical in maintaining the efficacy of medical products throughout the distribution process
North America Acidulants Market Analysis
- The North America Acidulants Market is experiencing accelerated growth due to the expanding demand for efficient and compliant logistics infrastructure tailored to medical-grade products. Acidulants systems play a pivotal role in maintaining the quality, safety, and regulatory adherence of healthcare supplies—especially those requiring cold chain integrity, traceability, and real-time monitoring
- Key growth drivers include the expansion of healthcare infrastructure, growth in cross-border trade of pharmaceuticals and medical devices, and increasing regulatory scrutiny related to temperature-sensitive product handling and logistics standardization
- U.S. dominated the North America acidulants market, accounting for 81.2% of total revenue in 2024. This leadership is underpinned by the country’s advanced healthcare delivery network, high adoption of IoT-based tracking solutions, and major investments in smart warehousing and pharmaceutical distribution centers by logistics giants
- Canada is expected to register the highest growth rate in the North America acidulants market, with a CAGR of 9.8% during 2025–2032, owing to rising imports of high-value medical equipment, growth in biopharmaceutical R&D, and efforts to enhance healthcare delivery in underserved regions through temperature-controlled logistics
- The dry form segment dominated the North America acidulants market with a market share of 61.3% in 2024, attributed to its stability, ease of handling, and suitability for powdered formulations and processed foods
Report Scope and North America Acidulants Market Segmentation
|
Attributes |
North America Acidulants Market Insights |
|
Segments Covered |
|
|
Countries Covered |
North America
|
|
Key Market Players |
|
|
Market Opportunities |
|
|
Value Added Data Infosets |
In addition to the insights on market scenarios such as market value, growth rate, segmentation, geographical coverage, and major players, the market reports curated by the Data Bridge Market Research also include in-depth expert analysis, pricing analysis, brand share analysis, consumer survey, demography analysis, supply chain analysis, value chain analysis, raw material/consumables overview, vendor selection criteria, PESTLE Analysis, Porter Analysis, and regulatory framework. |
North America Acidulants Market Trends
Advanced Distribution and Compliance Trends Reshaping the North America Acidulants Market
- The North America acidulants market is undergoing transformation as demand rises for high-purity acidulants used in pharmaceutical manufacturing, clinical nutrition, and medical-grade food formulations. Manufacturers and suppliers are adopting smarter logistics and compliance technologies to ensure quality, safety, and traceability across the supply chain
- Given the critical role of acidulants such as citric acid, lactic acid, fumaric acid, and malic acid in maintaining pH balance, stability, and bioavailability in drug and medical food production, companies are integrating real-time monitoring systems that track environmental parameters during warehousing and transportation. This reduces the risk of contamination or degradation
- In the U.S. and Canada, automated batching and dispensing systems are being used in acidulant distribution hubs to minimize manual handling and ensure formulation precision. These systems are critical when dealing with concentrated or reactive acidulants that support sterile drug manufacturing or parenteral nutrition products
- To comply with FDA and Health Canada regulations, suppliers are utilizing digitally enabled batch traceability, barcoding, and serialization. This ensures that acidulants used in pharmaceutical and clinical applications meet current Good Manufacturing Practices (cGMP) and can be tracked from origin to application
- Temperature and moisture-sensitive acidulants—such as those used in oral drug coatings or enteral nutrition—are being stored in climate-controlled, sensor-enabled warehouses across key North American distribution points. These facilities are equipped with smart alarms and cloud-integrated systems to maintain ideal storage conditions and avoid costly product loss
- Strategic partnerships between acidulant manufacturers and third-party logistics (3PL) providers are enabling the development of custom delivery models for pharmaceutical customers. These include specialized packaging, compliance-driven transport protocols, and automated documentation aligned with regional regulatory requirements
- As healthcare product complexity grows, North American acidulant suppliers are investing in AI-powered logistics platforms for route optimization, inventory forecasting, and demand-driven replenishment. These tools help ensure uninterrupted supply of acidulants for time-critical production cycles in pharma and biopharma facilities
- The convergence of smart warehousing, automated compliance tools, and application-specific acidulant handling solutions is reshaping the North America Acidulants Market, positioning it for stable and innovation-led growth through 2032—particularly in the U.S., which continues to dominate regional demand due to its advanced healthcare manufacturing base
North America Acidulants Market Dynamics
Driver
Rising Demand for Acidulants Driven by Healthcare Expansion and Cold Chain Development
- The North America acidulants market is witnessing strong growth, largely driven by the expansion of healthcare infrastructure and increasing demand for acidulants in pharmaceutical, nutraceutical, and medical nutrition applications
- Acidulants such as citric acid, lactic acid, and phosphoric acid are widely used in the formulation of electrolyte solutions, IV fluids, oral rehydration salts, and various dietary supplements—all of which require tightly controlled storage and distribution conditions
- With growing investments in cold chain infrastructure across the U.S. and Canada, there is an increasing capacity to safely store and transport acidulants that are sensitive to temperature and humidity, ensuring quality and efficacy in both food-grade and pharma-grade applications
- For instance, the rising demand for fortified beverages, processed functional foods, and clinical nutrition products is accelerating the use of acidulants as flavor enhancers, pH regulators, and preservatives
- In addition, the adoption of IoT-based temperature monitoring and real-time tracking in food and pharmaceutical logistics is enhancing operational efficiency and compliance—further supporting the growth of acidulant usage in sectors where product stability and shelf-life are critical
Restraint/Challenge
High Cost and Cold Chain Gaps in Low-Density and Rural Areas
- Despite a favorable market environment, the North America acidulants market faces notable challenges, particularly in rural and underserved regions where access to reliable cold storage and food-grade logistics infrastructure remains limited
- Small- and medium-sized food and beverage manufacturers often face difficulties in maintaining acidulant stability across the supply chain due to inadequate refrigerated transport, high setup costs for specialized storage, and limited access to regional distribution centers
- The cost of establishing and maintaining facilities that comply with food safety and pharmaceutical-grade standards for acidulants can be significant, especially when handling products in dry and liquid forms requiring different temperature and packaging needs
- Moreover, regulatory compliance across both food and pharma segments—such as FDA requirements for additives or GRAS (Generally Recognized As Safe) certifications—can create entry barriers and slow the time-to-market for new acidulant formulations
- To address these issues, there is a growing need for public-private initiatives and investment in regional warehousing, as well as technical support for smaller players to ensure consistent acidulant quality across the supply chain in North America
North America Acidulants Market Scope
The market is segmented on the basis of type, form, function, distribution channel, and end user.
- By Type
On the basis of type, the North America acidulants market is segmented into citric acid, sodium citrate, potassium citrate, acetic acid, formic acid, gluconic acid, malic acid, phosphoric acid and salts, tartaric acid, lactic acid, tannic, fumaric acid, succinic acid, and others. The citric acid segment dominated the market with the largest revenue share of 28.6% in 2024, due to its broad application in food preservation, beverages, pharmaceuticals, and dietary supplements.
The lactic acid segment is projected to grow at the fastest CAGR of 10.8% from 2025 to 2032, driven by increasing use in functional foods, fermented dairy products, and biodegradable polymers.
- By Form
On the basis of form, the North America acidulants market is segmented into dry and liquid forms. The dry form segment accounted for the largest market share of 61.3% in 2024, attributed to its stability, ease of handling, and suitability for powdered formulations and processed foods.
The liquid form segment is expected to witness the highest CAGR of 9.5% during the forecast period (2025–2032), propelled by growing demand in syrups, beverages, and pharmaceutical suspensions that require rapid solubility.
- By Function
On the basis of function, the North America acidulants market is segmented into pH control, acidic flavor enhancer, preservatives, and others. The pH control segment held the dominant market share of 39.7% in 2024, as acidulants are widely used to stabilize formulations in food, beverages, and drug manufacturing.
The acidic flavor enhancer segment is projected to grow at the fastest CAGR of 10.4% from 2025 to 2032, supported by increased use in sauces, snacks, and carbonated drinks for enhancing taste and mouthfeel.
- By Distribution Channel
On the basis of distribution channel, the North America acidulants market is segmented into B2B and B2C. The B2B segment led the market with a dominant share of 74.5% in 2024, due to large-scale bulk purchasing by food processors, pharmaceutical companies, and beverage manufacturers.
The B2C segment is expected to record the highest CAGR of 11.3% during 2025–2032, driven by growing retail availability of food-grade acidulants and rising health-conscious home consumers.
- By End-User
On the basis of end-user, the North America acidulants market is segmented into household/retail, food processing sector, and food service sector. The food processing sector emerged as the leading end-user with a market share of 52.1% in 2024, owing to widespread application of acidulants in canned foods, dairy, bakery products, and processed meats.
The food service sector is anticipated to grow at the fastest CAGR of 9.9% from 2025 to 2032, driven by the rapid expansion of QSRs, catering businesses, and institutional food providers increasingly adopting acidulants for flavor stabilization and shelf-life extension.
North America Acidulants Market Regional Analysis
- North America accounted for 18.4% of the global acidulants market revenue in 2024, supported by the region's robust medical and pharmaceutical production, rising demand for acidulant-based pH regulators and preservatives, and strong logistics infrastructure facilitating regulated product distribution across the U.S., Canada, and Mexico
- Acidulants systems are becoming integral to North America’s medical-grade logistics chain—enabling temperature-sensitive storage, real-time monitoring, and compliance-driven distribution of pharmaceutical and food-grade acidulants. These systems are especially critical in transporting acidulants used in injectable drug formulations, clinical nutrition, and medical food products
- Market growth is driven by rising cross-border trade of acidulants, increasing consumption in biopharmaceutical and nutraceutical manufacturing, and the enforcement of stringent regulatory standards for chemical safety, quality assurance, and traceability
U.S. Acidulants Market Insight
The U.S. acidulants dominated with a revenue share of 81.2% in 2024, backed by its leadership in pharmaceutical and functional food manufacturing, high-volume acidulant consumption in health-related formulations, and the presence of global logistics firms investing in cold chain infrastructure. Widespread implementation of IoT-enabled warehouse systems, automated batching units, and digital compliance tools is propelling U.S. acidulant suppliers to maintain regulatory quality across transportation and storage of acids such as citric, lactic, and acetic acid. The U.S. market is expected to maintain steady growth, driven by domestic production capabilities, innovation in food and pharma-grade acidulant applications, and continual investment in distribution technology
Canada Acidulants Market Insight
Canada acidulants is projected to be the fastest-growing country in the North America Acidulants market, with a CAGR of 9.8% from 2025 to 2032, attributed to a rising dependence on imported acidulants for biopharmaceuticals and functional foods, along with increasing investments in sustainable cold storage and digital logistics. Canada is experiencing a surge in regional warehousing modernization, with smart inventory management systems being adopted to manage volatile demand and ensure regulatory compliance, especially in the distribution of acidulants used in clean-label and organic health products.
Mexico Acidulants Market Insight
Mexico acidulants accounted for an estimated 5.7% share of the North America Acidulants market in 2024 and is emerging as a regional player due to its strong contract manufacturing base for pharmaceuticals and dietary supplements. With a projected CAGR of 7.1% from 2025 to 2032, Mexico’s growth is being supported by increasing investments in regulatory harmonization, government-led healthcare reforms, and the modernization of cold chain systems to manage imports and exports of pH regulators, preservatives, and food-grade acidulants. Mexico’s strategic location, proximity to the U.S., and expanding production of generic pharmaceuticals are enhancing its position in the North American acidulants supply chain.
North America Acidulants Market Share
The acidulants market industry is primarily led by well-established companies, including:
- ADM (U.S.)
- Bartek Ingredients Inc. (Canada)
- Brenntag SE (Germany)
- Cargill, Incorporated (U.S.)
- Corbion (Netherlands)
- DAIRYCHEM (U.S.)
- Direct Food Ingredients (U.K.)
- FBC Industries (U.S.)
- Foodchem International Corporation (China)
- INDUSTRIAL TECNICA PECUARIA, S.A. (Spain)
- Jungbunzlauer Suisse AG (Switzerland)
- Richest Group (China)
- Tate & Lyle (U.K.)
Latest Developments in North America Acidulants Market
- In September 2024, Jungbunzlauer, a leading citric acid and salt producer, announced a CAD 200 million expansion of its fermentation facility in Port Colborne, Ontario. This upgrade will significantly boost North America supply of high‑purity citric acid, sodium citrate, and potassium citrate for pharmaceutical and food applications, supporting acidulants demand in regulated healthcare and nutraceutical segments
SKU-

- Interactive Data Analysis Dashboard
- Company Analysis Dashboard for high growth potential opportunities
- Research Analyst Access for customization & queries
- Competitor Analysis with Interactive dashboard
- Latest News, Updates & Trend analysis
- Harness the Power of Benchmark Analysis for Comprehensive Competitor Tracking
North America Acidulants Market, Supply Chain Analysis and Ecosystem Framework
To support market growth and help clients navigate the impact of geopolitical shifts, DBMR has integrated in-depth supply chain analysis into its North America Acidulants Market research reports. This addition empowers clients to respond effectively to global changes affecting their industries. The supply chain analysis section includes detailed insights such as North America Acidulants Market consumption and production by country, price trend analysis, the impact of tariffs and geopolitical developments, and import and export trends by country and HSN code. It also highlights major suppliers with data on production capacity and company profiles, as well as key importers and exporters. In addition to research, DBMR offers specialized supply chain consulting services backed by over a decade of experience, providing solutions like supplier discovery, supplier risk assessment, price trend analysis, impact evaluation of inflation and trade route changes, and comprehensive market trend analysis.
Data collection and base year analysis are done using data collection modules with large sample sizes. The stage includes obtaining market information or related data through various sources and strategies. It includes examining and planning all the data acquired from the past in advance. It likewise envelops the examination of information inconsistencies seen across different information sources. The market data is analysed and estimated using market statistical and coherent models. Also, market share analysis and key trend analysis are the major success factors in the market report. To know more, please request an analyst call or drop down your inquiry.
The key research methodology used by DBMR research team is data triangulation which involves data mining, analysis of the impact of data variables on the market and primary (industry expert) validation. Data models include Vendor Positioning Grid, Market Time Line Analysis, Market Overview and Guide, Company Positioning Grid, Patent Analysis, Pricing Analysis, Company Market Share Analysis, Standards of Measurement, Global versus Regional and Vendor Share Analysis. To know more about the research methodology, drop in an inquiry to speak to our industry experts.
Data Bridge Market Research is a leader in advanced formative research. We take pride in servicing our existing and new customers with data and analysis that match and suits their goal. The report can be customized to include price trend analysis of target brands understanding the market for additional countries (ask for the list of countries), clinical trial results data, literature review, refurbished market and product base analysis. Market analysis of target competitors can be analyzed from technology-based analysis to market portfolio strategies. We can add as many competitors that you require data about in the format and data style you are looking for. Our team of analysts can also provide you data in crude raw excel files pivot tables (Fact book) or can assist you in creating presentations from the data sets available in the report.


