
Market Analysis and Insights: North America Amniotic Products Market
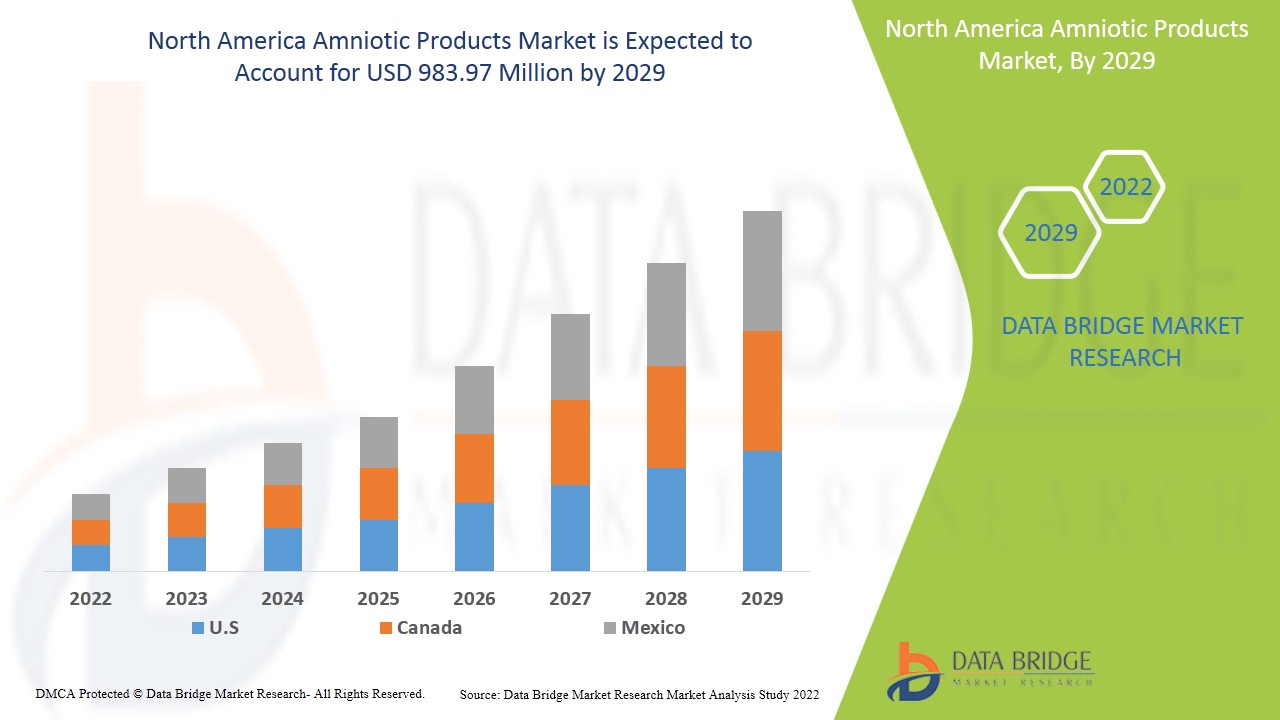
North America amniotic products market is expected to gain market growth in the forecast period of 2022 to 2029. Data Bridge Market Research analyses that the market is growing with a CAGR of 9.5% in the forecast period of 2022 to 2029 and is expected to reach USD 983.97 million by 2029. Use of amniotic products for the treatment of skin and eye disorder and increasing strategic initiatives by key player act as driver for the amniotic products market growth.
Amniotic fluid is the protective liquid contained by the amniotic membrane that serves as a cushion for the growing fetus and to facilitate the exchange of nutrients, water, and biochemical products between mother and fetus. Amniotic-derived products, including amniotic membrane and amniotic fluid products, are one subtype of orthobiologic that are being investigated as a potential treatment option through augmentation of joint inflammation and healing. Amniotic membranes (AM) were initially utilized for treatment of skin disorders such as burns, ulcers, and wounds. The presence of wide range of products of the amniotic products used in the treatment of diseases is satisfying the need of the healthcare facilities. The increased technological advancement leads to development of highly efficient amniotic products in the market.
Major factors driving the growth of North America amniotic products market are use of amniotic products for treatment of skin and eye disorder and ongoing research to increase the therapeutics application and the factor which hampers the growth of the amniotic products market includes high cost of amniotic products and procedures and product recall.
The amniotic products market report provides details of market share, new developments, and product pipeline analysis, impact of domestic and localized market players, analyses opportunities in terms of emerging revenue pockets, changes in market regulations, product approvals, strategic decisions, product launches, geographic expansions, and technological innovations in the market. To understand the analysis and the Amniotic Products market scenario contact Data Bridge Market Research for an Analyst Brief, our team will help you create a revenue impact solution to achieve your desired goal.
Amniotic Products Market Scope and Market Size
The amniotic products market is segmented on basis of product type, type, application, adherence type, site, end user and distribution channel The growth among segments helps you analyze niche pockets of growth and strategies to approach the market and determine your core application areas and the difference in your target markets.
North America amniotic Products market is categorized into seven notable segments based on the product type, type, application, adherence type, site, end user and distribution channel
- On the basis of product type, the North America amniotic products market is segmented into amniotic membranes and amniotic suspensions. In 2022, amniotic membranes segment is expected to dominate the market due to increasing incidence of wound care and ocular surgeries in U.S.
- On the basis of type, the North America amniotic products market is segmented into flowables and non-flowabales. In 2022, non-flowables segment is expected to dominate the market due to the growing amniotic product approval in the U.S. region.
- On the basis of application, the North America amniotic products market is segmented into wound care, orthopedics, ophthalmology, periodontal, regenerative medicines, prenatal diagnosis, stem cell biology and others. In 2022, wound care segment is expected to dominate the market due to the fact that amniotic membrane (AM) is has potential advantage in wound care and injury healing increases when these products are used.
- On the basis of adherence type, the North America amniotic products market is segmented into with sutures and without sutures. In 2022, without suture is expected to dominate the market due to the fact that without suture are more patient compliance.
- On the basis of site, the North America amniotic products market is segmented into with topical and internal. In 2022, the topical segment is expected to dominate the North America amniotic market traditional used amniotic product in topical areas such as in diabetic wound healing, scar and fire or chemical burns.
- On the basis of end user, the North America amniotic products market is segmented into hospital, clinics, research institutes, home care and others. In 2022, hospitals segment is expected to dominate the North America amniotic products market due to the fact that it is the primary healthcare service provider for getting these amniotic procedures. The use of amniotic membrane for ocular use or for using them in tendon and ligament repair are mostly procured in hospital along with that the billing of reimbursement for these product is easily attained in hospital which is the major factor for the growth of the segment.
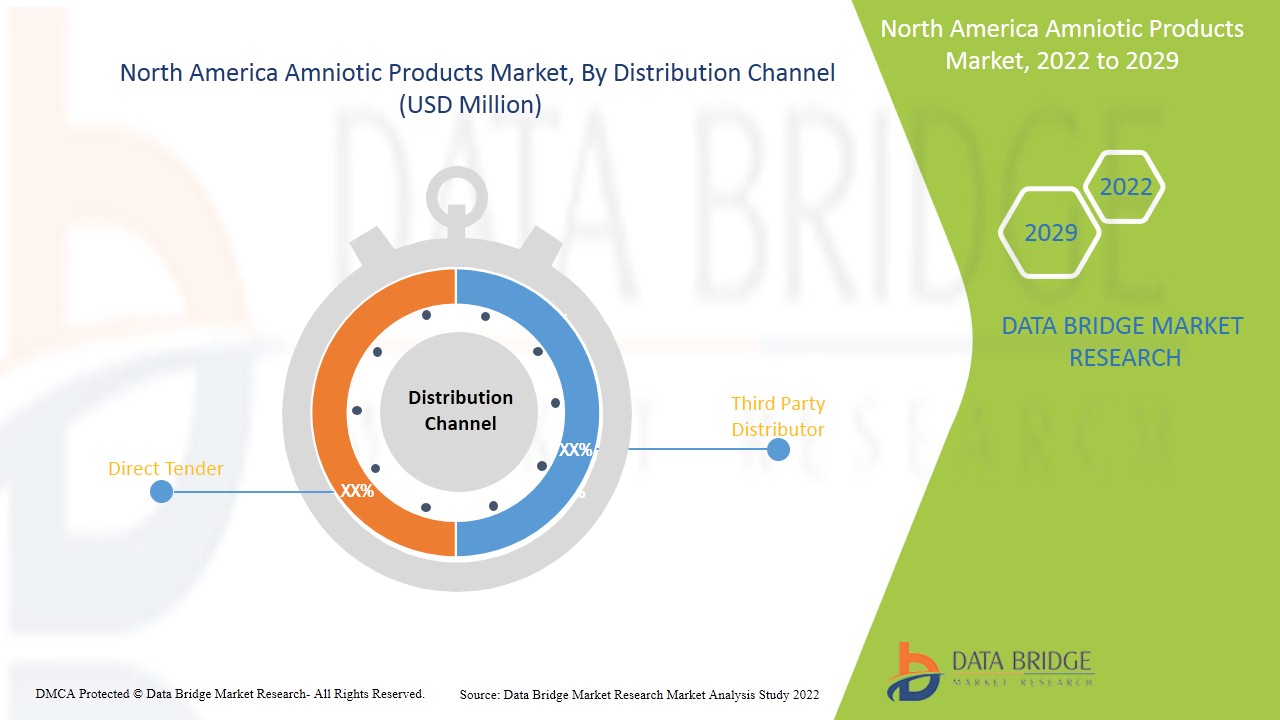
- On the basis of distribution channel, the North America amniotic products market is segmented into direct tender and third party distributor. In 2022, third party distributor is expected to dominate the North America amniotic products market due to the fact that the segment anticipated to boom up in the coming years due to growing demand for amniotic products device products from hospitals, retailers and clinics.
Amniotic Products Market Country Level Analysis
Amniotic Products market is analyzed and market size information is provided by product type, type, application, adherence type, site, end users and distribution channel as referenced above.
The countries covered in the amniotic products market report are the U.S., Canada and Mexico. Non-flowables segment in U.S of North American region is expected to grow with the highest growth rate in the forecast period of 2022 to 2029 because of increasing usage of amniotic products. The non-flowables segment in Canada is second dominating the market owing to increasing cases of chronic diseases and high adoption of amniotic product for better therapies. Mexico is third in leading the growth of the market and non-flowables segment is dominating in this country due to increasing awareness for amniotic products
The country section of the report also provides individual market impacting factors and changes in regulation in the market domestically that impacts the current and future trends of the market. Data points such as new sales, replacement sales, country demographics, regulatory acts and import-export tariffs are some of the major pointers used to forecast the market scenario for individual countries. Also, presence and availability of North America brands and their challenges faced due to large or scarce competition from local and domestic brands, impact of sales channels are considered while providing forecast analysis of the country data.
Growing Strategic Activities by Major Market Players to Enhance the Awareness for Amniotic Products Treatment, is Boosting the Market Growth of Amniotic Products market.
Amniotic products market also provides you with detailed market analysis for every country growth in particular market. Additionally, it provides the detail information regarding the market players’ strategy and their geographical presence. The data is available for historic period 2011 to 2020.
Competitive Landscape and Amniotic Products Market Share Analysis
Amniotic products market competitive landscape provides details by competitor. Details included are company overview, company financials, revenue generated, market potential, investment in research and development, new market initiatives, production sites and facilities, company strengths and weaknesses, product launch, product trials pipelines, product approvals, patents, product width and breadth, application dominance, technology lifeline curve. The above data points provided are only related to the company’s focus related to Amniotic Products market.
The major companies which are dealing in the Amniotic Products are MIMEDX, Smith+Nephew, Organogenesis Inc., Integra LifeSciences, Stryker, APPLIED BIOLOGICS, Katena Products. Inc., Lucina BioSciences, Next Biosciences, Skye Biologics Holdings, LLC., Surgenex, LLC., Ventris Medical, LLC., VIVEX Biologics, Inc., StimLabs LLC., LifeCell International Pvt. Ltd., NuVision Biotherapies Ltd., Genesis Biologics, Amnio Technology, LLC., AMNICELL Corporation, LTD. AlloSource and among other domestic players. DBMR analysts understand competitive strengths and provide competitive analysis for each competitor separately.
Many contract and agreement are also initiated by the companies’ worldwide which are also accelerating the Amniotic Products market.
For instance,
- In January, MiMedx announced the acquisition of Stability Inc.,. Stability Biologics. With thois acquisition MiMedx will develop and market advanced products and therapies for the Wound Care, Surgical, Orthopedic, Spine, Sports Medicine, Ophthalmic, and Dental sectors of healthcare with Stability Biologics. This acquisition helped the company to increase its revenue by acquiring a well renouned company.
- In February 2020, Integra LifeSciences Holding Corporation announced the launch of AmnioExcel Plus Placental Allograft Membrane, its latest wound care offering to support soft tissue repair. AmnioExcel Plus is a next generation, thicker, tri-layer, non-side specific allograft consisting of amnion-chorion-amnion layers that aids in creating an environment to help close complex wounds. The proprietary DryFlex processing technology preserves the inherent growth factors, cytokines and extracellular matrix (ECM) found in native placental tissue
Collaboration, product launch, business expansion, award and recognition, joint ventures and other strategies by the market player is enhancing the company footprints in the amniotic products market which also provides the benefit for organization’s profit growth.
SKU-

- Interactive Data Analysis Dashboard
- Company Analysis Dashboard for high growth potential opportunities
- Research Analyst Access for customization & queries
- Competitor Analysis with Interactive dashboard
- Latest News, Updates & Trend analysis
- Harness the Power of Benchmark Analysis for Comprehensive Competitor Tracking
Table of Content
1 INTRODUCTION
1.1 OBJECTIVES OF THE STUDY
1.2 MARKET DEFINITION
1.3 OVERVIEW OF NORTH AMERICA AMNIOTIC PRODUCTS MARKET
1.4 CURRENCY AND PRICING
1.5 LIMITATIONS
1.6 MARKETS COVERED
2 MARKET SEGMENTATION
2.1 MARKETS COVERED
2.2 GEOGRAPHICAL SCOPE
2.3 YEARS CONSIDERED FOR THE STUDY
2.4 DBMR TRIPOD DATA VALIDATION MODEL
2.5 PRIMARY INTERVIEWS WITH KEY OPINION LEADERS
2.6 MULTIVARIATE MODELLING
2.7 MARKET END USER COVERAGE GRID
2.8 PRODUCT TYPE LIFELINE CURVE
2.9 DBMR MARKET POSITION GRID
2.1 VENDOR SHARE ANALYSIS
2.11 SECONDARY SOURCES
2.12 ASSUMPTIONS
3 EXECUTIVE SUMMARY
4 PREMIUM INSIGHTS
4.1 EPIDEMIOLOGY
4.2 PESTEL'S MODEL
4.3 PORTER
5 PIPELINE ANALYSIS FOR NORTH AMERICA AMNIOTIC PRODUCTS MARKET
6 REGULATIONS OF NORTH AMERICA AMNIOTIC PRODUCTS MARKET
6.1 REGULATORY GUIDELINES FOR EUROPE
6.2 REGULATORY GUIDELINES FOR ASIA-PACIFIC
7 MARKET OVERVIEW
7.1 DRIVERS
7.1.1 USE OF AMNIOTIC PRODUCTS FOR TREATMENT OF SKIN AND EYE DISORDERS
7.1.2 ONGOING RESEARCH TO INCREASE THERAPEUTIC APPLICATIONS OF AMNIOTIC FLUID
7.1.3 INCREASING PRODUCT APPROVAL FOR AMNIOTIC PRODUCT
7.1.4 INCREASING STRATEGIC INITIATIVE BY KEY PLAYER
7.2 RESTRAINTS
7.2.1 HIGH COST OF AMNIOTIC PRODUCTS AND PROCEDURES
7.2.2 DIFFICULTY IN MANAGING AMNIOTIC PRODUCT AND STORAGE
7.2.3 PRODUCT RECALL
7.3 OPPORTUNITIES
7.3.1 PRODUCTS IN PIPELINE
7.3.2 INCREASING INVESTMENT IN AMNIOTIC PRODUCT
7.3.3 BLOOMING FUTURE PROSPECTIVE OF AMNIOTIC PRODUCTS
7.4 CHALLENGES
7.4.1 STRICT REGULATORY GUIDELINES FOR APPROVAL
7.4.2 CHALLENGES FOR IMPLEMENTING THIS PROCESS IN EMERGING ECONOMY
8 IMPACT OF COVID-19 ON NORTH AMERICA AMNIOTIC PRODUCTS MARKET
8.1 IMPACT ON PRICE
8.2 IMPACT ON DEMAND
8.3 IMPACT ON SUPPLY CHAIN
8.4 STRATEGIC DECISIONS BY MANUFACTURERS
8.5 CONCLUSION
9 NORTH AMERICA AMNIOTIC PRODUCTS MARKET, BY PRODUCT TYPE
9.1 OVERVIEW
9.2 AMNIOTIC MEMBRANES
9.2.1 DEHYDRATED AMNIOTIC MEMBRANES
9.2.2 CRYOPRESERVED AMNIOTIC MEMBRANES
9.2.3 OTHERS
9.3 AMNIOTIC SUSPENSIONS
10 NORTH AMERICA AMNIOTIC PRODUCTS MARKET, BY TYPE
10.1 OVERVIEW
10.2 FLOWABLES
10.3 NON-FLOWABLES
11 NORTH AMERICA AMNIOTIC PRODUCTS MARKET, BY APPLICATION
11.1 OVERVIEW
11.2 WOUND CARE
11.2.1 BURNS
11.2.2 SKIN ULCERS
11.2.3 SURGICAL RECONSTRUCTION
11.2.4 SURGICAL INCISIONS
11.2.5 MUSCLE TEARS
11.2.6 INTRA-ARTICULAR PAIN
11.2.7 PLANTAR FASCIITIS
11.2.8 TENDONITIS
11.2.9 LACERATIONS
11.2.10 CESAREAN SITE RECOVERY
11.2.11 REPETITIVE MOTOR INJURIES
11.2.12 SOFT TISSUE INJURIES
11.2.13 LAMINECTOMY
11.2.14 INFLAMED NERVES
11.2.15 TENDON AND NERVE COVERING
11.2.16 OTHERS
11.3 ORTHOPEDICS
11.4 OPHTHALMOLOGY
11.5 REGENERATIVE MEDICINE
11.6 PERIODONTAL
11.7 STEMCELL BIOLOGY
11.8 PRENATAL DIAGNOSIS
11.9 OTHERS
12 NORTH AMERICA AMNIOTIC PRODUCTS MARKET, BY ADHERANCE TYPE
12.1 OVERVIEW
12.2 WITHOUT SUTURES
12.3 WITH SUTURES
13 NORTH AMERICA AMNIOTIC PRODUCTS MARKET, BY SITE
13.1 OVERVIEW
13.2 TOPICAL
13.2.1 AMNIOTIC MEMBRANE
13.2.2 AMNIOTIC SUSPENSION
13.3 INTERNAL
13.3.1 AMNIOTIC MEMBRANE
13.3.2 AMNIOTIC SUSPENSION
14 NORTH AMERICA AMNIOTIC PRODUCTS MARKET, BY END USER
14.1 OVERVIEW
14.2 HOSPITALS
14.3 CLINICS
14.4 RESEARCH INSTITUTES
14.5 HOMECARE
14.6 OTHERS
15 NORTH AMERICA AMNIOTIC PRODUCTS MARKET, BY DISTRIBUTION CHANNEL
15.1 OVERVIEW
15.2 THIRD PARTY DISTRIBUTION
15.3 DIRECT TENDER
16 NORTH AMERICA AMNIOTIC PRODUCTS MARKET, BY REGION
16.1 NORTH AMERICA
16.1.1 U.S.
16.1.2 CANADA
16.1.3 MEXICO
17 NORTH AMERICA AMNIOTIC PRODUCTS MARKET: COMPANY LANDSCAPE
17.1 COMPANY SHARE ANALYSIS: NORTH AMERICA
18 SWOT ANALYSIS
19 COMPANY PROFILE
19.1 MIMEDX
19.1.1 COMPANY SNAPSHOT
19.1.2 REVENUE ANALYSIS
19.1.3 COMPANY SHARE ANALYSIS
19.1.4 PRODUCT PORTFOLIO
19.1.5 RECENT DEVELOPMENTS
19.1.5.1 PRODUCT LAUNCH
19.1.5.2 ACQUISITION
19.2 ORGANOGENESIS INC
19.2.1 COMPANY SNAPSHOT
19.2.2 REVENUE ANALYSIS
19.2.3 COMPANY SHARE ANALYSIS
19.2.4 PRODUCT PORTFOLIO
19.2.5 RECENT DEVELOPMENT
19.3 SMITH+NEPHEW
19.3.1 COMPANY SNAPSHOT
19.3.2 REVENUE ANALYSIS
19.3.3 COMPANY SHARE ANALYSIS
19.3.4 PRODUCT PORTFOLIO
19.3.5 RECENT DEVELOPMENTS
19.3.5.1 PRODUCT LAUNCH
19.4 INTEGRA LIFESCIENCES
19.4.1 COMPANY SNAPSHOT
19.4.2 RECENT FINANCIALS
19.4.3 COMPANY SHARE ANALYSIS
19.4.4 PRODUCT PORTFOLIO
19.4.5 RECENT DEVELOPMENT
19.4.5.1 PRODUCT LAUNCH
19.5 STRYKER
19.5.1 COMPANY SNAPSHOT
19.5.2 RECENT FINANCIALS
19.5.3 COMPANY SHARE ANALYSIS
19.5.4 PRODUCT PORTFOLIO
19.5.5 RECENT DEVELOPMENT
19.6 ALLOSOURCE
19.6.1 COMPANY SNAPSHOT
19.6.2 PRODUCT PORTFOLIO
19.6.3 RECENT DEVELOPMENT
19.7 AMNICELL CORPORATION, LTD
19.7.1 COMPANY SNAPSHOT
19.7.2 PRODUCT PORTFOLIO
19.7.3 RECENT DEVELOPMENT
19.8 AMNIO TECHNOLOGY, LLC
19.8.1 COMPANY SNAPSHOT
19.8.2 PRODUCT PORTFOLIO
19.8.3 RECENT DEVELOPMENT
19.9 APPLIED BIOLOGICS
19.9.1 COMPANY SNAPSHOT
19.9.2 PRODUCT PORTFOLIO
19.9.3 RECENT DEVELOPMENT
19.1 GENESIS BIOLOGICS
19.10.1 COMPANY SNAPSHOT
19.10.2 PRODUCT PORTFOLIO
19.10.3 RECENT DEVELOPMENT
19.11 KATENA PRODUCTS. INC
19.11.1 COMPANY SNAPSHOT
19.11.2 PRODUCT PORTFOLIO
19.11.3 RECENT DEVELOPMENT
19.11.3.1 ACQUISITIONS
19.12 LIFECELL INTERNATIONAL PVT. LTD
19.12.1 COMPANY SNAPSHOT
19.12.2 PRODUCT PORTFOLIO
19.12.3 RECENT DEVELOPMENT
19.13 LUCINA BIOSCIENCES
19.13.1 COMPANY SNAPSHOT
19.13.2 PRODUCT PORTFOLIO
19.13.3 RECENT DEVELOPMENT
19.14 NEXT BIOSCIENCES
19.14.1 COMPANY SNAPSHOT
19.14.2 PRODUCT PORTFOLIO
19.14.3 RECENT DEVELOPMENT
19.15 NUVISION BIOTHERAPIES LTD
19.15.1 COMPANY SNAPSHOT
19.15.2 PRODUCT PORTFOLIO
19.15.3 RECENT DEVELOPMENT
19.16 SKYE BIOLOGICS HOLDINGS, LLC
19.16.1 COMPANY SNAPSHOT
19.16.2 PRODUCT PORTFOLIO
19.16.3 RECENT DEVELOPMENT
19.16.3.1 ACQUISITION
19.17 STIMLABS LLC
19.17.1 COMPANY SNAPSHOT
19.17.2 PRODUCT PORTFOLIO
19.17.3 RECENT DEVELOPMENT
19.17.3.1 PRODUCT LAUNCH
19.18 SURGENEX, LLC
19.18.1 COMPANY SNAPSHOT
19.18.2 PRODUCT PORTFOLIO
19.18.3 RECENT DEVELOPMENT
19.19 VIVEX BIOLOGICS, INC
19.19.1 COMPANY SNAPSHOT
19.19.2 PRODUCT PORTFOLIO
19.19.3 RECENT DEVELOPMENT
19.2 VENTRIS MEDICAL
19.20.1 COMPANY SNAPSHOT
19.20.2 PRODUCT PORTFOLIO
19.20.3 RECENT DEVELOPMENT
20 QUESTIONNAIRE
21 RELATED REPORTS
List of Table
TABLE 1 ONGOING RESEARCH FOR THERAPEUTIC APPLICATION
TABLE 2 FDA HAS RECALLED MANY AMNION FLUID INJECTABLE TO BE WITHDRAWN BY MAY 31, 2021.
TABLE 3 NORTH AMERICA AMNIOTIC PRODUCTS MARKET, BY PRODUCT TYPE, 2020-2029 (USD MILLION)
TABLE 4 NORTH AMERICA AMNIOTIC MEMBRANES IN AMNIOTIC PRODUCTS MARKET, BY REGION, 2020-2029 (USD MILLION)
TABLE 5 NORTH AMERICA AMNIOTIC MEMBRANES IN AMNIOTIC PRODUCTS MARKET, BY PRODUCT TYPE, 2020-2029 (USD MILLION)
TABLE 6 NORTH AMERICA AMNIOTIC SUSPENSIONS IN AMNIOTIC PRODUCTS MARKET, BY REGION, 2020-2029 (USD MILLION)
TABLE 7 NORTH AMERICA AMNIOTIC PRODUCTS MARKET, BY TYPE, 2020-2029 (USD MILLION)
TABLE 8 NORTH AMERICA FLOWABLES IN AMNIOTIC PRODUCTS MARKET, BY REGION, 2020-2029 (USD MILLION)
TABLE 9 NORTH AMERICA NON-FLOWABLES IN AMNIOTIC PRODUCTS MARKET, BY REGION, 2020-2029 (USD MILLION)
TABLE 10 NORTH AMERICA AMNIOTIC PRODUCTS MARKET, BY APPLICATION, 2020-2029 (USD MILLION)
TABLE 11 NORTH AMERICA WOUND CARE IN AMNIOTIC PRODUCTS MARKET, BY REGION, 2020-2029 (USD MILLION)
TABLE 12 NORTH AMERICA WOUND CARE IN AMNIOTIC PRODUCTS MARKET, BY APPLICATION, 2020-2029 (USD MILLION)
TABLE 13 NORTH AMERICA ORTHOPEDICS IN AMNIOTIC PRODUCTS MARKET, BY REGION, 2020-2029 (USD MILLION)
TABLE 14 NORTH AMERICA OPHTHALMOLOGY IN AMNIOTIC PRODUCTS MARKET, BY REGION, 2020-2029 (USD MILLION)
TABLE 15 NORTH AMERICA REGENERATIVE MEDICINE IN AMNIOTIC PRODUCTS MARKET, BY REGION, 2020-2029 (USD MILLION)
TABLE 16 NORTH AMERICA PERIODONTAL IN AMNIOTIC PRODUCTS MARKET, BY REGION, 2020-2029 (USD MILLION)
TABLE 17 NORTH AMERICA STEMCELL BIOLOGY IN AMNIOTIC PRODUCTS MARKET, BY REGION, 2020-2029 (USD MILLION)
TABLE 18 NORTH AMERICA PRENATAL DIAGNOSIS IN AMNIOTIC PRODUCTS MARKET, BY REGION, 2020-2029 (USD MILLION)
TABLE 19 NORTH AMERICA OTHERS IN AMNIOTIC PRODUCTS MARKET, BY REGION, 2020-2029 (USD MILLION)
TABLE 20 NORTH AMERICA AMNIOTIC PRODUCTS MARKET, BY ADHERANCE TYPE, 2020-2029 (USD MILLION)
TABLE 21 NORTH AMERICA WITHOUT SUTURES IN AMNIOTIC PRODUCTS MARKET, BY REGION, 2020-2029 (USD MILLION)
TABLE 22 NORTH AMERICA WITH SUTURES IN AMNIOTIC PRODUCTS MARKET, BY REGION, 2020-2029 (USD MILLION)
TABLE 23 NORTH AMERICA AMNIOTIC PRODUCTS MARKET, BY SITE, 2020-2029 (USD MILLION)
TABLE 24 NORTH AMERICA TOPICAL IN AMNIOTIC PRODUCTS MARKET, BY REGION, 2020-2029 (USD MILLION)
TABLE 25 NORTH AMERICA TOPICAL IN AMNIOTIC PRODUCTS MARKET, BY SITE, 2020-2029 (USD MILLION)
TABLE 26 NORTH AMERICA INTERNAL IN AMNIOTIC PRODUCTS MARKET, BY REGION, 2020-2029 (USD MILLION)
TABLE 27 NORTH AMERICA INTERNAL IN AMNIOTIC PRODUCTS MARKET, BY SITE, 2020-2029 (USD MILLION)
TABLE 28 NORTH AMERICA AMNIOTIC PRODUCTS MARKET, BY END USER, 2020-2029 (USD MILLION)
TABLE 29 NORTH AMERICA HOSPITALS IN AMNIOTIC PRODUCTS MARKET, BY REGION, 2020-2029 (USD MILLION)
TABLE 30 NORTH AMERICA CLINICS IN AMNIOTIC PRODUCTS MARKET, BY REGION, 2020-2029 (USD MILLION)
TABLE 31 NORTH AMERICA RESEARCH INSTITUTES IN AMNIOTIC PRODUCTS MARKET, BY REGION, 2020-2029 (USD MILLION)
TABLE 32 NORTH AMERICA HOME CARE IN AMNIOTIC PRODUCTS MARKET, BY REGION, 2020-2029 (USD MILLION)
TABLE 33 NORTH AMERICA OTHERS IN AMNIOTIC PRODUCTS MARKET, BY REGION, 2020-2029 (USD MILLION)
TABLE 34 NORTH AMERICA AMNIOTIC PRODUCTS MARKET, BY DISTRIBUTION CHANNEL, 2020-2029 (USD MILLION)
TABLE 35 NORTH AMERICA THIRD PARTY DISTRIBUTION IN AMNIOTIC PRODUCTS MARKET, BY REGION, 2020-2029 (USD MILLION)
TABLE 36 NORTH AMERICA DIRECT TENDER IN AMNIOTIC PRODUCTS MARKET, BY REGION, 2020-2029 (USD MILLION)
TABLE 37 NORTH AMERICA AMNIOTIC PRODUCTS MARKET, BY COUNTRY, 2020-2029 (USD MILLION)
TABLE 38 NORTH AMERICA AMNIOTIC PRODUCTS MARKET, BY PRODUCT TYPE, 2020-2029 (USD MILLION)
TABLE 39 NORTH AMERICA AMNIOTIC MEMBRANES IN AMNIOTIC PRODUCTS MARKET, BY PRODUCT TYPE, 2020-2029 (USD MILLION)
TABLE 40 NORTH AMERICA AMNIOTIC PRODUCTS MARKET, BY TYPE, 2020-2029 (USD MILLION)
TABLE 41 NORTH AMERICA AMNIOTIC PRODUCTS MARKET, BY APPLICATION, 2020-2029 (USD MILLION)
TABLE 42 NORTH AMERICA WOUND CARE IN AMNIOTIC PRODUCTS MARKET, BY APPLICATION, 2020-2029 (USD MILLION)
TABLE 43 NORTH AMERICA AMNIOTIC PRODUCTS MARKET, BY ADHERANCE TYPE, 2020-2029 (USD MILLION)
TABLE 44 NORTH AMERICA AMNIOTIC PRODUCTS MARKET, BY SITE, 2020-2029 (USD MILLION)
TABLE 45 NORTH AMERICA TOPICAL IN AMNIOTIC PRODUCTS MARKET, BY SITE, 2020-2029 (USD MILLION)
TABLE 46 NORTH AMERICA INTERNAL IN AMNIOTIC PRODUCTS MARKET, BY SITE, 2020-2029 (USD MILLION)
TABLE 47 NORTH AMERICA AMNIOTIC PRODUCTS MARKET, BY END USER, 2020-2029 (USD MILLION)
TABLE 48 NORTH AMERICA AMNIOTIC PRODUCTS MARKET, BY DISTRIBUTION CHANNEL, 2020-2029 (USD MILLION)
TABLE 49 U.S. AMNIOTIC PRODUCTS MARKET, BY PRODUCT TYPE, 2020-2029 (USD MILLION)
TABLE 50 U.S. AMNIOTIC MEMBRANES IN AMNIOTIC PRODUCTS MARKET, BY PRODUCT TYPE, 2020-2029 (USD MILLION)
TABLE 51 U.S. AMNIOTIC PRODUCTS MARKET, BY TYPE, 2020-2029 (USD MILLION)
TABLE 52 U.S. AMNIOTIC PRODUCTS MARKET, BY APPLICATION, 2020-2029 (USD MILLION)
TABLE 53 U.S. WOUND CARE IN AMNIOTIC PRODUCTS MARKET, BY APPLICATION, 2020-2029 (USD MILLION)
TABLE 54 U.S. AMNIOTIC PRODUCTS MARKET, BY ADHERANCE TYPE, 2020-2029 (USD MILLION)
TABLE 55 U.S. AMNIOTIC PRODUCTS MARKET, BY SITE, 2020-2029 (USD MILLION)
TABLE 56 U.S. TOPICAL IN AMNIOTIC PRODUCTS MARKET, BY SITE, 2020-2029 (USD MILLION)
TABLE 57 U.S. INTERNAL IN AMNIOTIC PRODUCTS MARKET, BY SITE, 2020-2029 (USD MILLION)
TABLE 58 U.S. AMNIOTIC PRODUCTS MARKET, BY END USER, 2020-2029 (USD MILLION)
TABLE 59 U.S. AMNIOTIC PRODUCTS MARKET, BY DISTRIBUTION CHANNEL, 2020-2029 (USD MILLION)
TABLE 60 CANADA AMNIOTIC PRODUCTS MARKET, BY PRODUCT TYPE, 2020-2029 (USD MILLION)
TABLE 61 CANADA AMNIOTIC MEMBRANES IN AMNIOTIC PRODUCTS MARKET, BY PRODUCT TYPE, 2020-2029 (USD MILLION)
TABLE 62 CANADA AMNIOTIC PRODUCTS MARKET, BY TYPE, 2020-2029 (USD MILLION)
TABLE 63 CANADA AMNIOTIC PRODUCTS MARKET, BY APPLICATION, 2020-2029 (USD MILLION)
TABLE 64 CANADA WOUND CARE IN AMNIOTIC PRODUCTS MARKET, BY APPLICATION, 2020-2029 (USD MILLION)
TABLE 65 CANADA AMNIOTIC PRODUCTS MARKET, BY ADHERANCE TYPE, 2020-2029 (USD MILLION)
TABLE 66 CANADA AMNIOTIC PRODUCTS MARKET, BY SITE, 2020-2029 (USD MILLION)
TABLE 67 CANADA TOPICAL IN AMNIOTIC PRODUCTS MARKET, BY SITE, 2020-2029 (USD MILLION)
TABLE 68 CANADA INTERNAL IN AMNIOTIC PRODUCTS MARKET, BY SITE, 2020-2029 (USD MILLION)
TABLE 69 CANADA AMNIOTIC PRODUCTS MARKET, BY END USER, 2020-2029 (USD MILLION)
TABLE 70 CANADA AMNIOTIC PRODUCTS MARKET, BY DISTRIBUTION CHANNEL, 2020-2029 (USD MILLION)
TABLE 71 MEXICO AMNIOTIC PRODUCTS MARKET, BY PRODUCT TYPE, 2020-2029 (USD MILLION)
TABLE 72 MEXICO AMNIOTIC MEMBRANES IN AMNIOTIC PRODUCTS MARKET, BY PRODUCT TYPE, 2020-2029 (USD MILLION)
TABLE 73 MEXICO AMNIOTIC PRODUCTS MARKET, BY TYPE, 2020-2029 (USD MILLION)
TABLE 74 MEXICO AMNIOTIC PRODUCTS MARKET, BY APPLICATION, 2020-2029 (USD MILLION)
TABLE 75 MEXICO WOUND CARE IN AMNIOTIC PRODUCTS MARKET, BY APPLICATION, 2020-2029 (USD MILLION)
TABLE 76 MEXICO AMNIOTIC PRODUCTS MARKET, BY ADHERANCE TYPE, 2020-2029 (USD MILLION)
TABLE 77 MEXICO AMNIOTIC PRODUCTS MARKET, BY SITE, 2020-2029 (USD MILLION)
TABLE 78 MEXICO TOPICAL IN AMNIOTIC PRODUCTS MARKET, BY SITE, 2020-2029 (USD MILLION)
TABLE 79 MEXICO INTERNAL IN AMNIOTIC PRODUCTS MARKET, BY SITE, 2020-2029 (USD MILLION)
TABLE 80 MEXICO AMNIOTIC PRODUCTS MARKET, BY END USER, 2020-2029 (USD MILLION)
TABLE 81 MEXICO AMNIOTIC PRODUCTS MARKET, BY DISTRIBUTION CHANNEL, 2020-2029 (USD MILLION)
List of Figure
FIGURE 1 NORTH AMERICA AMNIOTIC PRODUCTS MARKET: SEGMENTATION
FIGURE 2 NORTH AMERICA AMNIOTIC PRODUCTS MARKET: DATA TRIANGULATION
FIGURE 3 NORTH AMERICA AMNIOTIC PRODUCTS MARKET: DROC ANALYSIS
FIGURE 4 NORTH AMERICA AMNIOTIC PRODUCTS MARKET: REGIONAL VS COUNTRY MARKET ANALYSIS
FIGURE 5 NORTH AMERICA AMNIOTIC PRODUCTS MARKET: COMPANY RESEARCH ANALYSIS
FIGURE 6 NORTH AMERICA AMNIOTIC PRODUCTS MARKET: INTERVIEW DEMOGRAPHICS
FIGURE 7 NORTH AMERICA AMNIOTIC PRODUCTS MARKET: END USER COVERAGE GRID
FIGURE 8 NORTH AMERICA AMNIOTIC PRODUCTS MARKET: DBMR MARKET POSITION GRID
FIGURE 9 NORTH AMERICA AMNIOTIC PRODUCTS MARKET: VENDOR SHARE ANALYSIS
FIGURE 10 NORTH AMERICA AMNIOTIC PRODUCTS MARKET: SEGMENTATION
FIGURE 11 NORTH AMERICA IS ANTICIPATED TO DOMINATE THE NORTH AMERICA AMNIOTIC PRODUCTS MARKET AND ASIA-PACIFIC IS ESTIMATED TO BE GROWING WITH THE HIGHEST CAGR IN THE FORECAST PERIOD OF 2022 TO 2029
FIGURE 12 USE OF AMNIOTIC PRODUCTS FOR TREATMENT OF SKIN AND EYE DISORDER AND ONGOING RESEARCH TO INCREASE THE THERAPEUTICS APPLICATION IS EXPECTED TO DRIVE THE NORTH AMERICA AMNIOTIC PRODUCTS MARKET IN THE FORECAST PERIOD OF 2022 TO 2029
FIGURE 13 AMNIOTIC MEMBRANES SEGMENT IS EXPECTED TO ACCOUNT FOR THE LARGEST SHARE OF THE NORTH AMERICA AMNIOTIC PRODUCTS MARKET IN 2022 & 2029
FIGURE 14 DRIVERS, RESTRAINTS, OPPORTUNITIES, AND CHALLENGES OF NORTH AMERICA AMNIOTIC PRODUCTS MARKET
FIGURE 15 NORTH AMERICA AMNIOTIC PRODUCTS MARKET: BY PRODUCT TYPE, 2021
FIGURE 16 NORTH AMERICA AMNIOTIC PRODUCTS MARKET: BY PRODUCT TYPE, 2020-2029 (USD MILLION)
FIGURE 17 NORTH AMERICA AMNIOTIC PRODUCTS MARKET: BY PRODUCT TYPE, CAGR (2022-2029)
FIGURE 18 NORTH AMERICA AMNIOTIC PRODUCTS MARKET: BY PRODUCT TYPE, LIFELINE CURVE
FIGURE 19 NORTH AMERICA AMNIOTIC PRODUCTS MARKET: BY TYPE, 2021
FIGURE 20 NORTH AMERICA AMNIOTIC PRODUCTS MARKET: BY TYPE, 2020-2029 (USD MILLION)
FIGURE 21 NORTH AMERICA AMNIOTIC PRODUCTS MARKET: BY TYPE, CAGR (2022-2029)
FIGURE 22 NORTH AMERICA AMNIOTIC PRODUCTS MARKET: BY TYPE, LIFELINE CURVE
FIGURE 23 NORTH AMERICA AMNIOTIC PRODUCTS MARKET: BY APPLICATION, 2021
FIGURE 24 NORTH AMERICA AMNIOTIC PRODUCTS MARKET: BY APPLICATION, 2020-2029 (USD MILLION)
FIGURE 25 NORTH AMERICA AMNIOTIC PRODUCTS MARKET: BY APPLICATION, CAGR (2022-2029)
FIGURE 26 NORTH AMERICA AMNIOTIC PRODUCTS MARKET: BY APPLICATION, LIFELINE CURVE
FIGURE 27 NORTH AMERICA AMNIOTIC PRODUCTS MARKET: BY ADHERANCE TYPE, 2021
FIGURE 28 NORTH AMERICA AMNIOTIC PRODUCTS MARKET: BY ADHERANCE TYPE, 2020-2029 (USD MILLION)
FIGURE 29 NORTH AMERICA AMNIOTIC PRODUCTS MARKET: BY ADHERANCE TYPE, CAGR (2022-2029)
FIGURE 30 NORTH AMERICA AMNIOTIC PRODUCTS MARKET: BY ADHERANCE TYPE, LIFELINE CURVE
FIGURE 31 NORTH AMERICA AMNIOTIC PRODUCTS MARKET: BY SITE, 2021
FIGURE 32 NORTH AMERICA AMNIOTIC PRODUCTS MARKET: BY SITE, 2020-2029 (USD MILLION)
FIGURE 33 NORTH AMERICA AMNIOTIC PRODUCTS MARKET: BY SITE, CAGR (2022-2029)
FIGURE 34 NORTH AMERICA AMNIOTIC PRODUCTS MARKET: BY SITE, LIFELINE CURVE
FIGURE 35 NORTH AMERICA AMNIOTIC PRODUCTS MARKET: BY END USER, 2021
FIGURE 36 NORTH AMERICA AMNIOTIC PRODUCTS MARKET: BY END USER, 2020-2029 (USD MILLION)
FIGURE 37 NORTH AMERICA AMNIOTIC PRODUCTS MARKET: BY END USER, CAGR (2022-2029)
FIGURE 38 NORTH AMERICA AMNIOTIC PRODUCTS MARKET: BY END USER, LIFELINE CURVE
FIGURE 39 NORTH AMERICA AMNIOTIC PRODUCTS MARKET: BY DISTRIBUTION CHANNEL, 2021
FIGURE 40 NORTH AMERICA AMNIOTIC PRODUCTS MARKET: BY DISTRIBUTION CHANNEL, 2020-2029 (USD MILLION)
FIGURE 41 NORTH AMERICA AMNIOTIC PRODUCTS MARKET: BY DISTRIBUTION CHANNEL, CAGR (2022-2029)
FIGURE 42 NORTH AMERICA AMNIOTIC PRODUCTS MARKET: BY DISTRIBUTION CHANNEL, LIFELINE CURVE
FIGURE 43 NORTH AMERICA AMNIOTIC PRODUCTS MARKET: SNAPSHOT (2021)
FIGURE 44 NORTH AMERICA AMNIOTIC PRODUCTS MARKET: BY COUNTRY (2021)
FIGURE 45 NORTH AMERICA AMNIOTIC PRODUCTS MARKET: BY COUNTRY (2022 & 2029)
FIGURE 46 NORTH AMERICA AMNIOTIC PRODUCTS MARKET: BY COUNTRY (2021 & 2029)
FIGURE 47 NORTH AMERICA AMNIOTIC PRODUCTS MARKET: BY PRODUCT TYPE (2022-2029)
FIGURE 48 NORTH AMERICA AMNIOTIC PRODUCTS MARKET: COMPANY SHARE 2021 (%)
Data collection and base year analysis are done using data collection modules with large sample sizes. The stage includes obtaining market information or related data through various sources and strategies. It includes examining and planning all the data acquired from the past in advance. It likewise envelops the examination of information inconsistencies seen across different information sources. The market data is analysed and estimated using market statistical and coherent models. Also, market share analysis and key trend analysis are the major success factors in the market report. To know more, please request an analyst call or drop down your inquiry.
The key research methodology used by DBMR research team is data triangulation which involves data mining, analysis of the impact of data variables on the market and primary (industry expert) validation. Data models include Vendor Positioning Grid, Market Time Line Analysis, Market Overview and Guide, Company Positioning Grid, Patent Analysis, Pricing Analysis, Company Market Share Analysis, Standards of Measurement, Global versus Regional and Vendor Share Analysis. To know more about the research methodology, drop in an inquiry to speak to our industry experts.
Data Bridge Market Research is a leader in advanced formative research. We take pride in servicing our existing and new customers with data and analysis that match and suits their goal. The report can be customized to include price trend analysis of target brands understanding the market for additional countries (ask for the list of countries), clinical trial results data, literature review, refurbished market and product base analysis. Market analysis of target competitors can be analyzed from technology-based analysis to market portfolio strategies. We can add as many competitors that you require data about in the format and data style you are looking for. Our team of analysts can also provide you data in crude raw excel files pivot tables (Fact book) or can assist you in creating presentations from the data sets available in the report.


