
North America Ataxia Market Analysis and Insights
The growing prevalence of ataxia disease has enhanced the market's demand. The rising healthcare expenditure for better health services also contributes to the market's growth. During this crucial period, the major market players are highly focused on product launches and product approvals. In addition, the government and regulatory bodies are supporting market players by product approval due to surging emergence.
The North America ataxia market is growing in the forecast year due to the rise in market players and the availability of advanced products. Along with this, manufacturers are engaged in R&D activity for launching novel products in the market. The increasing research in the field of ataxia therapeutics and the rise in consumption of alcohol and drugs usage are expected to boost the market growth further. However, the difficulty in diagnosing the disease and the lack of genetic testing facilities in some developing countries might hamper the growth of the North America ataxia market in the forecast period.
The rising healthcare expenditure and strategic initiatives by market players may give the market opportunities to enhance the treatment. However, some stringent rules and regulations associated with the approval of drugs and products and product recall from various companies are expected to challenge the market growth.
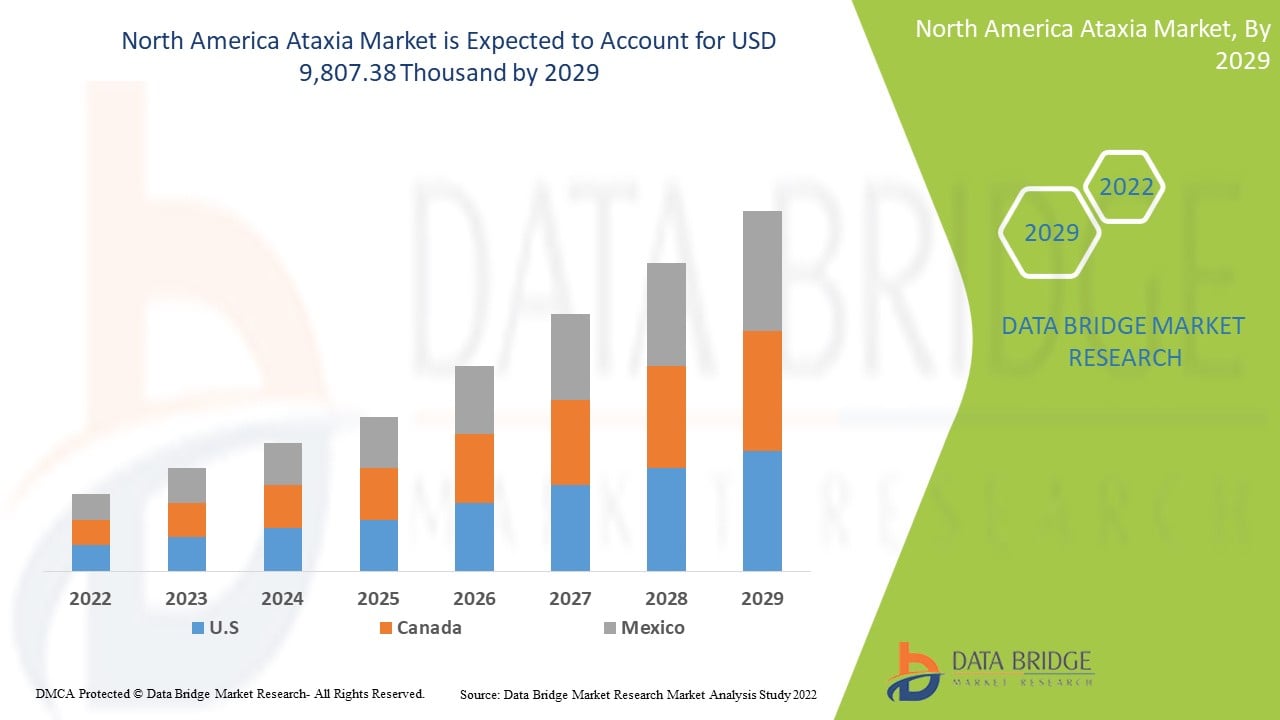
North America ataxia market is expected to gain market growth in the forecast period of 2022 to 2029. Data Bridge Market Research analyses that the market is growing with a CAGR of 7.4% in the forecast period of 2022 to 2029 and is expected to reach USD 16,642.27 thousand by 2029 from USD 9,807.38 thousand in 2021.
|
Report Metric |
Details |
|
Forecast Period |
2022 to 2029 |
|
Base Year |
2021 |
|
Historic Years |
2020 |
|
Quantitative Units |
Revenue in USD thousand, Pricing in USD |
|
Segments Covered |
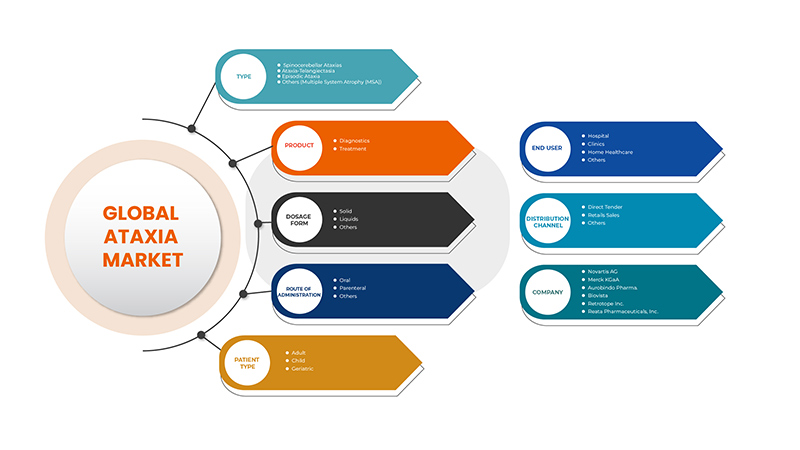
By Type (Spinocerebellar Ataxias, Ataxia-Telangiectasia, Episodic Ataxia, and Others (Multiple System Atrophy (MSA))), Product (Treatment and Diagnosis), Dosage Form (Solid, Liquids, and Others), Route of Administration (Oral, Parenteral, and Others), Patient Type (Adult, Child, and Geriatric), End User (Hospital, Clinics, Home Healthcare, and Others), Distribution Channel (Direct Tender, Retail Sales, and Others) |
|
Countries Covered |
U.S., Canada, Mexico |
|
Market Players Covered |
Novartis AG, Merck KGaA, Aurobindo Pharma., Pfizer Inc., Sanofi, Teva Pharmaceutical Industries Ltd., Acorda Therapeutics, Inc., Viatris Inc., Sun Pharmaceutical Industries Ltd., Lupin., Amneal Pharmaceuticals LLC., Apotex Inc., Cipla Inc., Biovista, Design Therapeutics Inc., Reata Pharmaceuticals, Inc., MATRIX BIOMED, Biohaven Pharmaceuticals, Retrotope Inc., Adverum Biotechnologies, Inc., Sutter Health., Upstream Rehabilitation Inc., Banner Health, Select Medical Corporation, ATI Physical Therapy, among others |
Market Definition
Ataxia is a term for a group of disorders that affect coordination, balance, and speech. Anybody part can be affected, but people with ataxia often have difficulties with balance, walking, speaking, swallowing, and tasks requiring a high degree of control, such as writing, eating, and vision. The exact symptoms and their severity vary depending on the type of ataxia a person has.
Ataxia usually results from damage to a part of the brain called the cerebellum, but it can also be caused by damage to other parts of the nervous system. This damage can be part of an underlying condition such as MS (multiple sclerosis) or can be caused by a head injury, lack of oxygen to the brain, or long-term, excessive alcohol consumption. Hereditary ataxia is caused by a faulty gene passed on by family members who may or may not be affected.
North America Ataxia Market Dynamics
Drivers
- Rapid research in the field of ataxia therapeutics
There is an enormous range of risk factors being reported for ataxia. Hence, to reduce the risk factors and symptoms associated with it, various research is going on in the field of ataxia treatments. Some government funding has also been initiated to treat various types of ataxia in the market. Various rapid research in the field of ataxia therapeutics may help drive the market over the forecasted period and anticipate the major growth in the research and development for the same.
- Rise in alcohol and drug usage
Rising alcohol and drug usage can lead to vitamin B-12, vitamin E, and thiamine deficiency. The lack of these nutrients in the body is considered a major cause of ataxia. A shortage of vitamin E in the body can lead to neurological problems, such as difficulty coordinating movements (ataxia) and speech (dysarthria), loss of reflexes in the legs (lower limb areflexia), and a loss of sensation in the extremities (peripheral neuropathy) this then leads to the various types ataxia. The rising number of people and youth consuming excessive alcohol and drugs also increases the chance of getting affected by various types of ataxia among people, and this is expected to act as a driver for the growth of the North America ataxia market.
Opportunities
- Rising healthcare expenditure
Healthcare expenditure has increased worldwide as people's disposable income in various countries increases. Moreover, to accomplish the population requirements, the government bodies and healthcare organizations are taking the initiative to accelerate healthcare expenditure. The rise in healthcare expenditure simultaneously helps healthcare settings to improve their treatment facilities for ataxia as the disorder has been highly prevalent in recent years.
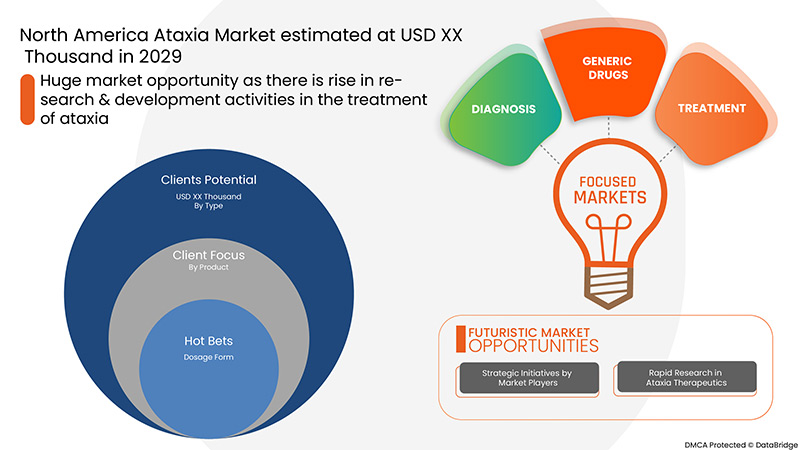
Also, the strategic initiatives taken by key market players will provide structural integrity and future opportunities for the ataxia market in the forecast period of 2022-2029.
Restraints/Challenges
However, the difficulty in diagnosing the disease and lack of genetic testing facilities in some of the developing countries will impede the growth rate of the North America ataxia market. Additionally, stringent rules and regulations will further challenge the forecast period's market.
This North America ataxia market report provides details of new recent developments, trade regulations, import-export analysis, production analysis, value chain optimization, market share, the impact of domestic and localized market players, analyses opportunities in terms of emerging revenue pockets, changes in market regulations, strategic market growth analysis, market size, category market growths, application niches and dominance, product approvals, product launches, geographic expansions, technological innovations in the market. To gain more info on the North America ataxia market, contact Data Bridge Market Research for an Analyst Brief; our team will help you make an informed market decision to achieve market growth.
Post-COVID-19 Impact on North America Ataxia Market
COVID-19 has positively affected the market. Lockdowns and isolation during pandemics complicate disease management and medication adherence. Hence, various treatment drugs have widely increased in the world's population. Hence, the pandemic has positively affected this market.
Recent Development
- In October 2021, Merck KGaA completed gene therapy's new viral vector contract development manufacturing facility. Gene therapies are usually very helpful for rare disease diagnoses such as ataxia. This has helped the company to increase its global presence through such great achievements and made a footprint in the market
North America Ataxia Market Scope
The North America ataxia market is segmented into type, product, dosage form, route of administration, patient type, end user, and distribution channel. The growth amongst these segments will help you analyze meager growth segments in the industries and provide the users with a valuable market overview and market insights to make strategic decisions to identify core market applications.
Type
- Spinocerebellar Ataxias
- Ataxia-Telangiectasia
- Episodic Ataxia
- Others (Multiple System Atrophy (MSA))
On the basis of type, the North America ataxia market is segmented into spinocerebellar ataxias, ataxia-telangiectasia, episodic ataxia, and others (multiple system atrophy (MSA)).
Product
- Diagnosis
- Treatment
On the basis of product, the North America ataxia market is segmented into treatment and diagnosis.
Dosage Form
- Solid
- Liquids
- Others
On the basis of dosage form, the North America ataxia market is segmented into solid, liquids, and others.
Route Of Administration
- Oral
- Parenteral
- Others
On the basis of route of administration, the North America ataxia market is segmented into oral, parenteral, and others.
Patient Type
- Adult
- Child
- Geriatric
On the basis of patient type, the North America ataxia market is segmented into adult, child, and geriatric.
End User
- Hospital
- Clinics
- Home Healthcare
- Others
On the basis of end users, the North America ataxia market is segmented into hospital, clinics, home healthcare, and others.
Distribution Channel
- Direct Tender
- Retail Sales
- Others
On the basis of distribution channel, the North America ataxia market is segmented into direct tender, retail sales, and others.
North America Ataxia Market Regional Analysis/Insights
The North America ataxia market is analyzed, and market size insights and trends are provided by country, type, product, dosage form, route of administration, patient type, end user, and distribution channel.
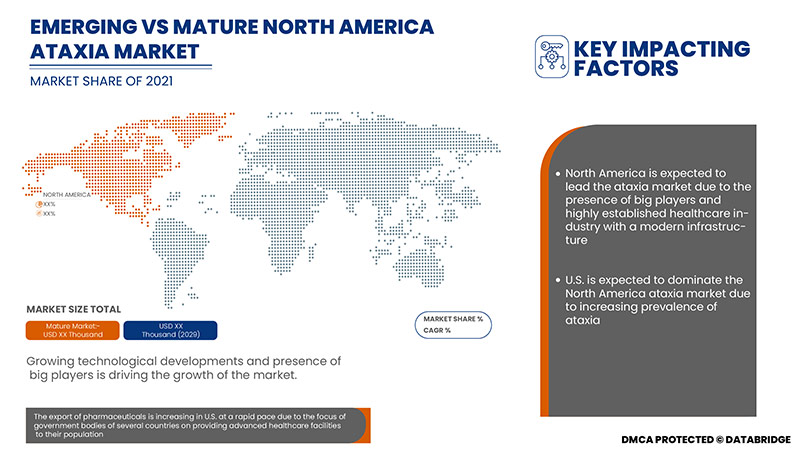
Some of the countries covered in the region are U.S., Canada, and Mexico. U.S. is expected to dominate the North America ataxia market in terms of market share and market revenue and will continue to flourish its dominance during the forecast period. This is due to the high prevalence of ataxia in the region and high drug usage.
The country section of the report also provides individual market impacting factors and changes in regulations in the market that impact the current and future trends of the market. Data points, such as new and replacement sales, country demographics, disease epidemiology, and import-export tariffs, are some of the major pointers used to forecast the market scenario for individual countries. In addition, the presence and availability of North American brands and their challenges faced due to high competition from local and domestic brands and the impact of sales channels are considered while providing forecast analysis of the country data.
Competitive Landscape and North America Ataxia Market Share Analysis
North America ataxia market competitive landscape provides details about the competitors. Details included are company overview, company financials, revenue generated, market potential, investment in research and development, new market initiatives, global presence, production sites and facilities, production capacities, company strengths and weaknesses, product launch, product width and breadth, and application dominance. The above data points provided are only related to the companies' focus on the North America ataxia market.
Some of the major players operating in the North America ataxia market are Novartis AG, Merck KGaA, Aurobindo Pharma., Pfizer Inc., Sanofi, Teva Pharmaceutical Industries Ltd., Acorda Therapeutics, Inc., Viatris Inc., Sun Pharmaceutical Industries Ltd., Lupin., Amneal Pharmaceuticals LLC., Apotex Inc., Cipla Inc., Biovista, Design Therapeutics Inc., Reata Pharmaceuticals, Inc., MATRIX BIOMED, Biohaven Pharmaceuticals, Retrotope Inc., Adverum Biotechnologies, Inc., Sutter Health., Upstream Rehabilitation Inc., Banner Health, Select Medical Corporation, ATI Physical Therapy, among others.
Research Methodology
Data collection and base year analysis are done using data collection modules with large sample sizes. The market data is analyzed and estimated using market statistical and coherent models. In addition, market share analysis and key trend analysis are the major success factors in the market report. The key research methodology used by the DBMR research team is data triangulation which involves data mining, analysis of the impact of data variables on the market, and primary (industry expert) validation. Apart from this, data models include Vendor Positioning Grid, Market Time Line Analysis, Market Overview and Guide, Company Positioning Grid, Company Market Share Analysis, Standards of Measurement, North America vs. Regional, and Vendor Share Analysis. Please request an analyst call in case of further inquiry.
SKU-

- Interactive Data Analysis Dashboard
- Company Analysis Dashboard for high growth potential opportunities
- Research Analyst Access for customization & queries
- Competitor Analysis with Interactive dashboard
- Latest News, Updates & Trend analysis
- Harness the Power of Benchmark Analysis for Comprehensive Competitor Tracking
Table of Content
1 INTRODUCTION
1.1 OBJECTIVES OF THE STUDY
1.2 MARKET DEFINITION
1.3 OVERVIEW OF NORTH AMERICA ATAXIA MARKET
1.4 LIMITATIONS
1.5 MARKETS COVERED
2 MARKET SEGMENTATION
2.1 MARKETS COVERED
2.2 GEOGRAPHICAL SCOPE
2.3 YEARS CONSIDERED FOR THE STUDY
2.4 CURRENCY AND PRICING
2.5 DBMR TRIPOD DATA VALIDATION MODEL
2.6 MULTIVARIATE MODELLING
2.7 TYPE LIFELINE CURVE
2.8 PRIMARY INTERVIEWS WITH KEY OPINION LEADERS
2.9 DBMR MARKET POSITION GRID
2.1 MARKET END USER COVERAGE GRID
2.11 VENDOR SHARE ANALYSIS
2.12 SECONDARY SOURCES
2.13 ASSUMPTIONS
3 EXECUTIVE SUMMARY
4 PREMIUM INSIGHTS
4.1 PESTEL
4.2 PORTER'S FIVE FORCES MODEL
4.3 EPIDEMIOLOGY
5 PIPELINE ANALYSIS
6 NORTH AMERICA ATAXIA MARKET: REGULATORY SCENARIO
7 MARKET OVERVIEW
7.1 DRIVERS
7.1.1 INCREASING PREVALENCE AND INCIDENCES OF ATAXIA
7.1.2 RAPID RESEARCH IN FIELD OF ATAXIA THERAPEUTICS
7.1.3 RISE IN ALCOHOL AND DRUG USAGE
7.1.4 GROWING NUMBER OF INCIDENCES OF AUTO-IMMUNE DISEASE
7.2 RESTRAINTS
7.2.1 DIFFICULTY IN DIAGNOSIS OF DISEASE
7.2.2 LACK OF GENETIC TESTING IN DEVELOPING COUNTRIES
7.3 OPPORTUNITIES
7.3.1 RISING HEALTHCARE EXPENDITURE
7.3.2 STRATEGIC INITIATIVES BY MARKET PLAYERS
7.4 CHALLENGES
7.4.1 STRINGENT RULES AND REGULATIONS
7.4.2 PRODUCT RECALL
8 NORTH AMERICA ATAXIA MARKET, BY TYPE
8.1 OVERVIEW
8.2 SPINOCEREBELLAR ATAXIAS
8.2.1 TYPE 3
8.2.2 TYPE 2
8.2.3 TYPE 1
8.2.4 OTHERS
8.3 ATAXIA-TELANGIECTASIA
8.4 EPISODIC ATAXIA
8.5 OTHERS (MULTIPLE SYSTEM ATROPHY (MSA))
9 NORTH AMERICA ATAXIA MARKET, BY PRODUCT
9.1 OVERVIEW
9.2 TREATMENT
9.2.1 PHARMACOTHERAPY
9.2.1.1 STIFFNESS/SPASTICITY
9.2.1.1.1 GABAPENTIN
9.2.1.1.2 LEVODOPA
9.2.1.1.3 OTHERS
9.2.1.2 GAIT AND TREMORS
9.2.1.2.1 VARENICLINE
9.2.1.2.2 RILUZOLE
9.2.1.2.3 AMANTADINE
9.2.1.2.4 OTHERS
9.2.1.3 ANTI-OXIDANTS
9.2.1.3.1 N‐ACETYLCYSTEINE
9.2.1.3.2 SELEGILINE
9.2.1.3.3 DEHYDROEPIANDROSTERONE
9.2.1.3.4 VITAMIN E
9.2.1.4 NON ANTI-OXIDANTS
9.2.1.4.1 ERYTHROPOIETIN
9.2.1.4.2 DEFERIPRONE
9.2.1.4.3 RESVERATROL
9.2.1.4.4 HISTONE DEACETYLASE INHIBITORS
9.2.1.5 ANTI-ARRHYTHMIC AGENTS
9.2.1.5.1 AMIODARONE
9.2.1.5.2 PROPAFENONE
9.2.1.5.3 FLECAINIDE
9.2.1.5.4 IBUTILIDE
9.2.1.6 ANTI-CARDIAC FAILURE
9.2.1.6.1 BENAZEPRIL
9.2.1.6.2 LISINOPRIL
9.2.1.6.3 CAPTOPRIL
9.2.1.6.4 ENALAPRIL
9.2.1.6.5 FOSINOPRIL
9.2.1.6.6 MOEXIPRIL
9.2.1.6.7 OTHERS
9.2.1.7 ORAL HYPOGLYCEMIC THERAPEUTICS
9.2.1.7.1 BIGUANIDES (METFORMIN)
9.2.1.7.2 SULFONYLUREAS
9.2.1.7.2.1 GLIPIZIDE
9.2.1.7.2.2 GLIMEPIRIDE
9.2.1.7.2.3 GLYBURIDE
9.2.1.7.2.4 OTHERS
9.2.1.7.3 THIAZOLIDINEDIONES
9.2.1.7.4 MEGLITINIDES
9.2.2 LIFESTYLE THERAPY
9.2.2.1 PHYSICAL THERAPY
9.2.2.2 SPEECH THERAPY
9.2.2.3 PALLIATIVE CARE
9.2.2.4 OTHERS
9.2.3 SUPPORTIVE DEVICES
9.2.3.1 WALKING AIDS
9.2.3.2 WHEELCHAIRS
9.2.3.3 OTHERS
9.3 DIAGNOSTICS
9.3.1 IMAGING TEST
9.3.1.1 MRI SCAN
9.3.1.2 OTHERS
9.3.2 BLOOD TEST
9.3.3 GENETIC TESTING
10 NORTH AMERICA ATAXIA MARKET, BY DOSAGE FORM
10.1 OVERVIEW
10.2 SOLID
10.2.1 TABLETS
10.2.2 CAPSULES
10.2.3 OTHERS
10.3 LIQUIDS
10.3.1 INJECTION
10.3.2 SOLUTIONS
10.3.3 OTHERS
10.4 OTHERS
11 NORTH AMERICA ATAXIA MARKET, BY ROUTE OF ADMINISTRATION
11.1 OVERVIEW
11.2 ORAL
11.3 PARENTERAL
11.4 OTHERS
12 NORTH AMERICA ATAXIA MARKET, BY PATIENT TYPE
12.1 OVERVIEW
12.2 ADULT
12.2.1 MALE
12.2.2 FEMALE
12.3 CHILD
12.4 GERIATRIC
13 NORTH AMERICA ATAXIA MARKET, BY END USER
13.1 OVERVIEW
13.2 HOSPITAL
13.3 CLINICS
13.4 HOME HEALTHCARE
13.5 OTHERS
14 NORTH AMERICA ATAXIA MARKET, BY DISTRIBUTION CHANNEL
14.1 OVERVIEW
14.2 DIRECT TENDER
14.3 RETAIL SALES
14.3.1 HOSPITAL PHARMACY
14.3.2 RETAIL SHOP
14.3.3 ONLINE PHARMACY
14.4 OTHERS
15 NORTH AMERICA ATAXIA MARKET, BY GEOGRAPHY
15.1 NORTH AMERICA
15.1.1 U.S.
15.1.2 CANADA
15.1.3 MEXICO
16 NORTH AMERICA ATAXIA MARKET: COMPANY LANDSCAPE
16.1 COMPANY SHARE ANALYSIS: NORTH AMERICA
17 SWOT ANALYSIS
18 COMPANY PROFILE
18.1 SELECT MEDICAL CORPORATION
18.1.1 COMPANY SNAPSHOT
18.1.2 REVENUE ANALYSIS
18.1.3 COMPANY SHARE ANALYSIS
18.1.4 PRODUCT PORTFOLIO
18.1.5 RECENT DEVELOPMENTS
18.2 PFIZER INC.
18.2.1 COMPANY SNAPSHOT
18.2.2 REVENUE ANALYSIS
18.2.3 COMPANY SHARE ANALYSIS
18.2.4 PRODUCT PORTFOLIO
18.2.5 RECENT DEVELOPMENTS
18.3 NOVARTIS AG
18.3.1 COMPANY SNAPSHOT
18.3.2 REVENUE ANALYSIS
18.3.3 COMPANY SHARE ANALYSIS
18.3.4 PRODUCT PORTFOLIO
18.3.5 RECENT DEVELOPMENT
18.4 AMNEAL PHARMACEUTICALS LLC.
18.4.1 COMPANY SNAPSHOT
18.4.2 REVENUE ANALYSIS
18.4.3 COMPANY SHARE ANALYSIS
18.4.4 PRODUCT PORTFOLI
18.4.5 RECENT DEVELOPMENT
18.5 UPSTREAM REHABILITATION INC.
18.5.1 COMPANY SNAPSHOT
18.5.2 COMPANY SHARE ANALYSIS
18.5.3 PRODUCT PORTFOLIO
18.5.4 RECENT DEVELOPMENT
18.6 PRIORY
18.6.1 COMPANY SNAPSHOT
18.6.2 COMPANY SHARE ANALYSIS
18.6.3 PRODUCT PORTFOLIO
18.6.4 RECENT DEVELOPMENT
18.7 ACORDA THERAPEUTICS, INC.
18.7.1 COMPANY SNAPSHOT
18.7.2 REVENUE ANALYSIS
18.7.3 PRODUCT PORTFOLIO
18.7.4 RECENT DEVELOPMENTS
18.8 ADVERUM BIOTECHNOLOGIES, INC.
18.8.1 COMPANY SNAPSHOT
18.8.2 PRODUCT PORTFOLIO
18.8.3 RECENT DEVELOPMENT
18.9 APOTEX INC.
18.9.1 COMPANY SNAPSHOT
18.9.2 PRODUCT PORTFOLIO
18.9.3 RECENT DEVELOPMENT
18.1 ATI PHYSICAL THERAPY
18.10.1 COMPANY SNAPSHOT
18.10.2 PRODUCT PORTFOLIO
18.10.3 RECENT DEVELOPMENT
18.11 AUROBINDO PHARMA
18.11.1 COMPANY SNAPSHOT
18.11.2 REVENUE ANALYSIS
18.11.3 PRODUCT PORTFOLIO
18.11.4 RECENT DEVELOPMENT
18.12 BANNER HEALTH
18.12.1 COMPANY SNAPSHOT
18.12.2 PRODUCT PORTFOLIO
18.12.3 RECENT DEVELOPMENT
18.13 BIOHAVEN PHARMACEUTICALS
18.13.1 COMPANY SNAPSHOT
18.13.2 REVENUE ANALYSIS
18.13.3 PRODUCT PORTFOLIO
18.13.4 RECENT DEVELOPMENTS
18.14 BIOVISTA
18.14.1 COMPANY SNAPSHOT
18.14.2 PRODUCT PORTFOLIO
18.14.3 RECENT DEVELOPMENT
18.15 CIPLA INC.
18.15.1 COMPANY SNAPSHOT
18.15.2 REVENUE ANALYSIS
18.15.3 PRODUCT PORTFOLIO
18.15.4 RECENT DEVELOPMENT
18.16 DESIGN THERAPEUTICS, INC.
18.16.1 COMPANY SNAPSHOT
18.16.2 PRODUCT PORTFOLIO
18.16.3 RECENT DEVELOPMENT
18.17 INTRABIO
18.17.1 COMPANY SNAPSHOT
18.17.2 PRODUCT PORTFOLIO
18.17.3 RECENT DEVELOPMENT
18.18 LUPIN.
18.18.1 COMPANY SNAPSHOT
18.18.2 REVENUE ANALYSIS
18.18.3 PRODUCT PORTFOLIO
18.18.4 RECENT DEVELOPMENTS
18.19 MATRIX BIOMED
18.19.1 COMPANY SNAPSHOT
18.19.2 PRODUCT PORTFOLIO
18.19.3 RECENT DEVELOPMENT
18.2 MERCK KGAA
18.20.1 COMPANY SNAPSHOT
18.20.2 REVENUE ANALYSIS
18.20.3 PRODUCT PORTFOLIO
18.20.4 RECENT DEVELOPMENTS
18.21 REATA PHARMACEUTICALS, INC.
18.21.1 COMPANY SNAPSHOT
18.21.2 PRODUCT PORTFOLIO
18.21.3 RECENT DEVELOPMENT
18.22 RETROTOPE INC.
18.22.1 COMPANY SNAPSHOT
18.22.2 PRODUCT PORTFOLIO
18.22.3 RECENT DEVELOPMENT
18.23 SANOFI
18.23.1 COMPANY SNAPSHOT
18.23.2 REVENUE ANALYSIS
18.23.3 PRODUCT PORTFOLIO
18.23.4 RECENT DEVELOPMENT
18.24 SUN PHARMACEUTICAL INDUSTRIES LTD.
18.24.1 COMPANY SNAPSHOT
18.24.2 REVENUE ANALYSIS
18.24.3 PRODUCT PORTFOLIO
18.24.4 RECENT DEVELOPMENT
18.25 SUTTER HEALTH
18.25.1 COMPANY SNAPSHOT
18.25.2 PRODUCT PORTFOLIO
18.25.3 RECENT DEVELOPMENTS
18.26 TEVA PHARMACEUTICAL INDUSTRIES LTD.
18.26.1 COMPANY SNAPSHOT
18.26.2 REVENUE ANALYSIS
18.26.3 PRODUCT PORTFOLIO
18.26.4 RECENT DEVELOPMENT
18.27 VIATRIS INC.
18.27.1 COMPANY SNAPSHOT
18.27.2 REVENUE ANALYSIS
18.27.3 PRODUCT PORTFOLIO
18.27.4 RECENT DEVELOPMENT
19 QUESTIONNAIRE
20 RELATED REPORTS
List of Table
TABLE 1 NORTH AMERICA ATAXIA MARKET: PIPELINE ANALYSIS
TABLE 2 NORTH AMERICA ATAXIA MARKET, BY TYPE, 2020-2029 (USD THOUSAND)
TABLE 3 NORTH AMERICA SPINOCEREBELLAR ATAXIAS IN ATAXIA MARKET, BY REGION, 2020-2029 (USD THOUSAND)
TABLE 4 NORTH AMERICA SPINOCEREBELLAR ATAXIAS IN ATAXIA MARKET, BY TYPE, 2020-2029 (USD THOUSAND)
TABLE 5 NORTH AMERICA ATAXIA-TELANGIECTASIA IN ATAXIA MARKET, BY REGION, 2020-2029 (USD THOUSAND)
TABLE 6 NORTH AMERICA EPISODIC ATAXIA IN ATAXIA MARKET, BY REGION, 2020-2029 (USD THOUSAND)
TABLE 7 NORTH AMERICA OTHERS (MULTIPLE SYSTEM ATROPHY (MSA)) IN ATAXIA MARKET, BY REGION, 2020-2029 (USD THOUSAND)
TABLE 8 NORTH AMERICA ATAXIA MARKET, BY PRODUCT, 2020-2029 (USD THOUSAND)
TABLE 9 NORTH AMERICA TREATMENT IN ATAXIA MARKET, BY REGION, 2020-2029 (USD THOUSAND)
TABLE 10 NORTH AMERICA TREATMENT IN ATAXIA MARKET, BY PRODUCT, 2020-2029 (USD THOUSAND)
TABLE 11 NORTH AMERICA PHARMACOTHERAPY IN ATAXIA MARKET, BY PRODUCT, 2020-2029 (USD THOUSAND)
TABLE 12 NORTH AMERICA STIFNESS/SPASTICITY IN ATAXIA MARKET, BY PRODUCT, 2020-2029 (USD THOUSAND)
TABLE 13 NORTH AMERICA GAIT AND TREMORS IN ATAXIA MARKET, BY PRODUCT, 2020-2029 (USD THOUSAND)
TABLE 14 NORTH AMERICA ANTI- OXIDANTS IN ATAXIA MARKET, BY PRODUCT, 2020-2029 (USD THOUSAND)
TABLE 15 NORTH AMERICA NON ANTI- OXIDANTS IN ATAXIA MARKET, BY PRODUCT, 2020-2029 (USD THOUSAND)
TABLE 16 NORTH AMERICA ANTI- ARRHYTHMIC AGENTS IN ATAXIA MARKET, BY PRODUCT, 2020-2029 (USD THOUSAND)
TABLE 17 NORTH AMERICA ANTI- CARDIAC FAILURE IN ATAXIA MARKET, BY PRODUCT, 2020-2029 (USD THOUSAND)
TABLE 18 NORTH AMERICA ORAL HYPOGLYCEMIC THERAPEUTICS IN ATAXIA MARKET, BY PRODUCT, 2020-2029 (USD THOUSAND)
TABLE 19 NORTH AMERICA SULFONYLUREAS IN ATAXIA MARKET, BY PRODUCT, 2020-2029 (USD THOUSAND)
TABLE 20 NORTH AMERICA LIFESTYLE THERAPY IN ATAXIA MARKET, BY PRODUCT, 2020-2029 (USD THOUSAND)
TABLE 21 NORTH AMERICA SUPPORTIVE DEVICES IN ATAXIA MARKET, BY PRODUCT, 2020-2029 (USD THOUSAND)
TABLE 22 NORTH AMERICA DIAGNOSTICS IN ATAXIA MARKET, BY REGION, 2020-2029 (USD THOUSAND)
TABLE 23 NORTH AMERICA DIAGNOSTICS IN ATAXIA MARKET, BY PRODUCT, 2020-2029 (USD THOUSAND)
TABLE 24 NORTH AMERICA IMAGING TEST IN ATAXIA MARKET, BY PRODUCT, 2020-2029 (USD THOUSAND)
TABLE 25 NORTH AMERICA ATAXIA MARKET, BY DOSAGE FORM, 2020-2029 (USD THOUSAND)
TABLE 26 NORTH AMERICA SOLID IN ATAXIA MARKET, BY REGION, 2020-2029 (USD THOUSAND)
TABLE 27 NORTH AMERICA SOLID IN ATAXIA MARKET, BY DOSAGE FORM, 2020-2029 (USD THOUSAND)
TABLE 28 NORTH AMERICA LIQUIDS IN ATAXIA MARKET, BY REGION, 2020-2029 (USD THOUSAND)
TABLE 29 NORTH AMERICA LIQUIDS IN ATAXIA MARKET, BY DOSAGE FORM, 2020-2029 (USD THOUSAND)
TABLE 30 NORTH AMERICA OTHERS IN ATAXIA MARKET, BY REGION, 2020-2029 (USD THOUSAND)
TABLE 31 NORTH AMERICA ATAXIA MARKET, BY ROUTE OF ADMINISTRATION, 2020-2029 (USD THOUSAND)
TABLE 32 NORTH AMERICA ORAL IN ATAXIA MARKET, BY REGION, 2020-2029 (USD THOUSAND)
TABLE 33 NORTH AMERICA PARENTERAL IN ATAXIA MARKET, BY REGION, 2020-2029 (USD THOUSAND)
TABLE 34 NORTH AMERICA OTHERS IN ATAXIA MARKET, BY REGION, 2020-2029 (USD THOUSAND)
TABLE 35 NORTH AMERICA ATAXIA MARKET, BY PATIENT TYPE, 2020-2029 (USD THOUSAND)
TABLE 36 NORTH AMERICA ADULT IN ATAXIA MARKET, BY REGION, 2020-2029 (USD THOUSAND)
TABLE 37 NORTH AMERICA ADULT IN ATAXIA MARKET, BY PATIENT TYPE, 2020-2029 (USD THOUSAND)
TABLE 38 NORTH AMERICA CHILD IN ATAXIA MARKET, BY REGION, 2020-2029 (USD THOUSAND)
TABLE 39 NORTH AMERICA GERIATRIC IN ATAXIA MARKET, BY REGION, 2020-2029 (USD THOUSAND)
TABLE 40 NORTH AMERICA ATAXIA MARKET, BY END USER, 2020-2029 (USD THOUSAND)
TABLE 41 NORTH AMERICA HOSPITAL IN ATAXIA MARKET, BY REGION, 2020-2029 (USD THOUSAND)
TABLE 42 NORTH AMERICA CLINICS IN ATAXIA MARKET, BY REGION, 2020-2029 (USD THOUSAND)
TABLE 43 NORTH AMERICA HOME HEALTHCARE IN ATAXIA MARKET, BY REGION, 2020-2029 (USD THOUSAND)
TABLE 44 NORTH AMERICA OTHERS IN ATAXIA MARKET, BY REGION, 2020-2029 (USD THOUSAND)
TABLE 45 NORTH AMERICA ATAXIA MARKET, BY DISTRIBUTION CHANNEL, 2020-2029 (USD THOUSAND)
TABLE 46 NORTH AMERICA DIRECT TENDER IN ATAXIA MARKET, BY REGION, 2020-2029 (USD THOUSAND)
TABLE 47 NORTH AMERICA RETAIL SALES IN ATAXIA MARKET, BY REGION, 2020-2029 (USD THOUSAND)
TABLE 48 NORTH AMERICA RETAILS SALES IN ATAXIA MARKET, BY DISTRIBUTION CHANNEL, 2020-2029 (USD THOUSAND)
TABLE 49 NORTH AMERICA OTHERS IN ATAXIA MARKET, BY REGION, 2020-2029 (USD THOUSAND)
TABLE 50 NORTH AMERICA ATAXIA MARKET, BY COUNTRY, 2020-2029 (USD THOUSAND)
TABLE 51 NORTH AMERICA ATAXIA MARKET, BY TYPE, 2020-2029 (USD THOUSAND)
TABLE 52 NORTH AMERICA SPINOCEREBELLAR ATAXIAS IN ATAXIA MARKET, BY TYPE, 2020-2029 (USD THOUSAND)
TABLE 53 NORTH AMERICA ATAXIA MARKET, BY PRODUCT, 2020-2029 (USD THOUSAND)
TABLE 54 NORTH AMERICA TREATMENT IN ATAXIA MARKET, BY PRODUCT, 2020-2029 (USD THOUSAND)
TABLE 55 NORTH AMERICA PHARMACOTHERAPY IN ATAXIA MARKET, BY PRODUCT, 2020-2029 (USD THOUSAND)
TABLE 56 NORTH AMERICA STIFFNESS/SPASTICITY IN ATAXIA MARKET, BY PRODUCT, 2020-2029 (USD THOUSAND)
TABLE 57 NORTH AMERICA GAIT AND TREMORS IN ATAXIA MARKET, BY PRODUCT, 2020-2029 (USD THOUSAND)
TABLE 58 NORTH AMERICA ANTI-OXIDANTS IN ATAXIA MARKET, BY PRODUCT, 2020-2029 (USD THOUSAND)
TABLE 59 NORTH AMERICA NON ANTI-OXIDANTS TREATMENT IN ATAXIA MARKET, BY PRODUCT, 2020-2029 (USD THOUSAND)
TABLE 60 NORTH AMERICA ANTI-ARRHYTHMIC AGENTS IN ATAXIA MARKET, BY PRODUCT, 2020-2029 (USD THOUSAND)
TABLE 61 NORTH ANTI-CARDIAC FAILURE IN ATAXIA MARKET, BY PRODUCT, 2020-2029 (USD THOUSAND)
TABLE 62 NORTH AMERICA ORAL HYPOGLYCEMIC THERAPEUTICS IN ATAXIA MARKET, BY PRODUCT, 2020-2029 (USD THOUSAND)
TABLE 63 NORTH AMERICA SULFONYLUREAS IN ATAXIA MARKET, BY PRODUCT, 2020-2029 (USD THOUSAND)
TABLE 64 NORTH AMERICA LIFESTYLE THERAPY IN ATAXIA MARKET, BY PRODUCT, 2020-2029 (USD THOUSAND)
TABLE 65 NORTH AMERICA SUPPORTIVE DEVICES IN ATAXIA MARKET, BY PRODUCT, 2020-2029 (USD THOUSAND)
TABLE 66 NORTH AMERICA DIAGNOSTICS IN ATAXIA MARKET, BY PRODUCT, 2020-2029 (USD THOUSAND)
TABLE 67 NORTH AMERICA IMAGING TEST IN ATAXIA MARKET, BY PRODUCT, 2020-2029 (USD THOUSAND)
TABLE 68 NORTH AMERICA IMAGING TEST IN ATAXIA MARKET, BY DOSAGE FORM, 2020-2029 (USD THOUSAND)
TABLE 69 NORTH AMERICA SOLID IN ATAXIA MARKET, BY DOSAGE FORM, 2020-2029 (USD THOUSAND)
TABLE 70 NORTH AMERICA LIQUIDS IN ATAXIA MARKET, BY DOSAGE FORM, 2020-2029 (USD THOUSAND)
TABLE 71 NORTH AMERICA ATAXIA MARKET, BY ROUTE OF ADMINISTRATION, 2020-2029 (USD THOUSAND)
TABLE 72 NORTH AMERICA ATAXIA MARKET, BY PATIENT TYPE, 2020-2029 (USD THOUSAND)
TABLE 73 NORTH AMERICA ADULT IN ATAXIA MARKET, BY PATIENT TYPE, 2020-2029 (USD THOUSAND)
TABLE 74 NORTH AMERICA ATAXIA MARKET, BY END USER, 2020-2029 (USD THOUSAND)
TABLE 75 NORTH AMERICA ATAXIA MARKET, BY DISTRIBUTION CHANNEL, 2020-2029 (USD THOUSAND)
TABLE 76 NORTH AMERICA RETAILS SALES IN ATAXIA MARKET, BY DISTRIBUTION CHANNEL, 2020-2029 (USD THOUSAND)
TABLE 77 U.S. ATAXIA MARKET, BY TYPE, 2020-2029 (USD THOUSAND)
TABLE 78 U.S. SPINOCEREBELLAR ATAXIAS IN ATAXIA MARKET, BY TYPE, 2020-2029 (USD THOUSAND)
TABLE 79 U.S. ATAXIA MARKET, BY PRODUCT, 2020-2029 (USD THOUSAND)
TABLE 80 U.S. TREATMENT IN ATAXIA MARKET, BY PRODUCT, 2020-2029 (USD THOUSAND)
TABLE 81 U.S. PHARMACOTHERAPY IN ATAXIA MARKET, BY PRODUCT, 2020-2029 (USD THOUSAND)
TABLE 82 U.S. STIFFNESS/SPASTICITY IN ATAXIA MARKET, BY PRODUCT, 2020-2029 (USD THOUSAND)
TABLE 83 U.S. GAIT AND TREMORS IN ATAXIA MARKET, BY PRODUCT, 2020-2029 (USD THOUSAND)
TABLE 84 U.S. ANTI-OXIDANTS IN ATAXIA MARKET, BY PRODUCT, 2020-2029 (USD THOUSAND)
TABLE 85 U.S. NON ANTI-OXIDANTS TREATMENT IN ATAXIA MARKET, BY PRODUCT, 2020-2029 (USD THOUSAND)
TABLE 86 U.S. ARRHYTHMIC AGENTS IN ATAXIA MARKET, BY PRODUCT, 2020-2029 (USD THOUSAND)
TABLE 87 U.S. ANTI-CARDIAC FAILURE IN ATAXIA MARKET, BY PRODUCT, 2020-2029 (USD THOUSAND)
TABLE 88 U.S. ORAL HYPOGLYCEMIC THERAPEUTICS IN ATAXIA MARKET, BY PRODUCT, 2020-2029 (USD THOUSAND)
TABLE 89 U.S. SULFONYLUREAS IN ATAXIA MARKET, BY PRODUCT, 2020-2029 (USD THOUSAND)
TABLE 90 U.S. LIFESTYLE THERAPY IN ATAXIA MARKET, BY PRODUCT, 2020-2029 (USD THOUSAND)
TABLE 91 U.S. SUPPORTIVE DEVICES IN ATAXIA MARKET, BY PRODUCT, 2020-2029 (USD THOUSAND)
TABLE 92 U.S. DIAGNOSTICS IN ATAXIA MARKET, BY PRODUCT, 2020-2029 (USD THOUSAND)
TABLE 93 U.S. IMAGING TEST IN ATAXIA MARKET, BY PRODUCT, 2020-2029 (USD THOUSAND)
TABLE 94 U.S. IMAGING TEST IN ATAXIA MARKET, BY DOSAGE FORM, 2020-2029 (USD THOUSAND)
TABLE 95 U.S. SOLID IN ATAXIA MARKET, BY DOSAGE FORM, 2020-2029 (USD THOUSAND)
TABLE 96 U.S. LIQUIDS IN ATAXIA MARKET, BY DOSAGE FORM, 2020-2029 (USD THOUSAND)
TABLE 97 U.S. ATAXIA MARKET, BY ROUTE OF ADMINISTRATION, 2020-2029 (USD THOUSAND)
TABLE 98 U.S. ATAXIA MARKET, BY PATIENT TYPE, 2020-2029 (USD THOUSAND)
TABLE 99 U.S. ADULT IN ATAXIA MARKET, BY PATIENT TYPE, 2020-2029 (USD THOUSAND)
TABLE 100 U.S. ATAXIA MARKET, BY END USER, 2020-2029 (USD THOUSAND)
TABLE 101 U.S. ATAXIA MARKET, BY DISTRIBUTION CHANNEL, 2020-2029 (USD THOUSAND)
TABLE 102 U.S. RETAILS SALES IN ATAXIA MARKET, BY DISTRIBUTION CHANNEL, 2020-2029 (USD THOUSAND)
TABLE 103 CANADA ATAXIA MARKET, BY TYPE, 2020-2029 (USD THOUSAND)
TABLE 104 CANADA SPINOCEREBELLAR ATAXIAS IN ATAXIA MARKET, BY TYPE, 2020-2029 (USD THOUSAND)
TABLE 105 CANADA ATAXIA MARKET, BY PRODUCT, 2020-2029 (USD THOUSAND)
TABLE 106 CANADA TREATMENT IN ATAXIA MARKET, BY PRODUCT, 2020-2029 (USD THOUSAND)
TABLE 107 CANADA PHARMACOTHERAPY IN ATAXIA MARKET, BY PRODUCT, 2020-2029 (USD THOUSAND)
TABLE 108 CANADA STIFFNESS/SPASTICITY IN ATAXIA MARKET, BY PRODUCT, 2020-2029 (USD THOUSAND)
TABLE 109 CANADA GAIT AND TREMORS IN ATAXIA MARKET, BY PRODUCT, 2020-2029 (USD THOUSAND)
TABLE 110 CANADA ANTI-OXIDANTS IN ATAXIA MARKET, BY PRODUCT, 2020-2029 (USD THOUSAND)
TABLE 111 CANADA NON ANTI-OXIDANTS TREATMENT IN ATAXIA MARKET, BY PRODUCT, 2020-2029 (USD THOUSAND)
TABLE 112 CANADA ANTI-ARRHYTHMIC AGENTS IN ATAXIA MARKET, BY PRODUCT, 2020-2029 (USD THOUSAND)
TABLE 113 CANADA ANTI-CARDIAC FAILURE IN ATAXIA MARKET, BY PRODUCT, 2020-2029 (USD THOUSAND)
TABLE 114 CANADA ORAL HYPOGLYCEMIC THERAPEUTICS IN ATAXIA MARKET, BY PRODUCT, 2020-2029 (USD THOUSAND)
TABLE 115 CANADA SULFONYLUREAS IN ATAXIA MARKET, BY PRODUCT, 2020-2029 (USD THOUSAND)
TABLE 116 CANADA LIFESTYLE THERAPY IN ATAXIA MARKET, BY PRODUCT, 2020-2029 (USD THOUSAND)
TABLE 117 CANADA SUPPORTIVE DEVICES IN ATAXIA MARKET, BY PRODUCT, 2020-2029 (USD THOUSAND)
TABLE 118 CANADA DIAGNOSTICS IN ATAXIA MARKET, BY PRODUCT, 2020-2029 (USD THOUSAND)
TABLE 119 CANADA IMAGING TEST IN ATAXIA MARKET, BY PRODUCT, 2020-2029 (USD THOUSAND)
TABLE 120 CANADA IMAGING TEST IN ATAXIA MARKET, BY DOSAGE FORM, 2020-2029 (USD THOUSAND)
TABLE 121 CANADA SOLID IN ATAXIA MARKET, BY DOSAGE FORM, 2020-2029 (USD THOUSAND)
TABLE 122 CANADA LIQUIDS IN ATAXIA MARKET, BY DOSAGE FORM, 2020-2029 (USD THOUSAND)
TABLE 123 CANADA ATAXIA MARKET, BY ROUTE OF ADMINISTRATION, 2020-2029 (USD THOUSAND)
TABLE 124 CANADA ATAXIA MARKET, BY PATIENT TYPE, 2020-2029 (USD THOUSAND)
TABLE 125 CANADA ADULT IN ATAXIA MARKET, BY PATIENT TYPE, 2020-2029 (USD THOUSAND)
TABLE 126 CANADA ATAXIA MARKET, BY END USER, 2020-2029 (USD THOUSAND)
TABLE 127 CANADA ATAXIA MARKET, BY DISTRIBUTION CHANNEL, 2020-2029 (USD THOUSAND)
TABLE 128 CANADA RETAILS SALES IN ATAXIA MARKET, BY DISTRIBUTION CHANNEL, 2020-2029 (USD THOUSAND)
TABLE 129 MEXICO ATAXIA MARKET, BY TYPE, 2020-2029 (USD THOUSAND)
TABLE 130 MEXICO SPINOCEREBELLAR ATAXIAS IN ATAXIA MARKET, BY TYPE, 2020-2029 (USD THOUSAND)
TABLE 131 MEXICO ATAXIA MARKET, BY PRODUCT, 2020-2029 (USD THOUSAND)
TABLE 132 MEXICO TREATMENT IN ATAXIA MARKET, BY PRODUCT, 2020-2029 (USD THOUSAND)
TABLE 133 MEXICO PHARMACOTHERAPY IN ATAXIA MARKET, BY PRODUCT, 2020-2029 (USD THOUSAND)
TABLE 134 MEXICO STIFFNESS/SPASTICITY IN ATAXIA MARKET, BY PRODUCT, 2020-2029 (USD THOUSAND)
TABLE 135 MEXICO GAIT AND TREMORS IN ATAXIA MARKET, BY PRODUCT, 2020-2029 (USD THOUSAND)
TABLE 136 MEXICO ANTI-OXIDANTS IN ATAXIA MARKET, BY PRODUCT, 2020-2029 (USD THOUSAND)
TABLE 137 MEXICO NON ANTI-OXIDANTS TREATMENT IN ATAXIA MARKET, BY PRODUCT, 2020-2029 (USD THOUSAND)
TABLE 138 MEXICO ANTI-ARRHYTHMIC AGENTS IN ATAXIA MARKET, BY PRODUCT, 2020-2029 (USD THOUSAND)
TABLE 139 MEXICO ANTI-CARDIAC FAILURE IN ATAXIA MARKET, BY PRODUCT, 2020-2029 (USD THOUSAND)
TABLE 140 MEXICO ORAL HYPOGLYCEMIC THERAPEUTICS IN ATAXIA MARKET, BY PRODUCT, 2020-2029 (USD THOUSAND)
TABLE 141 MEXICO SULFONYLUREAS IN ATAXIA MARKET, BY PRODUCT, 2020-2029 (USD THOUSAND)
TABLE 142 MEXICO LIFESTYLE THERAPY IN ATAXIA MARKET, BY PRODUCT, 2020-2029 (USD THOUSAND)
TABLE 143 MEXICO SUPPORTIVE DEVICES IN ATAXIA MARKET, BY PRODUCT, 2020-2029 (USD THOUSAND)
TABLE 144 MEXICO DIAGNOSTICS IN ATAXIA MARKET, BY PRODUCT, 2020-2029 (USD THOUSAND)
TABLE 145 MEXICO IMAGING TEST IN ATAXIA MARKET, BY PRODUCT, 2020-2029 (USD THOUSAND)
TABLE 146 MEXICO IMAGING TEST IN ATAXIA MARKET, BY DOSAGE FORM, 2020-2029 (USD THOUSAND)
TABLE 147 MEXICO SOLID IN ATAXIA MARKET, BY DOSAGE FORM, 2020-2029 (USD THOUSAND)
TABLE 148 MEXICO LIQUIDS IN ATAXIA MARKET, BY DOSAGE FORM, 2020-2029 (USD THOUSAND)
TABLE 149 MEXICO ATAXIA MARKET, BY ROUTE OF ADMINISTRATION, 2020-2029 (USD THOUSAND)
TABLE 150 MEXICO ATAXIA MARKET, BY PATIENT TYPE, 2020-2029 (USD THOUSAND)
TABLE 151 MEXICO ADULT IN ATAXIA MARKET, BY PATIENT TYPE, 2020-2029 (USD THOUSAND)
TABLE 152 MEXICO ATAXIA MARKET, BY END USER, 2020-2029 (USD THOUSAND)
TABLE 153 MEXICO ATAXIA MARKET, BY DISTRIBUTION CHANNEL, 2020-2029 (USD THOUSAND)
TABLE 154 MEXICO RETAILS SALES IN ATAXIA MARKET, BY DISTRIBUTION CHANNEL, 2020-2029 (USD THOUSAND)
List of Figure
FIGURE 1 NORTH AMERICA ATAXIA MARKET: SEGMENTATION
FIGURE 2 NORTH AMERICA ATAXIA MARKET: DATA TRIANGULATION
FIGURE 3 NORTH AMERICA ATAXIA MARKET: DROC ANALYSIS
FIGURE 4 NORTH AMERICA ATAXIA MARKET: NORTH AMERICA VS REGIONAL MARKET ANALYSIS
FIGURE 5 NORTH AMERICA ATAXIA MARKET: COMPANY RESEARCH ANALYSIS
FIGURE 6 NORTH AMERICA ATAXIA MARKET: INTERVIEW DEMOGRAPHICS
FIGURE 7 NORTH AMERICA ATAXIA MARKET: DBMR MARKET POSITION GRID
FIGURE 8 NORTH AMERICA ATAXIA MARKET: END USER COVERAGE GRID
FIGURE 9 NORTH AMERICA ATAXIA MARKET: VENDOR SHARE ANALYSIS
FIGURE 10 NORTH AMERICA ATAXIA MARKET: SEGMENTATION
FIGURE 11 RAPID RESEARCH IN FIELD OF ATAXIA THEREPEUTICS IS EXPECTED TO DRIVE THE NORTH AMERICA ATAXIA MARKET IN THE FORECAST PERIOD
FIGURE 12 SPINOCEREBELLAR ATAXIAS SEGMENT IS EXPECTED TO ACCOUNT FOR THE LARGEST SHARE OF THE NORTH AMERICA ATAXIA MARKET IN 2022 & 2029
FIGURE 13 NORTH AMERICA IS EXPECTED TO DOMINATE THE NORTH AMERICA ATAXIA MARKET, AND ASIA-PACIFIC IS EXPECTED TO GROW WITH THE HIGHEST CAGR IN THE FORECAST PERIOD
FIGURE 14 DRIVERS, RESTRAINTS, OPPORTUNITIES, AND CHALLENGES OF THE NORTH AMERICA ATAXIA MARKET
FIGURE 15 NORTH AMERICA ATAXIA MARKET: BY TYPE, 2021
FIGURE 16 NORTH AMERICA ATAXIA MARKET: BY TYPE, 2022-2029 (USD THOUSAND)
FIGURE 17 NORTH AMERICA ATAXIA MARKET: BY TYPE, CAGR (2022-2029)
FIGURE 18 NORTH AMERICA ATAXIA MARKET: BY TYPE, LIFELINE CURVE
FIGURE 19 NORTH AMERICA ATAXIA MARKET: BY PRODUCT, 2021
FIGURE 20 NORTH AMERICA ATAXIA MARKET: BY PRODUCT, 2022-2029 (USD THOUSAND)
FIGURE 21 NORTH AMERICA ATAXIA MARKET: BY PRODUCT, CAGR (2022-2029)
FIGURE 22 NORTH AMERICA ATAXIA MARKET: BY PRODUCT, LIFELINE CURVE
FIGURE 23 NORTH AMERICA ATAXIA MARKET: BY DOSAGE FORM, 2021
FIGURE 24 NORTH AMERICA ATAXIA MARKET: BY DOSAGE FORM, 2022-2029 (USD THOUSAND)
FIGURE 25 NORTH AMERICA ATAXIA MARKET: BY DOSAGE FORM, CAGR (2022-2029)
FIGURE 26 NORTH AMERICA ATAXIA MARKET: BY DOSAGE FORM, LIFELINE CURVE
FIGURE 27 NORTH AMERICA ATAXIA MARKET: BY ROUTE OF ADMINISTRATION, 2021
FIGURE 28 NORTH AMERICA ATAXIA MARKET: BY ROUTE OF ADMINISTRATION, 2022-2029 (USD THOUSAND)
FIGURE 29 NORTH AMERICA ATAXIA MARKET: BY ROUTE OF ADMINISTRATION, CAGR (2022-2029)
FIGURE 30 NORTH AMERICA ATAXIA MARKET: BY ROUTE OF ADMINISTRATION, LIFELINE CURVE
FIGURE 31 NORTH AMERICA ATAXIA MARKET: BY PATIENT TYPE, 2021
FIGURE 32 NORTH AMERICA ATAXIA MARKET: BY PATIENT TYPE, 2022-2029 (USD THOUSAND)
FIGURE 33 NORTH AMERICA ATAXIA MARKET: BY PATIENT TYPE, CAGR (2022-2029)
FIGURE 34 NORTH AMERICA ATAXIA MARKET: BY PATIENT TYPE, LIFELINE CURVE
FIGURE 35 NORTH AMERICA ATAXIA MARKET: BY END USER, 2021
FIGURE 36 NORTH AMERICA ATAXIA MARKET: BY END USER, 2022-2029 (USD THOUSAND)
FIGURE 37 NORTH AMERICA ATAXIA MARKET: BY END USER, CAGR (2022-2029)
FIGURE 38 NORTH AMERICA ATAXIA MARKET: BY END USER, LIFELINE CURVE
FIGURE 39 NORTH AMERICA ATAXIA MARKET: BY DISTRIBUTION CHANNEL, 2021
FIGURE 40 NORTH AMERICA ATAXIA MARKET: BY DISTRIBUTION CHANNEL, 2022-2029 (USD THOUSAND)
FIGURE 41 NORTH AMERICA ATAXIA MARKET: BY DISTRIBUTION CHANNEL, CAGR (2022-2029)
FIGURE 42 NORTH AMERICA ATAXIA MARKET: BY DISTRIBUTION CHANNEL, LIFELINE CURVE
FIGURE 43 NORTH AMERICA ATAXIA MARKET: SNAPSHOT (2021)
FIGURE 44 NORTH AMERICA ATAXIA MARKET: BY COUNTRY (2021)
FIGURE 45 NORTH AMERICA ATAXIA MARKET: BY COUNTRY (2022 & 2029)
FIGURE 46 NORTH AMERICA ATAXIA MARKET: BY COUNTRY (2021 & 2029)
FIGURE 47 NORTH AMERICA ATAXIA MARKET: BY TYPE (2022-2029)
FIGURE 48 NORTH AMERICA ATAXIA MARKET: COMPANY SHARE 2021 (%)
Data collection and base year analysis are done using data collection modules with large sample sizes. The stage includes obtaining market information or related data through various sources and strategies. It includes examining and planning all the data acquired from the past in advance. It likewise envelops the examination of information inconsistencies seen across different information sources. The market data is analysed and estimated using market statistical and coherent models. Also, market share analysis and key trend analysis are the major success factors in the market report. To know more, please request an analyst call or drop down your inquiry.
The key research methodology used by DBMR research team is data triangulation which involves data mining, analysis of the impact of data variables on the market and primary (industry expert) validation. Data models include Vendor Positioning Grid, Market Time Line Analysis, Market Overview and Guide, Company Positioning Grid, Patent Analysis, Pricing Analysis, Company Market Share Analysis, Standards of Measurement, Global versus Regional and Vendor Share Analysis. To know more about the research methodology, drop in an inquiry to speak to our industry experts.
Data Bridge Market Research is a leader in advanced formative research. We take pride in servicing our existing and new customers with data and analysis that match and suits their goal. The report can be customized to include price trend analysis of target brands understanding the market for additional countries (ask for the list of countries), clinical trial results data, literature review, refurbished market and product base analysis. Market analysis of target competitors can be analyzed from technology-based analysis to market portfolio strategies. We can add as many competitors that you require data about in the format and data style you are looking for. Our team of analysts can also provide you data in crude raw excel files pivot tables (Fact book) or can assist you in creating presentations from the data sets available in the report.


