
North America Blood Plasma And Plasma Derived Medicinal Products Market
Market Size in USD Billion
 USD
17.72 Billion
USD
32.09 Billion
2025
2033
USD
17.72 Billion
USD
32.09 Billion
2025
2033
| 2026 - 2033 | |
| USD 17.72 Billion | |
| USD 32.09 Billion | |
| % | |
|
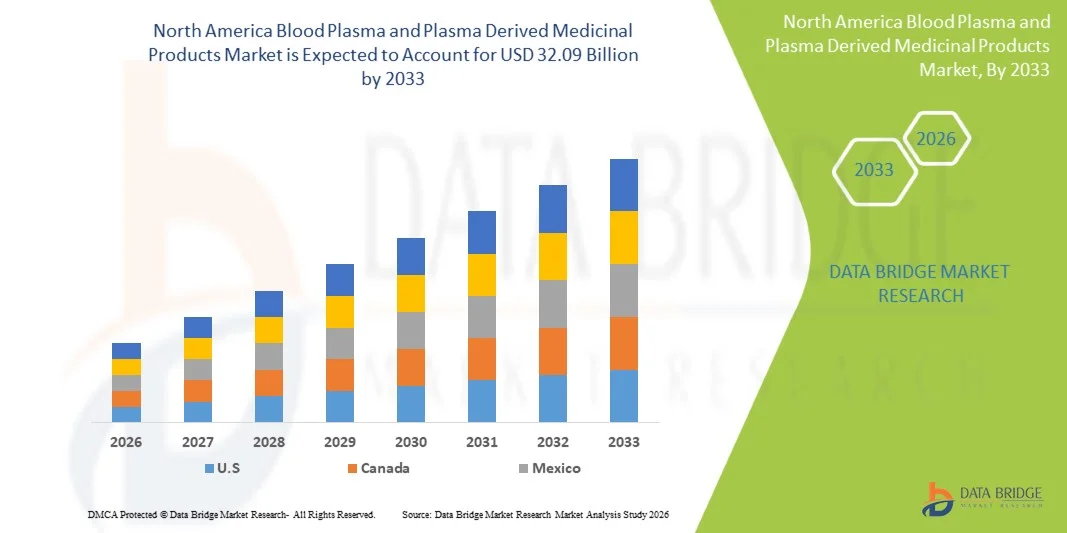
North America Blood Plasma and Plasma Derived Medicinal Products Market Size
- The North America Blood Plasma and Plasma Derived Medicinal Products Market is expected to reach USD 32.09 Billion by 2033 from USD 17.72 Billion in 2025, growing with a substantial CAGR of 8.85% in the forecast period of 2026 to 2033
- The North America Blood Plasma & Plasma-Derived Medicinal Products market growth is strongly driven by the rising prevalence of chronic, autoimmune, and rare diseases, such as immunodeficiency disorders, hemophilia, and neurological conditions. Increasing diagnosis rates, an aging population, and improved access to advanced therapies are significantly boosting demand for plasma-derived treatments including immunoglobulins, albumin, and clotting factors.
- Market expansion is further supported by advancements in plasma collection infrastructure and fractionation technologies, along with favorable regulatory frameworks and strong healthcare expenditure in the region. The growing number of plasma donation centers, coupled with increasing investments by major biopharmaceutical companies, is enhancing plasma supply availability and supporting the large-scale production of high-value plasma-derived medicinal products.
North America Blood Plasma and Plasma Derived Medicinal Products Market Analysis
- The North America Blood Plasma & Plasma-Derived Medicinal Products market is expanding at a steady CAGR, supported by rising prevalence of chronic and rare diseases, increasing adoption of biologics, strong reimbursement frameworks, and continuous investments in plasma collection and fractionation infrastructure across the region.
- Blood plasma and plasma-derived medicinal products play a critical role in life-saving and long-term disease management therapies, supporting applications such as immunoglobulin replacement therapy, hemophilia management, critical care, and treatment of neurological and immunological disorders. Their indispensable role in modern medicine strengthens healthcare system resilience and therapeutic innovation across North America.
- The U.S. dominates the North America Blood Plasma & Plasma-Derived Medicinal Products market, accounting for 63.70% market share in 2025, supported by its extensive plasma collection network, strong presence of leading biopharmaceutical manufacturers, high healthcare expenditure, and a favorable regulatory and reimbursement landscape.
- The U.S. is also the fastest-growing country in the region, registering a CAGR of 8.86%, reflecting increasing demand for plasma-derived therapies, growing burden of chronic and rare diseases, expanding plasma donation centers, and continuous investments in domestic plasma processing and supply chain security.
- Immunoglobulins are the dominant segment, accounting for 41.30% of the total market share in 2025, driven by their extensive use in primary immunodeficiency diseases, autoimmune disorders, neurological conditions, and rising off-label applications in emerging therapeutic areas.
Report Scope and North America Blood Plasma and Plasma Derived Medicinal Products Market Segmentation
|
Attributes |
Blood Plasma & Plasma Derived Medicinal Products Key Market Insights |
|
Segments Covered |
|
|
Countries Covered |
North America
|
|
Key Market Players |
|
|
Market Opportunities |
|
|
Value Added Data Infosets |
In addition to the insights on market scenarios such as market value, growth rate, segmentation, geographical coverage, and major players, the market reports curated by the Data Bridge Market Research also include in-depth expert analysis, patient epidemiology, pipeline analysis, pricing analysis, and regulatory framework. |
North America Blood Plasma and Plasma Derived Medicinal Products Market Trends
“Integration of Modern Healthcare Infrastructure”
- Expansion of advanced hospital networks and specialty care centers is driving higher adoption of plasma-derived medicinal products, as modern facilities are better equipped to administer complex biologic therapies such as immunoglobulins, clotting factors, and albumin.
- Improved cold-chain logistics and storage infrastructure across healthcare systems is supporting the safe handling, transportation, and long-term preservation of plasma-derived products, ensuring product efficacy and reducing wastage.
- Integration of digital health systems and electronic medical records (EMRs) is enhancing treatment tracking, dosing accuracy, and patient monitoring, enabling more efficient and outcome-based use of plasma-derived therapies.
- Strengthening of reimbursement frameworks and insurance coverage within modern healthcare ecosystems is improving patient access to high-cost plasma-derived treatments, particularly for chronic, rare, and life-threatening conditions.
- Adoption of standardized treatment protocols and regulatory-compliant practices in upgraded healthcare infrastructures is ensuring consistent quality, safety, and clinical effectiveness of plasma-derived medicinal products across hospitals and infusion centers.
North America Blood Plasma and Plasma Derived Medicinal Products Market Dynamics
Driver
“Rising Prevalence Of Rare And Chronic Diseases”
- The increasing prevalence of rare and chronic diseases globally is a critical driver for the growth of the blood plasma and Plasma-Derived Medicinal Products (PDMPs) market. Diseases such as Primary Immunodeficiency (PID), hemophilia, von Willebrand disease, alpha-1 antitrypsin deficiency, and various autoimmune and neurological disorders are being diagnosed more frequently due to advancements in diagnostic technologies and improved awareness among healthcare providers and patients.
- Demographic shifts, particularly the aging global population, further amplify demand for PDMPs. Older adults are more prone to chronic and degenerative conditions such as liver cirrhosis, multiple myeloma, chronic inflammatory disorders, and neurological diseases, many of which rely on plasma-derived products for effective management.
- These conditions often require long-term, sometimes lifelong, treatment with plasma-derived therapies such as immunoglobulins, coagulation factors, and albumin. For instance, patients with PID rely heavily on Intravenous Immunoglobulin (IVIG) to maintain immune function, while those with hemophilia require regular infusions of clotting factors to prevent bleeding episodes. The global aging population further contributes to this trend, as older adults are more susceptible to chronic conditions such as liver cirrhosis, multiple myeloma, and chronic inflammatory diseases that also require plasma derived products. In addition, governments and health organizations are increasingly recognizing the burden of rare diseases, resulting in improved disease surveillance, the establishment of national registries, and more inclusive reimbursement policies.
For Instances
- In April 2025, CDC data showed that 76.4% of U.S. adults had at least one chronic condition, with 51.4% facing multiple conditions. This rising trend, including among young adults, highlights the growing burden of chronic diseases such as hemophilia, primary immunodeficiency diseases, and von willebrand disease, demanding greater focus on lifelong care and management.
- In March 2025, research featured in PMC emphasized the substantial global impact of rare diseases, collectively affecting millions worldwide, especially pediatric patients. The review highlights the complex interplay between genetic and environmental factors, as well as the persistent diagnostic challenges and delays. Despite advancements in genomic medicine and orphan drug development, effective treatments remain limited, necessitating comprehensive, multidisciplinary care approaches. This reinforces the ongoing struggle for timely and accurate diagnoses for these often-debilitating conditions
- In February 2025, a study focused on the Middle East and North Africa (MENA) region, published in PMC, underscores the disproportionately high prevalence of rare diseases in this area due to genetic and cultural factors, such as consanguinity. The report highlights critical challenges faced by patients, including limited disease knowledge and delayed diagnoses, despite governments and organizations implementing incentives for orphan drug development. This highlights that, despite global efforts, access to timely treatment for rare diseases remains limited in many region.
Restraint/Challenge
“High Cost and Complex Manufacturing Process”
- The high cost and complexity associated with the manufacturing of Plasma-Derived Medicinal Products (PDMPs) represent a major restraint in the global market. The production process involves multiple intricate stages, beginning with the collection of human plasma under strict medical and regulatory conditions. Each donation must be thoroughly tested for pathogens and other contaminants to ensure the safety and integrity of the source material. The subsequent fractionation and purification processes are technologically advanced, requiring specialized equipment, skilled labor, and a sterile environment.
- Manufacturing can take up to 12 months, from plasma collection to the final product, with each step needing rigorous quality control and compliance with international Good Manufacturing Practices (GMP). In addition, the need for cold-chain logistics throughout storage, transportation, and distribution further increases operational costs. These factors collectively lead to high capital investment and operational expenses, limiting the ability of smaller manufacturers and emerging economies to enter or expand in the market.
For Instances,
- A detailed analysis by Aykon Biosciences highlights that pharmaceutical manufacturing, particularly for complex biologics such as plasma-derived products, faces significant cost management challenges due to rising raw material and labor expenses, combined with increasingly stringent regulatory compliance requirements. The demand for personalized medicine and specialized therapies further drives the need for new, often expensive manufacturing processes. This necessitates substantial investment in advanced technology, highly trained personnel, and rigorous quality control measures, adding considerably to the final product cost.
North America Blood Plasma and Plasma Derived Medicinal Products Market Scope
The North America Blood Plasma and Plasma Derived Medicinal Products Market is segmented into six notable segments based on product, application, by processing technology, mode, end user, and distribution channel.
• By Product
On the basis of application, the market is segmented into Immunoglobulins, Coagulation Factors, Albumin, Protease Inhibitors, Monoclonal Antibodies, and Other Plasma-Derived Proteins. In 2025 the Immunoglobulins type segment is expected to dominate the market with 41.30% share which is driven by the rising prevalence of primary immunodeficiency disorders, autoimmune diseases, and neurological conditions requiring immunoglobulin replacement therapy. Increasing diagnosis rates, expanding therapeutic indications, and growing off-label use in inflammatory and rare disorders further support segment growth.
Coagulation Factors segment projected to be the fastest-growing segment in the global North America Blood Plasma and Plasma Derived Medicinal Products Market, registering a CAGR of approximately 9.4%, this growth is primarily driven by the increasing prevalence of bleeding disorders such as hemophilia A and hemophilia B, along with rising awareness and improved diagnosis rates, particularly in emerging economies. Expanding access to prophylactic treatment, strong support from patient advocacy programs, and favorable reimbursement policies are further accelerating demand.
• By Application
On the basis of application, the market is segmented into immunology, hematology, critical care, neurology, pulmonology, haemato-oncology, rheumatology, and other applications. In 2025, Immunology is dominating segment with 31.24% market share primarily attributed to the rising prevalence of primary and secondary immunodeficiency disorders, autoimmune diseases, and inflammatory conditions requiring long-term immunoglobulin therapy. Increasing awareness, early diagnosis, and expanding clinical indications for plasma-derived immunoglobulins are significantly driving segment growth.
In 2025, the Neurology segment projected to be the fastest-growing segment in the global North America Blood Plasma and Plasma Derived Medicinal Products Market, registering a CAGR of approximately 9.4%, due to the primarily driven by the rising prevalence of neurological disorders such as chronic inflammatory demyelinating polyneuropathy (CIDP), Guillain–Barré syndrome, myasthenia gravis, and multifocal motor neuropathy, where immunoglobulin therapies play a critical role. Increasing clinical acceptance of intravenous immunoglobulin (IVIG) and subcutaneous immunoglobulin (SCIG) for neurological indications, along with expanding research into new therapeutic applications, is further accelerating demand.
• By Technology
On the basis of processing technology, the market is segmented into ion exchange chromatography, affinity chromatography, cryoprecipitation, ultrafiltration, and microfiltration. In 2025, Ion exchange chromatography is the dominating segment with 33.12% share due to primarily attributed to its high efficiency in separating and purifying plasma proteins based on charge differences, ensuring superior product purity and yield. The technology is widely adopted in large-scale plasma fractionation due to its cost-effectiveness, scalability, and compatibility with stringent regulatory standards.
In 2025, the Ultrafiltration segment projected to be the fastest-growing segment in the global North America Blood Plasma and Plasma Derived Medicinal Products Market, registering a CAGR of approximately 9.4%, due to the during the forecast period. This growth is primarily driven by increasing demand for efficient protein concentration and purification processes in plasma fractionation. Ultrafiltration enables precise separation based on molecular size, ensuring high product purity, improved recovery rates, and reduced processing time. The technology is widely utilized for concentration, desalting, and buffer exchange steps in the production of immunoglobulins and other plasma-derived proteins.
• By Mode
On the basis of mode, the market is segmented into modern and traditional plasma fractionation. In 2025, Modern is the dominating segment with 71.84% share due to the widespread adoption of advanced fractionation technologies that offer higher protein yield, enhanced purity levels, and improved safety profiles compared to conventional methods. Modern plasma fractionation integrates sophisticated chromatography techniques, automated processing systems, and stringent viral inactivation and removal steps, ensuring compliance with evolving regulatory standards.
In 2025, the Modern segment is segment projected to be the fastest-growing segment in the global North America Blood Plasma and Plasma Derived Medicinal Products Market, registering a CAGR of approximately 9.0% due to increasing adoption of advanced plasma fractionation technologies that enhance product purity, safety, and overall manufacturing efficiency. Modern processes incorporate automated systems, advanced chromatography techniques, improved viral inactivation methods, and real-time quality monitoring, ensuring compliance with stringent regulatory standards. Rising demand for high-quality immunoglobulins, coagulation factors, and other plasma-derived therapies is accelerating the transition from traditional to technologically advanced fractionation methods.
• By End user
On the basis of end user, the market is segmented into hospitals & clinics, research labs, academic institutes, and others. In 2025, Hospitals & Clinics is the dominating segment with 66.32% share due to high volume of plasma-derived therapies administered in hospital settings for the treatment of immunological disorders, hemophilia, neurological conditions, and critical care cases. Hospitals serve as primary centers for diagnosis, emergency care, surgical procedures, and long-term disease management, resulting in consistent demand for immunoglobulins, coagulation factors, and albumin products.
In 2025, the research labs segment is segment projected to be the fastest-growing segment in the global North America Blood Plasma and Plasma Derived Medicinal Products Market, registering a CAGR of approximately 9.0% due to increasing research activities focused on developing advanced plasma-derived therapies, novel biologics, and improved fractionation techniques. Rising investments in biotechnology and life sciences research, along with expanding clinical trials for rare and immune-related disorders, are accelerating demand for high-quality plasma proteins in laboratory settings. .
• By Distribution Channel
On the basis of distribution channel, the market is segmented into direct tender, retail sales, and others. In 2025, Direct Tenders is the dominating segment with 52.45% share due to attributed to large-scale procurement by government bodies, public healthcare institutions, and major hospital networks through centralized purchasing agreements. Direct tender systems enable bulk purchasing at negotiated prices, ensuring cost efficiency, stable supply, and improved budget management for high-value plasma-derived therapies such as immunoglobulins and coagulation factors.
In 2025, the research labs segment is segment projected to be the fastest-growing segment in the global North America Blood Plasma and Plasma Derived Medicinal Products Market, registering a CAGR of approximately 9.0% due to rising focus on advanced biologics research, increasing clinical trials for rare and immune-related disorders, and expanding development of next-generation plasma-derived therapies. Research laboratories are actively involved in exploring novel therapeutic indications, improving protein purification techniques, and enhancing fractionation efficiency.
North America Blood Plasma and Plasma Derived Medicinal Products Market Regional Analysis
- The U. S. dominates the North America market with a significant share, driven by high healthcare spending, advanced plasma collection & fractionation infrastructure, and broad access to specialty treatments. Strong reimbursement mechanisms and a large patient base for immunological and rare disease therapies further reinforce its leadership.
- Canada is strengthening its position through expanded plasma donation programs, increased capacity for plasma fractionation, and policies supporting equitable access to biologic therapies. Improvements in healthcare infrastructure and rising demand for plasma-derived products for chronic and autoimmune conditions are contributing to steady market growth.
- Across North America, enhanced regulatory frameworks, clinical research initiatives, and strategic collaborations among biopharma companies are accelerating product approvals and market entry. Continued investment in advanced technologies and quality control systems is enabling the broader adoption of plasma-derived medicinal products region-wide.
U.S. North America Blood Plasma and Plasma Derived Medicinal Products Market Insight
The U.S. blood plasma and plasma-derived medicinal products market is driven by a strong plasma collection network, advanced biopharmaceutical manufacturing capabilities, and high healthcare expenditure. Rising prevalence of chronic, autoimmune, and rare diseases is fueling sustained demand for immunoglobulins, clotting factors, and albumin therapies. Supportive reimbursement policies, continuous technological advancements in plasma fractionation, and the presence of major industry players further strengthen market growth and ensure steady expansion across therapeutic applications.
Canada North America Blood Plasma and Plasma Derived Medicinal Products Market Insight
The Canada blood plasma and plasma-derived medicinal products market is supported by expanding healthcare infrastructure and growing demand for therapies used in immunodeficiency, neurological, and rare disease treatment. Government initiatives to strengthen plasma collection programs and reduce reliance on imports are improving domestic supply capabilities. Rising awareness of plasma-based therapies, favorable reimbursement frameworks, and ongoing investments in biologics manufacturing are contributing to steady market growth and improved patient access nationwide.
North America Blood Plasma and Plasma Derived Medicinal Products Market Share
The blood plasma & plasma derived medicinal products industry is primarily led by well-established companies, including:
- CSL Limited (Australia)
- Takeda Pharmaceutical Company Limited (Japan)
- Grifols, S.A. (Spain)
- Octapharma AG (Switzerland)
- Kedrion S.p.A. (Italy)
- ADMA Biologics, Inc. – (U.S.)
- Aegros (Australia)
- Bharat Serums (India)
- Biotest AG (Germany)
- Fresenius Kabi AG (Germany)
- GC Biopharma Corporate (South Korea)
- ICHOR (India)
- Intas Pharmaceuticals Ltd (India)
- Kamada Pharmaceuticals (Israel)
- KM Biologics (Japan)
- LFB (France)
- PlasmaGen BioSciences Pvt. Ltd. (India)
- Proliant Health & Biologicals (U.S.)
- Promea (India)
- Reliance Life Sciences (India)
- Sichuan Yuanda Shyuang Pharmaceutical Co., Ltd. (China)
- SK Plasma (South Korea)
- Synthaverse S.A. (Poland)
- Taibang Bio Group Co., Ltd. (China)
- VIRCHOW BIOTECH (India)
Latest Developments in North America Blood Plasma and Plasma Derived Medicinal Products Market
- In November 2025, CSL announced a planned ~US$1.5 billion capital investment in the U.S. to expand its manufacturing footprint for plasma-derived therapies over the next five years. This investment is intended to strengthen domestic production, secure supply chains for critical products like immunoglobulins and other plasma-derived medicines, and generate hundred of skilled jobs in the U.S. manufacturing sector. This builds on more than US$3 billion already invested in U.S. operations since 2018.
- In October 2025, CSL’s Broadmeadows plasma fractionation facility in Victoria, Australia was recognized as a Facility of the Year winner by the International Society for Pharmaceutical Engineering (ISPE) in 2025. This facility one of the world’s largest for plasma processing uses advanced automation, robotics, digital twin technology, and sustainability features to significantly boost plasma processing capacity (over 10 million liters annually) and improve manufacturing efficiency.
- In February, Octapharma completed a USD 216 million USD expansion at its Vienna site, increasing production capacity by 50%, adding 160 jobs, and enhancing packaging, visual inspection, and logistics facilities—strengthening global supply of plasma derived therapies for haemophilia, immunology, and critical care.
- In November 2024, CSL Plasma expanded its adoption of the advanced Rika Plasma Donation System across six U.S. donation centers near Denver, Colorado. These new devices, developed jointly with Terumo Blood & Cell Technologies, cut collection times by ~30% while improving donor comfort, safety, and efficiency.
- In June 2024, Takeda announced a USD 30 million expansion of its Los Angeles plasma‑fractionation facility, its global leader per capacity. This upgrade is expected to add up to 2 million liters/year of production volume, helping to meet rising global demand for plasma‑derived therapies used in treating immunodeficiencies and bleeding disorders.
SKU-

- Interactive Data Analysis Dashboard
- Company Analysis Dashboard for high growth potential opportunities
- Research Analyst Access for customization & queries
- Competitor Analysis with Interactive dashboard
- Latest News, Updates & Trend analysis
- Harness the Power of Benchmark Analysis for Comprehensive Competitor Tracking
Table of Content
1 INTRODUCTION
1.1 OBJECTIVES OF THE STUDY
1.2 MARKET DEFINITION
1.3 OVERVIEW OF THE NORTH AMERICA BLOOD PLASMA & PLASMA DERIVED MEDICINAL PRODUCTS MARKET
1.4 LIMITATIONS
1.5 MARKETS COVERED
2 MARKET SEGMENTATION
2.1 MARKETS COVERED
2.2 GEOGRAPHICAL SCOPE
2.3 YEARS CONSIDERED FOR THE STUDY
2.4 CURRENCY AND PRICING
2.5 DBMR TRIPOD DATA VALIDATION MODEL
2.6 MULTIVARIATE MODELLING
2.7 PRODUCT LIFELINE CURVE
2.8 PRIMARY INTERVIEWS WITH KEY OPINION LEADERS
2.9 DBMR MARKET POSITION GRID
2.1 MARKET END USER COVERAGE GRID
2.11 VENDOR SHARE ANALYSIS
2.12 SECONDARY SOURCES
2.13 ASSUMPTIONS
3 EXECUTIVE SUMMARY
4 PREMIUM INSIGHTS
4.1 PESTEL ANALYSIS
4.1.1 POLITICAL FACTORS
4.1.2 ECONOMIC FACTORS
4.1.3 SOCIAL FACTORS
4.1.4 TECHNOLOGICAL FACTORS
4.1.5 LEGAL FACTORS
4.1.6 ENVIRONMENTAL FACTORS
4.2 PORTER’S FIVE FORCES
4.2.1 THREAT OF NEW ENTRANTS
4.2.2 BARGAINING POWER OF SUPPLIERS
4.2.3 BARGAINING POWER OF BUYERS
4.2.4 THREAT OF SUBSTITUTES
4.2.5 COMPETITIVE RIVALRY
4.3 INNOVATION STRATEGIES
4.3.1 KEY INNOVATION STRATEGIES
4.3.2 EMERGING DELIVERY TECHNIQUES
4.3.3 STRATEGIC IMPLICATIONS
4.3.4 CONCLUSION
4.4 INNOVATION STRATEGIES
4.4.1 KEY INNOVATION STRATEGIES
4.4.2 EMERGING DELIVERY TECHNIQUES
4.4.3 STRATEGIC IMPLICATIONS
4.4.4 CONCLUSION
4.5 SUPPLY CHAIN ANALYSIS
4.5.1 OVERVIEW
4.5.2 RAW MATERIAL AVAILABILITY
4.5.3 MANUFACTURING CAPACITY
4.5.4 LOGISTICS AND LAST-MILE HURDLES
4.5.5 PRICING MODELS AND MARKET POSITIONING
4.6 RISK AND MITIGATION
4.7 VENDOR SELECTION DYNAMICS
4.7.1 PRODUCT QUALITY AND REGULATORY EXCELLENCE
4.7.2 PLASMA SUPPLY SECURITY AND SUPPLY CHAIN RESILIENCE
4.7.3 CLINICAL PERFORMANCE, INDICATION BREADTH, AND INNOVATION
4.7.4 COST STRUCTURE, CONTRACT FLEXIBILITY, AND REIMBURSEMENT ALIGNMENT
4.7.5 GEOGRAPHIC FOOTPRINT AND LOCAL MARKET SUPPORT
4.7.6 ETHICAL PLASMA SOURCING, ESG COMMITMENTS, AND TRANSPARENCY
4.7.7 STRATEGIC PARTNERSHIPS AND LONG-TERM VALUE CREATION
4.7.8 CONCLUSION
5 TARIFFS & IMPACT ON THE MARKET
5.1 CURRENT TARIFF RATES IN TOP-5 COUNTRY MARKETS
5.2 OUTLOOK: LOCAL PRODUCTION VS. IMPORT RELIANCE
5.3 VENDOR SELECTION CRITERIA DYNAMICS
5.4 IMPACT ON SUPPLY CHAIN
5.4.1 PLASMA COLLECTION & RAW MATERIAL AVAILABILITY
5.4.2 MANUFACTURING AND FRACTIONATION
5.4.3 LOGISTICS AND DISTRIBUTION
5.4.4 PRICING AND MARKET POSITIONING
5.5 INDUSTRY PARTICIPANTS: PROACTIVE MOVES
5.5.1 SUPPLY CHAIN OPTIMIZATION
5.5.2 STRATEGIC PARTNERSHIPS & JOINT VENTURES
5.6 IMPACT ON PRICES
5.7 REGULATORY INCLINATION
5.7.1 GCC TRADE ALIGNMENT & FTAS
5.7.2 SPECIAL ZONES AND RE-EXPORT MODELS
5.7.3 LOCAL SUBSIDY & POLICY RESPONSE
5.7.4 DOMESTIC COURSE OF CORRECTION
6 REGULATION COVERAGE
7 MARKET OVERVIEW
7.1 DRIVER
7.1.1 RISING PREVALENCE OF RARE AND CHRONIC DISEASES
7.1.2 EXPANDING GERIATRIC POPULATION
7.1.3 TECHNOLOGICAL ADVANCEMENTS IN PLASMA FRACTIONATION
7.1.4 GOVERNMENT AND INSTITUTIONAL SUPPORT
7.2 RESTRAINTS
7.2.1 HIGH COST AND COMPLEX MANUFACTURING PROCESS
7.2.2 LACK OF PLASMA SUPPLY AND DONOR
7.3 OPPORTUNITIES
7.3.1 ADVANCEMENTS IN PLASMA PROCESSING TECHNOLOGIES TO ENHANCE YIELD AND REDUCE COSTS
7.3.2 REIMBURSEMENT FRAMEWORKS AND INCREASED GOVERNMENTAL FOCUS ON RARE DISEASE TREATMENT
7.3.3 STRATEGIC ALLIANCES, MERGERS, AND ACQUISITIONS TO STRENGTHEN NORTH AMERICA MARKET PENETRATION
7.4 CHALLENGES
7.4.1 COMPETITIVE PRESSURE FROM RECOMBINANT AND ALTERNATIVE BIOLOGICAL THERAPIES
7.4.2 INFRASTRUCTURE LIMITATIONS IN COLD CHAIN LOGISTICS IMPACTING PRODUCT DISTRIBUTION
8 NORTH AMERICA BLOOD PLASMA AND PLASMA DERIVED MEDICINAL PRODUCTS MARKET, BY PRODUCT
8.1 OVERVIEW
8.2 IMMUNOGLOBULINS
8.3 COAGULATION FACTORS
8.4 ALBUMIN
8.5 PROTEASE INHIBITORS
8.6 MONOCLONAL ANTIBODIES
8.7 OTHER PLASMA DERIVED PROTEINS
8.8 NORTH AMERICA IMMUNOGLOBULINS IN BLOOD PLASMA & PLASMA DERIVED MEDICINAL PRODUCTS MARKET, BY REGION, 2018-2033 (USD THOUSAND)
8.8.1 NORTH AMERICA
8.8.2 EUROPE
8.8.3 ASIA-PACIFIC
8.8.4 SOUTH AMERICA
8.8.5 MIDDLE EAST AND AFRICA
8.9 NORTH AMERICA COAGULATION FACTORS IN BLOOD PLASMA & PLASMA DERIVED MEDICINAL PRODUCTS MARKET, BY REGION, 2018-2033 (USD THOUSAND)
8.9.1 NORTH AMERICA
8.9.2 EUROPE
8.9.3 ASIA-PACIFIC
8.9.4 SOUTH AMERICA
8.9.5 MIDDLE EAST AND AFRICA
8.1 NORTH AMERICA ALBUMIN IN BLOOD PLASMA & PLASMA DERIVED MEDICINAL PRODUCTS MARKET, BY REGION, 2018-2033 (USD THOUSAND)
8.10.1 NORTH AMERICA
8.10.2 EUROPE
8.10.3 ASIA-PACIFIC
8.10.4 SOUTH AMERICA
8.10.5 MIDDLE EAST AND AFRICA
8.11 NORTH AMERICA PROTEASE INHIBITORS IN BLOOD PLASMA & PLASMA DERIVED MEDICINAL PRODUCTS MARKET, BY REGION, 2018-2033 (USD THOUSAND)
8.11.1 NORTH AMERICA
8.11.2 EUROPE
8.11.3 ASIA-PACIFIC
8.11.4 SOUTH AMERICA
8.11.5 MIDDLE EAST AND AFRICA
8.12 NORTH AMERICA MONOCLONAL ANTIBODIES IN BLOOD PLASMA & PLASMA DERIVED MEDICINAL PRODUCTS MARKET, BY REGION, 2018-2033 (USD THOUSAND)
8.12.1 NORTH AMERICA
8.12.2 EUROPE
8.12.3 ASIA-PACIFIC
8.12.4 SOUTH AMERICA
8.12.5 MIDDLE EAST AND AFRICA
8.13 NORTH AMERICA OTHER PLASMA DERIVED PROTEINS IN BLOOD PLASMA & PLASMA DERIVED MEDICINAL PRODUCTS MARKET, BY REGION, 2018-2033 (USD THOUSAND)
8.13.1 NORTH AMERICA
8.13.2 EUROPE
8.13.3 ASIA-PACIFIC
8.13.4 SOUTH AMERICA
8.13.5 MIDDLE EAST AND AFRICA
9 NORTH AMERICA BLOOD PLASMA AND PLASMA DERIVED MEDICINAL PRODUCTS MARKET, BY APPLICATION
9.1 OVERVIEW
9.2 IMMUNOLOGY
9.3 HAEMATOLOGY
9.4 CRITICAL CARE
9.5 NEUROLOGY
9.6 PULMONOLOGY
9.7 HAEMATO-ONCOLOGY
9.8 RHEUMATOLOGY
9.9 OTHER APPLICATIONS
9.1 NORTH AMERICA IMMUNOLOGY IN BLOOD PLASMA & PLASMA DERIVED MEDICINAL PRODUCTS MARKET, BY REGION, 2018-2033 (USD THOUSAND)
9.10.1 NORTH AMERICA
9.10.2 EUROPE
9.10.3 ASIA-PACIFIC
9.10.4 SOUTH AMERICA
9.10.5 MIDDLE EAST AND AFRICA
9.11 NORTH AMERICA HAEMATOLOGY IN BLOOD PLASMA & PLASMA DERIVED MEDICINAL PRODUCTS MARKET, BY REGION, 2018-2033 (USD THOUSAND)
9.11.1 NORTH AMERICA
9.11.2 EUROPE
9.11.3 ASIA-PACIFIC
9.11.4 SOUTH AMERICA
9.11.5 MIDDLE EAST AND AFRICA
9.12 NORTH AMERICA CRITICAL CARE IN BLOOD PLASMA & PLASMA DERIVED MEDICINAL PRODUCTS MARKET, BY REGION, 2018-2033 (USD THOUSAND)
9.12.1 NORTH AMERICA
9.12.2 EUROPE
9.12.3 ASIA-PACIFIC
9.12.4 SOUTH AMERICA
9.12.5 MIDDLE EAST AND AFRICA
9.13 NORTH AMERICA NEUROLOGY IN BLOOD PLASMA & PLASMA DERIVED MEDICINAL PRODUCTS MARKET, BY REGION, 2018-2033 (USD THOUSAND)
9.13.1 NORTH AMERICA
9.13.2 EUROPE
9.13.3 ASIA-PACIFIC
9.13.4 SOUTH AMERICA
9.13.5 MIDDLE EAST AND AFRICA
9.14 NORTH AMERICA PULMONOLOGY IN BLOOD PLASMA & PLASMA DERIVED MEDICINAL PRODUCTS MARKET, BY REGION, 2018-2033 (USD THOUSAND)
9.14.1 NORTH AMERICA
9.14.2 EUROPE
9.14.3 ASIA-PACIFIC
9.14.4 SOUTH AMERICA
9.14.5 MIDDLE EAST AND AFRICA
9.15 NORTH AMERICA HAEMATO-ONCOLOGY IN BLOOD PLASMA & PLASMA DERIVED MEDICINAL PRODUCTS MARKET, BY REGION, 2018-2033 (USD THOUSAND)
9.15.1 NORTH AMERICA
9.15.2 EUROPE
9.15.3 ASIA-PACIFIC
9.15.4 SOUTH AMERICA
9.15.5 MIDDLE EAST AND AFRICA
9.16 NORTH AMERICA RHEUMATOLOGY IN BLOOD PLASMA & PLASMA DERIVED MEDICINAL PRODUCTS MARKET, BY REGION, 2018-2033 (USD THOUSAND)
9.16.1 NORTH AMERICA
9.16.2 EUROPE
9.16.3 ASIA-PACIFIC
9.16.4 SOUTH AMERICA
9.16.5 MIDDLE EAST AND AFRICA
9.17 NORTH AMERICA OTHER APPLICATIONS IN BLOOD PLASMA & PLASMA DERIVED MEDICINAL PRODUCTS MARKET, BY REGION, 2018-2033 (USD THOUSAND)
9.17.1 NORTH AMERICA
9.17.2 EUROPE
9.17.3 ASIA-PACIFIC
9.17.4 SOUTH AMERICA
9.17.5 MIDDLE EAST AND AFRICA
10 NORTH AMERICA BLOOD PLASMA AND PLASMA DERIVED MEDICINAL PRODUCTS MARKET, BY TECHNOLOGY
10.1 OVERVIEW
10.2 ION EXCHANGE CHROMATOGRAPHY
10.3 AFFINITY CHROMATOGRAPHY
10.4 CRYOPRECIPITATION
10.5 ULTRAFILTRATION
10.6 MICROFILTRATION
10.7 NORTH AMERICA ION EXCHANGE CHROMATOGRAPHY IN BLOOD PLASMA & PLASMA DERIVED MEDICINAL PRODUCTS MARKET, BY REGION, 2018-2033 (USD THOUSAND)
10.7.1 NORTH AMERICA
10.7.2 EUROPE
10.7.3 ASIA-PACIFIC
10.7.4 SOUTH AMERICA
10.7.5 MIDDLE EAST AND AFRICA
10.8 NORTH AMERICA AFFINITY CHROMATOGRAPHY IN BLOOD PLASMA & PLASMA DERIVED MEDICINAL PRODUCTS MARKET, BY REGION, 2018-2033 (USD THOUSAND)
10.8.1 NORTH AMERICA
10.8.2 EUROPE
10.8.3 ASIA-PACIFIC
10.8.4 SOUTH AMERICA
10.8.5 MIDDLE EAST AND AFRICA
10.9 NORTH AMERICA CRYOPRECIPITATION IN BLOOD PLASMA & PLASMA DERIVED MEDICINAL PRODUCTS MARKET, BY REGION, 2018-2033 (USD THOUSAND)
10.9.1 NORTH AMERICA
10.9.2 EUROPE
10.9.3 ASIA-PACIFIC
10.9.4 SOUTH AMERICA
10.9.5 MIDDLE EAST AND AFRICA
10.1 NORTH AMERICA ULTRAFILTRATION IN BLOOD PLASMA & PLASMA DERIVED MEDICINAL PRODUCTS MARKET, BY REGION, 2018-2033 (USD THOUSAND)
10.10.1 NORTH AMERICA
10.10.2 EUROPE
10.10.3 ASIA-PACIFIC
10.10.4 SOUTH AMERICA
10.10.5 MIDDLE EAST AND AFRICA
10.11 NORTH AMERICA MICROFILTRATION IN BLOOD PLASMA & PLASMA DERIVED MEDICINAL PRODUCTS MARKET, BY REGION, 2018-2033 (USD THOUSAND)
10.11.1 NORTH AMERICA
10.11.2 EUROPE
10.11.3 ASIA-PACIFIC
10.11.4 SOUTH AMERICA
10.11.5 MIDDLE EAST AND AFRICA
11 NORTH AMERICA BLOOD PLASMA AND PLASMA DERIVED MEDICINAL PRODUCTS MARKET, BY MODE
11.1 OVERVIEW
11.2 MODERN
11.3 TRADITIONAL PLASMA FRACTIONATION
11.4 NORTH AMERICA MODERN IN BLOOD PLASMA & PLASMA DERIVED MEDICINAL PRODUCTS MARKET, BY REGION, 2018-2033 (USD THOUSAND)
11.4.1 NORTH AMERICA
11.4.2 EUROPE
11.4.3 ASIA-PACIFIC
11.4.4 SOUTH AMERICA
11.4.5 MIDDLE EAST AND AFRICA
11.5 NORTH AMERICA TRADITIONAL PLASMA FRACTIONATION IN BLOOD PLASMA & PLASMA DERIVED MEDICINAL PRODUCTS MARKET, BY REGION, 2018-2033 (USD THOUSAND)
11.5.1 NORTH AMERICA
11.5.2 EUROPE
11.5.3 ASIA-PACIFIC
11.5.4 SOUTH AMERICA
11.5.5 MIDDLE EAST AND AFRICA
12 NORTH AMERICA BLOOD PLASMA AND PLASMA DERIVED MEDICINAL PRODUCTS MARKET, BY END USER
12.1 OVERVIEW
12.2 HOSPITALS & CLINICS
12.3 RESEARCH LABS
12.4 ACADEMIC INSTITUTES
12.5 OTHERS
12.6 NORTH AMERICA HOSPITALS & CLINICS IN BLOOD PLASMA & PLASMA DERIVED MEDICINAL PRODUCTS MARKET, BY REGION, 2018-2033 (USD THOUSAND)
12.6.1 NORTH AMERICA
12.6.2 EUROPE
12.6.3 ASIA-PACIFIC
12.6.4 SOUTH AMERICA
12.6.5 MIDDLE EAST AND AFRICA
12.7 NORTH AMERICA RESEARCH LABS IN BLOOD PLASMA & PLASMA DERIVED MEDICINAL PRODUCTS MARKET, BY REGION, 2018-2033 (USD THOUSAND)
12.7.1 NORTH AMERICA
12.7.2 EUROPE
12.7.3 ASIA-PACIFIC
12.7.4 SOUTH AMERICA
12.7.5 MIDDLE EAST AND AFRICA
12.8 NORTH AMERICA ACADEMIC INSTITUTES IN BLOOD PLASMA & PLASMA DERIVED MEDICINAL PRODUCTS MARKET, BY REGION, 2018-2033 (USD THOUSAND)
12.8.1 NORTH AMERICA
12.8.2 EUROPE
12.8.3 ASIA-PACIFIC
12.8.4 SOUTH AMERICA
12.8.5 MIDDLE EAST AND AFRICA
12.9 NORTH AMERICA OTHERS IN BLOOD PLASMA & PLASMA DERIVED MEDICINAL PRODUCTS MARKET, BY REGION, 2018-2033 (USD THOUSAND)
12.9.1 NORTH AMERICA
12.9.2 EUROPE
12.9.3 ASIA-PACIFIC
12.9.4 SOUTH AMERICA
12.9.5 MIDDLE EAST AND AFRICA
13 NORTH AMERICA BLOOD PLASMA AND PLASMA DERIVED MEDICINAL PRODUCTS MARKET, BY DISTRIBUTION CHANNEL
13.1 OVERVIEW
13.2 DIRECT TENDERS
13.3 THIRD PARTY DISTRIBUTORS
13.4 OTHERS
13.5 NORTH AMERICA DIRECT TENDERS IN BLOOD PLASMA & PLASMA DERIVED MEDICINAL PRODUCTS MARKET, BY REGION, 2018-2033 (USD THOUSAND)
13.5.1 NORTH AMERICA
13.5.2 EUROPE
13.5.3 ASIA-PACIFIC
13.5.4 SOUTH AMERICA
13.5.5 MIDDLE EAST AND AFRICA
13.6 NORTH AMERICA THIRD PARTY DISTRIBUTORS IN BLOOD PLASMA & PLASMA DERIVED MEDICINAL PRODUCTS MARKET, BY REGION, 2018-2033 (USD THOUSAND)
13.6.1 NORTH AMERICA
13.6.2 EUROPE
13.6.3 ASIA-PACIFIC
13.6.4 SOUTH AMERICA
13.6.5 MIDDLE EAST AND AFRICA
13.7 NORTH AMERICA OTHERS IN BLOOD PLASMA & PLASMA DERIVED MEDICINAL PRODUCTS MARKET, BY REGION, 2018-2033 (USD THOUSAND)
13.7.1 NORTH AMERICA
13.7.2 EUROPE
13.7.3 ASIA-PACIFIC
13.7.4 SOUTH AMERICA
13.7.5 MIDDLE EAST AND AFRICA
14 NORTH AMERICA BLOOD PLASMA & PLASMA DERIVED MEDICINAL PRODUCTS MARKET, BY REGION
14.1 NORTH AMERICA
14.1.1 U.S.
14.1.2 CANADA
14.1.3 MEXICO
15 NORTH AMERICA BLOOD PLASMA AND PLASMA DERIVED MEDICINAL PRODUCTS MARKET: COMPANY LANDSCAPE
15.1 COMPANY SHARE ANALYSIS: GLOBAL
16 SWOT ANALYSIS
17 COMPANY PROFILE
17.1 CSL
17.1.1 COMPANY SNAPSHOT
17.1.2 REVENUE ANALYSIS
17.1.3 COMPANY SHARE ANALYSIS
17.1.4 PRODUCT PORTFOLIO
17.1.5 RECENT DEVELOPMENT
17.2 TAKEDA PHARMACEUTICAL COMPANY LIMITED
17.2.1 COMPANY SNAPSHOT
17.2.2 REVENUE ANALYSIS
17.2.3 COMPANY SHARE ANALYSIS
17.2.4 PRODUCT PORTFOLIO
17.2.5 RECENT DEVELOPMENT
17.3 GRIFOLS, S.A.
17.3.1 COMPANY SNAPSHOT
17.3.2 REVENUE ANALYSIS
17.3.3 COMPANY SHARE ANALYSIS
17.3.4 PRODUCT PORTFOLIO
17.3.5 RECENT DEVELOPMENT
17.4 OCTAPHARMA AG
17.4.1 COMPANY SNAPSHOT
17.4.2 COMPANY SHARE ANALYSIS
17.4.3 PRODUCT PORTFOLIO
17.4.4 RECENT DEVELOPMENT
17.5 KEDRION
17.5.1 COMPANY SNAPSHOT
17.5.2 COMPANY SHARE ANALYSIS
17.5.3 PRODUCT PORTFOLIO
17.5.4 RECENT DEVELOPMENT
17.6 ADMA BIOLOGICS, INC
17.6.1 COMPANY SNAPSHOT
17.6.2 REVENUE ANALYSIS
17.6.3 PRODUCT PORTFOLIO
17.6.4 RECENT DEVELOPMENT
17.7 AEGROS
17.7.1 COMPANY SNAPSHOT
17.7.2 PRODUCT PORTFOLIO
17.7.3 RECENT DEVELOPMENT
17.8 BHARAT SERUMS
17.8.1 COMPANY SNAPSHOT
17.8.2 PRODUCT PORTFOLIO
17.8.3 RECENT DEVELOPMENT
17.9 BIOTEST AG.
17.9.1 COMPANY SNAPSHOT
17.9.2 REVENUE ANALYSIS
17.9.3 PRODUCT PORTFOLIO
17.9.4 RECENT DEVELOPMENT
17.1 FRESENIUS KABI AG
17.10.1 COMPANY SNAPSHOT
17.10.2 PRODUCT PORTFOLIO
17.10.3 RECENT DEVELOPMENT
17.11 GC BIOPHARMA CORPORATE
17.11.1 COMPANY SNAPSHOT
17.11.2 REVENUE ANALYSIS
17.11.3 PRODUCT PORTFOLIO
17.11.4 RECENT DEVELOPMENT
17.12 ICHOR
17.12.1 COMPANY SNAPSHOT
17.12.2 PRODUCT PORTFOLIO
17.12.3 RECENT DEVELOPMENT
17.13 INTAS PHARMACEUTICALS LTD.
17.13.1 COMPANY SNAPSHOT
17.13.2 PRODUCT PORTFOLIO
17.13.3 RECENT DEVELOPMENT
17.14 KAMADA PHARMACEUTICALS
17.14.1 COMPANY SNAPSHOT
17.14.2 REVENUE ANALYSIS
17.14.3 PRODUCT PORTFOLIO
17.14.4 RECENT DEVELOPMENT
17.15 KM BIOLOGICS
17.15.1 COMPANY SNAPSHOT
17.15.2 PRODUCT PORTFOLIO
17.15.3 RECENT DEVELOPMENT
17.16 LFB
17.16.1 COMPANY SNAPSHOT
17.16.2 THERAPY PORTFOLIO
17.16.3 RECENT DEVELOPMENT
17.17 PLASMAGEN BIOSCIENCES PVT. LTD.
17.17.1 COMPANY SNAPSHOT
17.17.2 PRODUCT PORTFOLIO
17.17.3 RECENT DEVELOPMENT
17.18 PROLIANT HEALTH & BIOLOGICALS
17.18.1 COMPANY SNAPSHOT
17.18.2 PRODUCT PORTFOLIO
17.18.3 RECENT DEVELOPMENT
17.19 PROMEA
17.19.1 COMPANY SNAPSHOT
17.19.2 PRODUCT PORTFOLIO
17.19.3 RECENT DEVELOPMENT
17.2 RELIANCE LIFE SCIENCES.
17.20.1 COMPANY SNAPSHOT
17.20.2 PRODUCT PORTFOLIO
17.20.3 RECENT DEVELOPMENT
17.21 SICHUAN YUANDA SHYUANG PHARMACEUTICAL CO., LTD.
17.21.1 COMPANY SNAPSHOT
17.21.2 PRODUCT PORTFOLIO
17.21.3 RECENT DEVELOPMENT
17.22 SK PLASMA
17.22.1 COMPANY SNAPSHOT
17.22.2 PRODUCT PORTFOLIO
17.22.3 RECENT DEVELOPMENT
17.23 SYNTHAVERSE S. A.
17.23.1 COMPANY SNAPSHOT
17.23.2 REVENUE ANALYSIS
17.23.3 PRODUCT PORTFOLIO
17.23.4 RECENT DEVELOPMENT
17.24 TAIBANG BIO GROUP CO., LTD
17.24.1 COMPANY SNAPSHOT
17.24.2 PRODUCT PORTFOLIO
17.24.3 RECENT DEVELOPMENT
17.25 VIRCHOW BIOTECH
17.25.1 COMPANY SNAPSHOT
17.25.2 PRODUCT PORTFOLIO
17.25.3 RECENT DEVELOPMENT
18 QUESTIONNAIRE
19 RELATED REPORTS
List of Table
TABLE 1 NORTH AMERICA BLOOD PLASMA & PLASMA DERIVED MEDICINAL PRODUCTS MARKET, BY PRODUCT, 2018-2033 (USD THOUSAND)
TABLE 2 NORTH AMERICA IMMUNOGLOBULINS IN BLOOD PLASMA & PLASMA DERIVED MEDICINAL PRODUCTS MARKET, BY REGION, 2018-2033 (USD THOUSAND)
TABLE 3 NORTH AMERICA COAGULATION FACTORS IN BLOOD PLASMA & PLASMA DERIVED MEDICINAL PRODUCTS MARKET, BY REGION, 2018-2033 (USD THOUSAND)
TABLE 4 NORTH AMERICA ALBUMIN IN BLOOD PLASMA & PLASMA DERIVED MEDICINAL PRODUCTS MARKET, BY REGION, 2018-2033 (USD THOUSAND)
TABLE 5 NORTH AMERICA PROTEASE INHIBITORS IN BLOOD PLASMA & PLASMA DERIVED MEDICINAL PRODUCTS MARKET, BY REGION, 2018-2033 (USD THOUSAND)
TABLE 6 NORTH AMERICA MONOCLONAL ANTIBODIES IN BLOOD PLASMA & PLASMA DERIVED MEDICINAL PRODUCTS MARKET, BY REGION, 2018-2033 (USD THOUSAND)
TABLE 7 NORTH AMERICA OTHER PLASMA DERIVED PROTEINS IN BLOOD PLASMA & PLASMA DERIVED MEDICINAL PRODUCTS MARKET, BY REGION, 2018-2033 (USD THOUSAND)
TABLE 8 NORTH AMERICA BLOOD PLASMA & PLASMA DERIVED MEDICINAL PRODUCTS MARKET, BY APPLICATION, 2018-2033 (USD THOUSAND)
TABLE 9 NORTH AMERICA IMMUNOLOGY IN BLOOD PLASMA & PLASMA DERIVED MEDICINAL PRODUCTS MARKET, BY REGION, 2018-2033 (USD THOUSAND)
TABLE 10 NORTH AMERICA HAEMATOLOGY IN BLOOD PLASMA & PLASMA DERIVED MEDICINAL PRODUCTS MARKET, BY REGION, 2018-2033 (USD THOUSAND)
TABLE 11 NORTH AMERICA CRITICAL CARE IN BLOOD PLASMA & PLASMA DERIVED MEDICINAL PRODUCTS MARKET, BY REGION, 2018-2033 (USD THOUSAND)
TABLE 12 NORTH AMERICA NEUROLOGY IN BLOOD PLASMA & PLASMA DERIVED MEDICINAL PRODUCTS MARKET, BY REGION, 2018-2033 (USD THOUSAND)
TABLE 13 NORTH AMERICA PULMONOLOGY IN BLOOD PLASMA & PLASMA DERIVED MEDICINAL PRODUCTS MARKET, BY REGION, 2018-2033 (USD THOUSAND)
TABLE 14 NORTH AMERICA HAEMATO-ONCOLOGY IN BLOOD PLASMA & PLASMA DERIVED MEDICINAL PRODUCTS MARKET, BY REGION, 2018-2033 (USD THOUSAND)
TABLE 15 NORTH AMERICA RHEUMATOLOGY IN BLOOD PLASMA & PLASMA DERIVED MEDICINAL PRODUCTS MARKET, BY REGION, 2018-2033 (USD THOUSAND)
TABLE 16 NORTH AMERICA OTHER APPLICATIONS IN BLOOD PLASMA & PLASMA DERIVED MEDICINAL PRODUCTS MARKET, BY REGION, 2018-2033 (USD THOUSAND)
TABLE 17 NORTH AMERICA BLOOD PLASMA & PLASMA DERIVED MEDICINAL PRODUCTS MARKET, BY TECHNOLOGY, 2018-2033 (USD THOUSAND)
TABLE 18 NORTH AMERICA ION EXCHANGE CHROMATOGRAPHY IN BLOOD PLASMA & PLASMA DERIVED MEDICINAL PRODUCTS MARKET, BY REGION, 2018-2033 (USD THOUSAND)
TABLE 19 NORTH AMERICA AFFINITY CHROMATOGRAPHY IN BLOOD PLASMA & PLASMA DERIVED MEDICINAL PRODUCTS MARKET, BY REGION, 2018-2033 (USD THOUSAND)
TABLE 20 NORTH AMERICA CRYOPRECIPITATION IN BLOOD PLASMA & PLASMA DERIVED MEDICINAL PRODUCTS MARKET, BY REGION, 2018-2033 (USD THOUSAND)
TABLE 21 NORTH AMERICA ULTRAFILTRATION IN BLOOD PLASMA & PLASMA DERIVED MEDICINAL PRODUCTS MARKET, BY REGION, 2018-2033 (USD THOUSAND)
TABLE 22 NORTH AMERICA MICROFILTRATION IN BLOOD PLASMA & PLASMA DERIVED MEDICINAL PRODUCTS MARKET, BY REGION, 2018-2033 (USD THOUSAND)
TABLE 23 NORTH AMERICA BLOOD PLASMA & PLASMA DERIVED MEDICINAL PRODUCTS MARKET, BY MODE, 2018-2033 (USD THOUSAND)
TABLE 24 NORTH AMERICA MODERN IN BLOOD PLASMA & PLASMA DERIVED MEDICINAL PRODUCTS MARKET, BY REGION, 2018-2033 (USD THOUSAND)
TABLE 25 NORTH AMERICA TRADITIONAL PLASMA FRACTIONATION IN BLOOD PLASMA & PLASMA DERIVED MEDICINAL PRODUCTS MARKET, BY REGION, 2018-2033 (USD THOUSAND)
TABLE 26 NORTH AMERICA BLOOD PLASMA & PLASMA DERIVED MEDICINAL PRODUCTS MARKET, BY END USER, 2018-2033 (USD THOUSAND)
TABLE 27 NORTH AMERICA HOSPITALS & CLINICS IN BLOOD PLASMA & PLASMA DERIVED MEDICINAL PRODUCTS MARKET, BY REGION, 2018-2033 (USD THOUSAND)
TABLE 28 NORTH AMERICA RESEARCH LABS IN BLOOD PLASMA & PLASMA DERIVED MEDICINAL PRODUCTS MARKET, BY REGION, 2018-2033 (USD THOUSAND)
TABLE 29 NORTH AMERICA ACADEMIC INSTITUTES IN BLOOD PLASMA & PLASMA DERIVED MEDICINAL PRODUCTS MARKET, BY REGION, 2018-2033 (USD THOUSAND)
TABLE 30 NORTH AMERICA OTHERS IN BLOOD PLASMA & PLASMA DERIVED MEDICINAL PRODUCTS MARKET, BY REGION, 2018-2033 (USD THOUSAND)
TABLE 31 NORTH AMERICA BLOOD PLASMA & PLASMA DERIVED MEDICINAL PRODUCTS MARKET, BY DISTRIBUTION CHANNEL, 2018-2033 (USD THOUSAND)
TABLE 32 NORTH AMERICA DIRECT TENDERS IN BLOOD PLASMA & PLASMA DERIVED MEDICINAL PRODUCTS MARKET, BY REGION, 2018-2033 (USD THOUSAND)
TABLE 33 NORTH AMERICA THIRD PARTY DISTRIBUTORS IN BLOOD PLASMA & PLASMA DERIVED MEDICINAL PRODUCTS MARKET, BY REGION, 2018-2033 (USD THOUSAND)
TABLE 34 NORTH AMERICA OTHERS IN BLOOD PLASMA & PLASMA DERIVED MEDICINAL PRODUCTS MARKET, BY REGION, 2018-2033 (USD THOUSAND)
TABLE 35 NORTH AMERICA BLOOD PLASMA & PLASMA DERIVED MEDICINAL PRODUCTS MARKET, BY COUNTRY, 2018-2033 (USD THOUSAND)
TABLE 36 NORTH AMERICA BLOOD PLASMA & PLASMA DERIVED MEDICINAL PRODUCTS MARKET, BY PRODUCT, 2018-2033 (USD THOUSAND)
TABLE 37 NORTH AMERICA BLOOD PLASMA & PLASMA DERIVED MEDICINAL PRODUCTS MARKET, BY APPLICATION, 2018-2033 (USD THOUSAND)
TABLE 38 NORTH AMERICA BLOOD PLASMA & PLASMA DERIVED MEDICINAL PRODUCTS MARKET, BY TECHNOLOGY, 2018-2033 (USD THOUSAND)
TABLE 39 NORTH AMERICA BLOOD PLASMA & PLASMA DERIVED MEDICINAL PRODUCTS MARKET, BY MODE, 2018-2033 (USD THOUSAND)
TABLE 40 NORTH AMERICA BLOOD PLASMA & PLASMA DERIVED MEDICINAL PRODUCTS MARKET, BY END USER, 2018-2033 (USD THOUSAND)
TABLE 41 NORTH AMERICA BLOOD PLASMA & PLASMA DERIVED MEDICINAL PRODUCTS MARKET, BY DISTRIBUTION CHANNEL, 2018-2033 (USD THOUSAND)
TABLE 42 U.S. BLOOD PLASMA & PLASMA DERIVED MEDICINAL PRODUCTS MARKET, BY PRODUCT, 2018-2033 (USD THOUSAND)
TABLE 43 U.S. BLOOD PLASMA & PLASMA DERIVED MEDICINAL PRODUCTS MARKET, BY APPLICATION, 2018-2033 (USD THOUSAND)
TABLE 44 U.S. BLOOD PLASMA & PLASMA DERIVED MEDICINAL PRODUCTS MARKET, BY TECHNOLOGY, 2018-2033 (USD THOUSAND)
TABLE 45 U.S. BLOOD PLASMA & PLASMA DERIVED MEDICINAL PRODUCTS MARKET, BY MODE, 2018-2033 (USD THOUSAND)
TABLE 46 U.S. BLOOD PLASMA & PLASMA DERIVED MEDICINAL PRODUCTS MARKET, BY END USER, 2018-2033 (USD THOUSAND)
TABLE 47 U.S. BLOOD PLASMA & PLASMA DERIVED MEDICINAL PRODUCTS MARKET, BY DISTRIBUTION CHANNEL, 2018-2033 (USD THOUSAND)
TABLE 48 CANADA BLOOD PLASMA & PLASMA DERIVED MEDICINAL PRODUCTS MARKET, BY PRODUCT, 2018-2033 (USD THOUSAND)
TABLE 49 CANADA BLOOD PLASMA & PLASMA DERIVED MEDICINAL PRODUCTS MARKET, BY APPLICATION, 2018-2033 (USD THOUSAND)
TABLE 50 CANADA BLOOD PLASMA & PLASMA DERIVED MEDICINAL PRODUCTS MARKET, BY TECHNOLOGY, 2018-2033 (USD THOUSAND)
TABLE 51 CANADA BLOOD PLASMA & PLASMA DERIVED MEDICINAL PRODUCTS MARKET, BY MODE, 2018-2033 (USD THOUSAND)
TABLE 52 CANADA BLOOD PLASMA & PLASMA DERIVED MEDICINAL PRODUCTS MARKET, BY END USER, 2018-2033 (USD THOUSAND)
TABLE 53 CANADA BLOOD PLASMA & PLASMA DERIVED MEDICINAL PRODUCTS MARKET, BY DISTRIBUTION CHANNEL, 2018-2033 (USD THOUSAND)
TABLE 54 MEXICO BLOOD PLASMA & PLASMA DERIVED MEDICINAL PRODUCTS MARKET, BY PRODUCT, 2018-2033 (USD THOUSAND)
TABLE 55 MEXICO BLOOD PLASMA & PLASMA DERIVED MEDICINAL PRODUCTS MARKET, BY APPLICATION, 2018-2033 (USD THOUSAND)
TABLE 56 MEXICO BLOOD PLASMA & PLASMA DERIVED MEDICINAL PRODUCTS MARKET, BY TECHNOLOGY, 2018-2033 (USD THOUSAND)
TABLE 57 MEXICO BLOOD PLASMA & PLASMA DERIVED MEDICINAL PRODUCTS MARKET, BY MODE, 2018-2033 (USD THOUSAND)
TABLE 58 MEXICO BLOOD PLASMA & PLASMA DERIVED MEDICINAL PRODUCTS MARKET, BY END USER, 2018-2033 (USD THOUSAND)
TABLE 59 MEXICO BLOOD PLASMA & PLASMA DERIVED MEDICINAL PRODUCTS MARKET, BY DISTRIBUTION CHANNEL, 2018-2033 (USD THOUSAND)
List of Figure
FIGURE 1 NORTH AMERICA BLOOD PLASMA & PLASMA DERIVED MEDICINAL PRODUCTS MARKET: SEGMENTATION
FIGURE 2 NORTH AMERICA BLOOD PLASMA & PLASMA DERIVED MEDICINAL PRODUCTS MARKET: DATA TRIANGULATION
FIGURE 3 NORTH AMERICA BLOOD PLASMA & PLASMA DERIVED MEDICINAL PRODUCTS MARKET: DROC ANALYSIS
FIGURE 4 NORTH AMERICA BLOOD PLASMA & PLASMA DERIVED MEDICINAL PRODUCTS MARKET: NORTH AMERICA VS REGIONAL MARKET ANALYSIS
FIGURE 5 NORTH AMERICA BLOOD PLASMA & PLASMA DERIVED MEDICINAL PRODUCTS MARKET: COMPANY RESEARCH ANALYSIS
FIGURE 6 NORTH AMERICA BLOOD PLASMA & PLASMA DERIVED MEDICINAL PRODUCTS MARKET: INTERVIEW DEMOGRAPHICS
FIGURE 7 NORTH AMERICA BLOOD PLASMA & PLASMA DERIVED MEDICINAL PRODUCTS MARKET: DBMR MARKET POSITION GRID
FIGURE 8 NORTH AMERICA BLOOD PLASMA & PLASMA DERIVED MEDICINAL PRODUCTS MARKET: MARKET END USER COVERAGE GRID
FIGURE 9 NORTH AMERICA BLOOD PLASMA & PLASMA DERIVED MEDICINAL PRODUCTS MARKET: VENDOR SHARE ANALYSIS
FIGURE 10 NORTH AMERICA BLOOD PLASMA & PLASMA DERIVED MEDICINAL PRODUCTS MARKET: SEGMENTATION
FIGURE 11 NORTH AMERICA BLOOD PLASMA & PLASMA DERIVED MEDICINAL PRODUCTS MARKET: EXECUTIVE SUMMARY
FIGURE 12 STRATEGIC DECISIONS
FIGURE 13 NORTH AMEIRCA IS EXPECTED TO DOMINATE THE MARKET AND ASIA-PACIFIC IS EXPECTED TO GROW WITH THE HIGHEST CAGR IN THE NORTH AMERICA BLOOD PLASMA & PLASMA DERIVED MEDICINAL PRODUCTS MARKET IN THE FORECAST PERIOD OF 2025 TO 2032
FIGURE 14 NORTH AMERICA BLOOD PLASMA & PLASMA DERIVED MEDICINAL PRODUCTS MARKET, BY PRODUCT (2024)
FIGURE 15 RISING PREVELANCE OF RARE & CHRONIC DISEASES IS EXPECTED TO DRIVE THE NORTH AMERICA BLOOD PLASMA & PLASMA DERIVED MEDICINAL PRODUCTS MARKET, IN THE FORECAST PERIOD OF 2026 TO 2033
FIGURE 16 IMMUNOGLOBULINS SEGMENT IS EXPECTED TO ACCOUNT FOR THE LARGEST SHARE OF THE NORTH AMERICA BLOOD PLASMA & PLASMA DERIVED MEDICINAL PRODUCTS MARKET IN THE FORECAST PERIOD OF 2026 & 2033
FIGURE 17 ASIA-PACIFIC IS THE FASTEST-GROWING REGION FOR NORTH AMERICA BLOOD PLASMA & PLASMA DERIVED MEDICINAL PRODUCTS MARKET IN THE FORECAST PERIOD OF 2026 TO 2033
FIGURE 18 DRIVERS, RESTRAINTS, OPPORTUNITIES AND CHALLENGES FOR THE NORTH AMERICA BLOOD PLASMA & PLASMA DERIVED MEDICINAL PRODUCTS MARKET
FIGURE 19 NORTH AMERICA BLOOD PLASMA AND PLASMA DERIVED MEDICINAL PRODUCTS MARKET: BY PRODUCT, 2025
FIGURE 20 NORTH AMERICA BLOOD PLASMA AND PLASMA DERIVED MEDICINAL PRODUCTS MARKET: BY PRODUCT, 2026 TO 2033 (USD THOUSAND)
FIGURE 21 NORTH AMERICA BLOOD PLASMA AND PLASMA DERIVED MEDICINAL PRODUCTS MARKET: BY PRODUCT, CAGR (2026- 2033)
FIGURE 22 NORTH AMERICA BLOOD PLASMA AND PLASMA DERIVED MEDICINAL PRODUCTS MARKET: BY PRODUCT, LIFELINE CURVE
FIGURE 23 NORTH AMERICA BLOOD PLASMA AND PLASMA DERIVED MEDICINAL PRODUCTS MARKET: BY APPLICATION, 2025
FIGURE 24 NORTH AMERICA BLOOD PLASMA AND PLASMA DERIVED MEDICINAL PRODUCTS MARKET: BY APPLICATION, 2026 TO 2033 (USD THOUSAND)
FIGURE 25 NORTH AMERICA BLOOD PLASMA AND PLASMA DERIVED MEDICINAL PRODUCTS MARKET: BY APPLICATION, CAGR (2026- 2033)
FIGURE 26 NORTH AMERICA BLOOD PLASMA AND PLASMA DERIVED MEDICINAL PRODUCTS MARKET: BY APPLICATION, LIFELINE CURVE
FIGURE 27 NORTH AMERICA BLOOD PLASMA AND PLASMA DERIVED MEDICINAL PRODUCTS MARKET: BY TECHNOLOGY, 2025
FIGURE 28 NORTH AMERICA BLOOD PLASMA AND PLASMA DERIVED MEDICINAL PRODUCTS MARKET: BY TECHNOLOGY, 2026 TO 2033 (USD THOUSAND)
FIGURE 29 NORTH AMERICA BLOOD PLASMA AND PLASMA DERIVED MEDICINAL PRODUCTS MARKET: BY TECHNOLOGY, CAGR (2026- 2033)
FIGURE 30 NORTH AMERICA BLOOD PLASMA AND PLASMA DERIVED MEDICINAL PRODUCTS MARKET: BY TECHNOLOGY, LIFELINE CURVE
FIGURE 31 NORTH AMERICA BLOOD PLASMA AND PLASMA DERIVED MEDICINAL PRODUCTS MARKET: BY MODE, 2025
FIGURE 32 NORTH AMERICA BLOOD PLASMA AND PLASMA DERIVED MEDICINAL PRODUCTS MARKET: BY MODE, 2026 TO 2033 (USD THOUSAND)
FIGURE 33 NORTH AMERICA BLOOD PLASMA AND PLASMA DERIVED MEDICINAL PRODUCTS MARKET: BY MODE, CAGR (2026- 2033)
FIGURE 34 NORTH AMERICA BLOOD PLASMA AND PLASMA DERIVED MEDICINAL PRODUCTS MARKET: BY MODE, LIFELINE CURVE
FIGURE 35 NORTH AMERICA BLOOD PLASMA AND PLASMA DERIVED MEDICINAL PRODUCTS MARKET: BY END USER, 2025
FIGURE 36 NORTH AMERICA BLOOD PLASMA AND PLASMA DERIVED MEDICINAL PRODUCTS MARKET: BY END USER, 2026 TO 2033 (USD THOUSAND)
FIGURE 37 NORTH AMERICA BLOOD PLASMA AND PLASMA DERIVED MEDICINAL PRODUCTS MARKET: BY END USER, CAGR (2026- 2033)
FIGURE 38 NORTH AMERICA BLOOD PLASMA AND PLASMA DERIVED MEDICINAL PRODUCTS MARKET: BY END USER, LIFELINE CURVE
FIGURE 39 NORTH AMERICA BLOOD PLASMA AND PLASMA DERIVED MEDICINAL PRODUCTS MARKET: BY DISTRIBUTION CHANNEL, 2025
FIGURE 40 NORTH AMERICA BLOOD PLASMA AND PLASMA DERIVED MEDICINAL PRODUCTS MARKET: BY DISTRIBUTION CHANNEL, 2026 TO 2033 (USD THOUSAND)
FIGURE 41 NORTH AMERICA BLOOD PLASMA AND PLASMA DERIVED MEDICINAL PRODUCTS MARKET: BY DISTRIBUTION CHANNEL, CAGR (2026- 2033)
FIGURE 42 NORTH AMERICA BLOOD PLASMA AND PLASMA DERIVED MEDICINAL PRODUCTS MARKET: BY DISTRIBUTION CHANNEL, LIFELINE CURVE
FIGURE 43 NORTH AMERICA BLOOD PLASMA & PLASMA DERIVED MEDICINAL PRODUCTS MARKET: SNAPSHOT (2025)
FIGURE 44 NORTH AMERICA BLOOD PLASMA AND PLASMA DERIVED MEDICINAL PRODUCTS MARKET: COMPANY SHARE 2025 (%)
Data collection and base year analysis are done using data collection modules with large sample sizes. The stage includes obtaining market information or related data through various sources and strategies. It includes examining and planning all the data acquired from the past in advance. It likewise envelops the examination of information inconsistencies seen across different information sources. The market data is analysed and estimated using market statistical and coherent models. Also, market share analysis and key trend analysis are the major success factors in the market report. To know more, please request an analyst call or drop down your inquiry.
The key research methodology used by DBMR research team is data triangulation which involves data mining, analysis of the impact of data variables on the market and primary (industry expert) validation. Data models include Vendor Positioning Grid, Market Time Line Analysis, Market Overview and Guide, Company Positioning Grid, Patent Analysis, Pricing Analysis, Company Market Share Analysis, Standards of Measurement, Global versus Regional and Vendor Share Analysis. To know more about the research methodology, drop in an inquiry to speak to our industry experts.
Data Bridge Market Research is a leader in advanced formative research. We take pride in servicing our existing and new customers with data and analysis that match and suits their goal. The report can be customized to include price trend analysis of target brands understanding the market for additional countries (ask for the list of countries), clinical trial results data, literature review, refurbished market and product base analysis. Market analysis of target competitors can be analyzed from technology-based analysis to market portfolio strategies. We can add as many competitors that you require data about in the format and data style you are looking for. Our team of analysts can also provide you data in crude raw excel files pivot tables (Fact book) or can assist you in creating presentations from the data sets available in the report.


