
Market Analysis and Insights
Brazing fillers for joining applications are essential for manufacturing and designing advanced materials. Several types of brazing fillers have been developed in recent decades to join similar or different engineering materials. Important parts of automotive and aircraft components, including steel, are often joined by brazing. In addition, ceramic components in microwave devices and circuits have been joined with a high level of integration in microelectronic devices.
Similarly, in the medical field, metallic implants have been brazed to ceramic dental crowns. These advances have made human life more convenient. However, in brazing, there are certain issues with intermetallic compound (IMC) formation and residual stresses in joints at high temperatures.
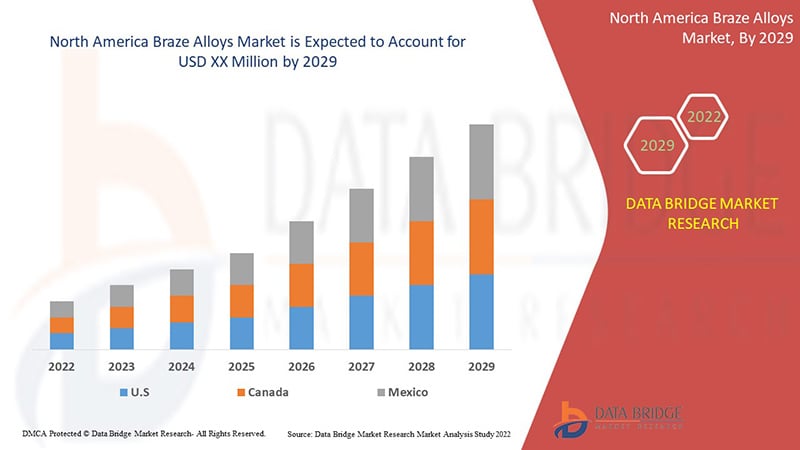
Increasing use of braze alloys coupled with growing application of braze alloys in different end industry like aerospace, buildings and electronics has surged its demand. Data Bridge Market Research analyses that the North America braze alloys market will grow at a CAGR of 4.6% during the forecast period of 2022 to 2029
|
Report Metric |
Details |
|
Forecast Period |
2022 to 2029 |
|
Base Year |
2021 |
|
Historic Years |
2020 (Customizable to 2020 - 2014) |
|
Quantitative Units |
Revenue in USD Million, Tons, Pricing in USD |
|
Segments Covered |
By Metal (Nickel, Cobalt, Silver, Gold, Aluminum, Copper, Steel, Iron, Magnesium, Titanium, and Others), Filler Material (Braze Powder, Braze Paste, Braze Tape, Braze Preform, Braze Foil and Braze Rod and Wire), Technology (Torch Brazing, Furnace Brazing, Induction Brazing, Dip Brazing, Resistance Brazing, Infrared Brazing, Exothermic Brazing, Blanket Brazing, Electron Beam/Laser Brazing, Braze Welding, Dissociated Ammonia, Vacuum Brazing, Hydrogen Brazing, Fuel Gas Brazing and Others), Form (Pipe, Tube, Sheet, Strip, Plate, Round Bar, Flat, Bar, Wire, and Others), Production Temperature (Less than 900 °C, 901 °C to 1000 °C, 1001 °C to 1200 °C and Above 1200 °C), End Use (Aerospace and Defense, Electronics and Electrical, Automotive, Marine, Chemicals, Building and Construction and Others) |
|
Countries Covered |
U.S. Canada, Mexico |
|
Market Players Covered |
Johnson Matthey, OC Oerlikon Management AG, Sulzer Ltd, Belmont Metals, Harris Products Group, Morgan Advanced Materials and its affiliates, Aimtek, Inc., Lucas-Milhaupt, Inc. , Esprix Technologies, Indium Corporation, AMETEK. Inc., TSI Technologies, ESAB (Subsidary of Colfax Corporation), Umicore |
Braze Alloys Market Dynamics
Drivers
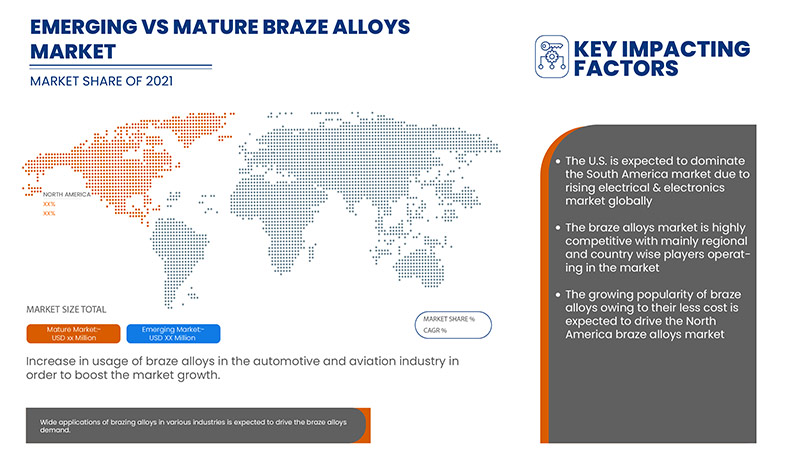
- Increase in usage of braze alloys in the automotive and aviation industry
Braze alloys are witnessing significant demand from the automotive industry, where they are used condenser and evaporator connections for air-conditioning systems, fuel injection pipes, and brake linings. The automotive and aviation industry has been striving to develop lightweight automotive components.
- Increasing preference toward brazing process over soldering, and welding, among others
Brazing is a metal-joining process in which two or more metal items are joined together by melting and flowing a filler metal into the joint. It is widely used to join metal conductors in high through to low voltage electrical earthing systems. This process is currently used in the U.K., Ireland, and among other countries worldwide, to create a permanent joint of two conductive metals, usually copper or steel.
Opportunities
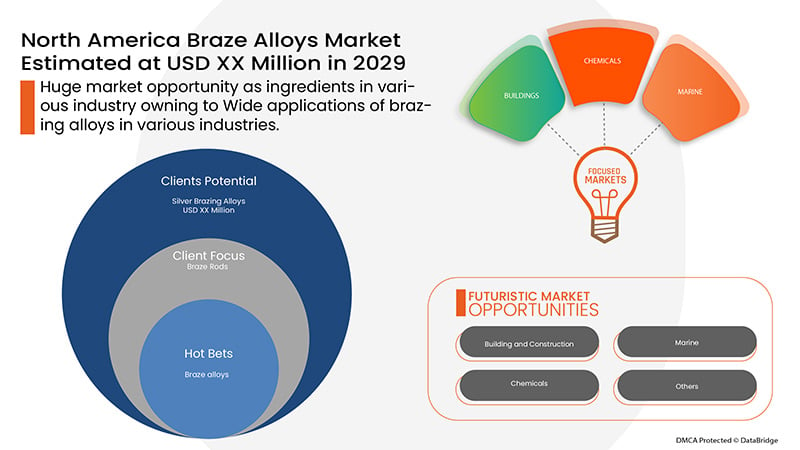
- Wide applications of brazing alloys in various industries
Brazing is a widely used joining process because it can join almost all metals except aluminum and magnesium. It is used for electrical components, pipe fittings among others. Metals having uneven thickness can be joined by brazing. Brazing is used to bond a variety of metals, dissimilar metals, and even non-metals.
Restraints/Challenges
- Fluctuating prices of braze metals
The prices of raw materials are currently fluctuating at unprecedented levels both in the United States and elsewhere in the world. Since pricing is affected by the tightening of supply markets. Beyond supply and demand, the other factor has been influencing short-run fluctuations in the prices of raw materials. Investors can suddenly move away from what they perceive to be riskier bets, including stocks and commodities.
- Adverse effect of brazing on the environment
Brazing is one of the fundamental technologies in manufacturing and is widely used in aerospace, rail transit, semiconductors, refrigerating appliances and other fields
The traditional brazing process involves harmful environment effects. The main cause of the pollution is excessive flux residual. The brazing process include the inability to precisely control the flux. The excessive residual flux and cleaning after brazing, leads to serious wastage of flux and environmental pollution. Also, it affects the service life of weldment.
This braze alloys market report provides details of new recent developments, trade regulations, import-export analysis, production analysis, value chain optimization, market share, impact of domestic and localized market players, analyses opportunities in terms of emerging revenue pockets, changes in market regulations, strategic market growth analysis, market size, category market growths, application niches and dominance, product approvals, product launches, geographic expansions, technological innovations in the market. To gain more info on braze alloys market contact Data Bridge Market Research for an Analyst Brief, our team will help you make an informed market decision to achieve market growth.
Post COVID-19 Impact on Braze Alloys Market
The COVID-19 pandemic has highly disrupted the supply chain of raw materials used to manufacture braze alloys and the disturbance in the supply chain of end-user industries. It was attributed to the lack of resources and transportation, which led to lower access, delayed stock, and supplies of raw materials products. Additionally, many governments restricted the movement of goods across the countries, and the entire supply chain was distorted. Due to the disrupted supply chain, transportation of raw materials has been interrupted, stalling production. Similarly, inflated prices and halt on braze alloys production have resulted in unmet demands for braze alloys in various end-users such as constructions, electronics, aerospace and defense.
COVID-19 pandemic also has adverse effects on end end-user industries of braze brazing alloys. It has negatively impacted the construction industry.
For instance,
According to global data, construction output in North America may decrease by as much as USD 122bn in 2020 as a result of the economic shock of COVID-19. A 0.6% increase in construction output was predicted across North America before the pandemic, but this is now expected to fall by about 6.5% in the U.S. and 7% in Canada
As a result the braze alloy market will also be affected as brazing technique are used in buildings and construction.
Thus, disturbance in supply chain due to COVID-19 pandemic is expected to act as a challenge for braze alloys market.
Recent Development
- In February 2022, OC Oerlikon Management AG has expanded its online ordering platform to its North Americaan customers. This expansion has helped the company to attract more customer base.
North America Braze Alloys Market Scope
The North America braze alloys market is segmented into metal, filler material, technology, form, production temperature, and end use.
The growth amongst these segments will help you analyze meager growth segments in the industries and provide the users with a valuable market overview and market insights to make strategic decisions to identify core market applications.
Metals
- Silver
- Copper
- Nickel
- Gold
- Titanium
- Steel
- Aluminum
- Cobalt
- Iron
- Magnesium
- Other
Based on metals, the market is segmented into silver, copper, nickel, gold, titanium, steel, aluminum, cobalt, iron, magnesium and other.
Filler Material
- Braze Paste
- Braze Rod and Wire
- Braze Powder
- Braze Preform
- Braze Foil
- Braze Tape
Based on filler material, the market is segmented into the braze paste, braze rod and wire, braze powder, braze preform, braze foil and braze tape.
Technology
- Torch Brazing
- Furnace Brazing
- Resistance Brazing
- Induction Brazing
- Dip Brazing
- Infrared Brazing
- Vacuum Brazing
- Electron Beam/Laser Brazing
- Exothermic Brazing
- Braze Welding
- Hydrogen Brazing
- Blanket Brazing
- Dissociated Ammonia
- Fuel Gas Brazing
- Others
Based on technology the market is segmented into torch brazing, furnace brazing, resistance brazing, induction brazing, dip brazing, infrared brazing, vacuum brazing, electron beam/laser brazing, exothermic brazing, braze welding, hydrogen brazing, blanket brazing, dissociated ammonia, fuel gas brazing, and others.
Form
- Wire
- Strip
- Bar
- Pipe
- Tube
- Flat
- Sheet
- Plate
- Round Bar
- Others
Based on form, the market is segmented into wire, strip, bar, pipe, tube, flat, sheet, plate, round bar and others.
Production Temperature
- 1001 °C to 1200 °C
- Less Than 900 °C
- 901 °C to 1000 °C
- Above 1200 °C
Based on production temperature, the market is segmented into 1001°C to 1200°C, less than 900°C, 901°C to 1000°C and above 1200°C.
End Use
- Automotive
- Aerospace and Defense
- Electronics and Electrical
- Building and Construction
- Chemicals
- Marine
- Others
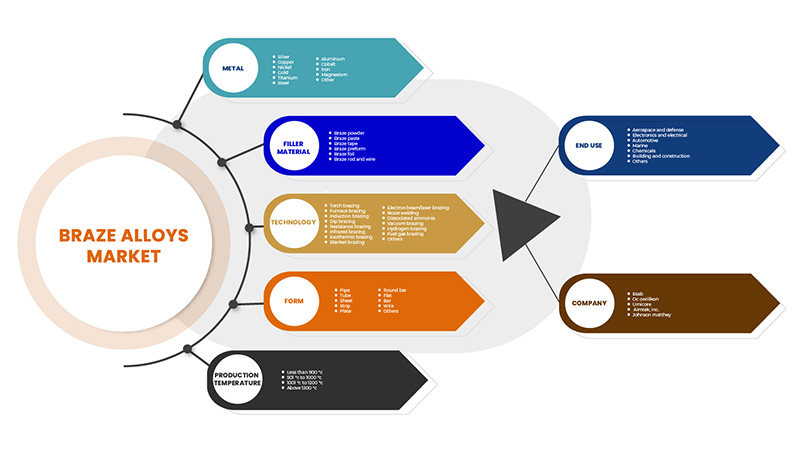
Based on end use, the market is segmented into automotive, aerospace and defense, electronics and electrical, building and construction, chemicals, marine and others.
Braze Alloys Market Regional Analysis/Insights
The braze alloys market is analyzed and market size insights and trends are provided by country, metal, filler material, technology, form, production temperature and end use.
The regions covered in the braze alloys market report are U.S., Canada, Mexico
The U.S. dominates the North America region due to growing applications of braze alloys in the region. Canada dominates the region due to the growing electronics industry in the region.
The country section of the report also provides individual market impacting factors and changes in regulations in the market that impact the current and future trends of the market. Data points, such as new and replacement sales, country demographics, disease epidemiology, and import-export tariffs, are some of the major pointers used to forecast the market scenario for individual countries. In addition, the presence and availability of North America brands and their challenges faced due to high competition from local and domestic brands, and the impact of sales channels are considered while providing forecast analysis of the country data.
Competitive Landscape and Braze Alloys Market Share Analysis
The braze alloys market competitive landscape provides details by the competitors. Details included are company overview, company financials, revenue generated, market potential, investment in research and development, new market initiatives, GCC presence, production sites and facilities, production capacities, company strengths and weaknesses, product launch, product width and breadth, and application dominance. The above data points provided are only related to the companies' focus on braze alloys market.
Some of the major players operating in the braze alloys market are Johnson Matthey, OC Oerlikon Management AG, Sulzer Ltd, Belmont Metals, Harris Products Group, Morgan Advanced Materials and its affiliates, Aimtek, Inc., Lucas-Milhaupt, Inc. , Esprix Technologies, Indium Corporation, AMETEK. Inc., TSI Technologies, ESAB (Subsidary of Colfax Corporation), Umicore among others.
Research Methodology
Data collection and base year analysis are done using data collection modules with large sample sizes. The market data is analyzed and estimated using market statistical and coherent models. In addition, market share analysis and key trend analysis are the major success factors in the market report. The key research methodology used by DBMR research team is data triangulation which involves data mining, analysis of the impact of data variables on the market, and primary (industry expert) validation. Apart from this, data models include Vendor Positioning Grid, Market Time Line Analysis, Market Overview and Guide, Company Positioning Grid, Company Market Share Analysis, Standards of Measurement, North America Vs Regional and Vendor Share Analysis. Please request analyst call in case of further inquiry.
SKU-

- Interactive Data Analysis Dashboard
- Company Analysis Dashboard for high growth potential opportunities
- Research Analyst Access for customization & queries
- Competitor Analysis with Interactive dashboard
- Latest News, Updates & Trend analysis
- Harness the Power of Benchmark Analysis for Comprehensive Competitor Tracking
Table of Content
- INTRODUCTION
- OBJECTIVES OF THE STUDY
- MARKET DEFINITION
- OVERVIEW OF NORTH AMERICA BRAZE ALLOYS MARKET
- LIMITATIONS
- MARKET SEGMENTATION
- MARKET SEGMENTATION
- MARKETS COVERED
- GEOGRAPHICAL SCOPE
- YEARS CONSIDERED FOR THE STUDY
- CURRENCY AND PRICING
- DBMR TRIPOD DATA VALIDATION MODEL
- MULTIVARIATE MODELLING
- METAL LIFELINE CURVE
- PRIMARY INTERVIEWS WITH KEY OPINION LEADERS
- DBMR MARKET POSITION GRID
- DBMR END-USER POSITION GRID
- VENDOR SHARE ANALYSIS
- SECONDARY SOURCES
- ASSUMPTIONS
- EXECUTIVE SUMMARY
- PREMIUM INSIGHTS
- MARKET OVERVIEW
- DRIVERS
- INCREASE IN USAGE OF BRAZE ALLOYS IN THE AUTOMOTIVE AND AVIATION INDUSTRY
- INCREASING PREFERENCE TOWARD BRAZING PROCESS OVER SOLDERING, AND WELDING, AMONG OTHERS
- INCREASING DEMAND FOR COPPER & ALUMINUM BRAZE ALLOYS
- RISING ELECTRICAL & ELECTRONICS MARKET IN NORTH AMERICA
- RESTRAINTS
- FLUCTUATING PRICES OF BRAZE METALS
- COMPLEXITIES IN THE MANUFACTURING PROCESS OF BRAZE ALLOYS
- AVAILABILITY OF SUBSTITUTES OF BRAZE ALLOYS
- OPPORTUNITIES
- WIDE APPLICATIONS OF BRAZING ALLOYS IN VARIOUS INDUSTRIES
- COST-EFFECTIVENESS OF BRAZE ALLOYS
- RISING NUMBER OF INNOVATIONS IN THE BRAZING INDUSTRY
- CHALLENGES
- SUPPLY CHAIN DISRUPTION DUE TO COVID -19
- IMPACT OF COVID-19 ON THE NORTH AMERICA BRAZE ALLOYS MARKET
- AFTERMATH OF COVID-19 AND GOVERNMENT INITIATIVE TO BOOST THE MARKET
- STRATEGIC DECISIONS FOR MANUFACTURERS AFTER COVID-19 TO GAIN COMPETITIVE MARKET SHARE
- IMPACT ON SUPPLY CHAIN
- IMPACT ON PRICE
- IMPACT ON DEMAND
- CONCLUSION
- NORTH AMERICA BRAZE ALLOYS MARKET, BY METAL
- OVERVIEW
- SILVER
- COPPER
- NICKEL
- GOLD
- TITANIUM
- STEEL
- STAINLESS STEEL
- CARBON STEEL
- LOW ALLOY STEEL
- OTHERS
- ALUMINUM
- COBALT
- IRON
- MAGNESIUM
- OTHERS
- NORTH AMERICA BRAZE ALLOYS MARKET, BY FILLER MATERIAL
- OVERVIEW
- BRAZE PASTE
- BRAZE ROD AND WIRE
- BRAZE POWDER
- BRAZE PREFORM
- BRAZE FOIL
- BRAZE TAPE
- NORTH AMERICA BRAZE ALLOYS MARKET, BY TECHNOLOGY
- OVERVIEW
- TORCH BRAZING
- FURNACE BRAZING
- RESISTANCE BRAZING
- INDUCTION BRAZING
- DIP BRAZING
- INFRARED BRAZING
- VACUUM BRAZING
- ELECTRON BEAM/LASER BRAZING
- EXOTHERMIC BRAZING
- BRAZE WELDING
- HYDROGEN BRAZING
- BLANKET BRAZING
- DISSOCIATED AMMONIA
- FUEL GAS BRAZING
- OTHERS
- NORTH AMERICA BRAZE ALLOYS MARKET, BY PRODUCT FORMS
- OVERVIEW
- WIRE
- STRIP
- BAR
- PIPE
- TUBE
- FLAT
- SHEET
- PLATE
- ROUND BAR
- OTHERS
- NORTH AMERICA BRAZE ALLOYS MARKET, BY PRODUCTION TEMPERATURE
- OVERVIEW
- 1001 °C TO 1200 °C
- LESS THAN 900 °C
- 901 °C TO 1000 °C
- ABOVE 1200 °C
- NORTH AMERICA BRAZE ALLOYS MARKET, BY END USER
- OVERVIEW
- AUTOMOTIVE
- AUTOMOTIVE, BY METAL
- SILVER
- COPPER
- NICKEL
- GOLD
- TITANIUM
- STEEL
- ALUMINUM
- COBALT
- IRON
- MAGNESIUM
- OTHERS
- AEROSPACE AND DEFENSE
- AEROSPACE AND DEFENSE, BY METAL
- SILVER
- COPPER
- NICKEL
- GOLD
- TITANIUM
- STEEL
- ALUMINUM
- COBALT
- IRON
- MAGNESIUM
- OTHERS
- ELECTRONICS AND ELECTRICAL
- ELECTRONICS AND ELECTRICAL, BY METAL
- SILVER
- COPPER
- NICKEL
- GOLD
- TITANIUM
- STEEL
- ALUMINUM
- COBALT
- IRON
- MAGNESIUM
- OTHERS
- BUILDING AND CONSTRUCTION
- BUILDING AND CONSTRUCTION, BY METAL
- SILVER
- COPPER
- NICKEL
- GOLD
- TITANIUM
- STEEL
- ALUMINUM
- COBALT
- IRON
- MAGNESIUM
- OTHERS
- CHEMICALS
- CHEMICALS, BY METAL
- SILVER
- COPPER
- NICKEL
- GOLD
- TITANIUM
- STEEL
- ALUMINUM
- COBALT
- IRON
- MAGNESIUM
- OTHERS
- MARINE
- MARINE, BY METAL
- SILVER
- COPPER
- NICKEL
- GOLD
- TITANIUM
- STEEL
- ALUMINUM
- COBALT
- IRON
- MAGNESIUM
- OTHERS
- OTHERS
- OTHERS, BY METAL
- SILVER
- COPPER
- NICKEL
- GOLD
- TITANIUM
- STEEL
- ALUMINUM
- COBALT
- IRON
- MAGNESIUM
- OTHERS
- NORTH AMERICA BRAZE ALLOYS MARKET, BY COUNTRY
- U.S.
- CANADA
- MEXICO
- NORTH AMERICA BRAZE ALLOYS MARKET: COMPANY LANDSCAPE
- COMPANY SHARE ANALYSIS: NORTH AMERICA
- NEW PRODUCT DEVELOPMENTS
- MERGERS, PARTNERSHIPS & ACQUISITIONS
- AWARD AND CERTIFICATION
- SWOT ANALYSIS
- COMPANY PROFILE
- LUCAS-MILHAUPT, INC.
- COMPANY SNAPSHOT
- PRODUCT PORTFOLIO
- RECENT DEVELOPMENT
- AMETEK.INC.
- COMPANY SNAPSHOT
- REVENUE ANALYSIS
- PRODUCT PORTFOLIO
- RECENT DEVELOPMENT
- ESAB
- COMPANY SANPSHOT
- REVENUE ANALYSIS
- PRODUCT PORTFOLIO
- RECENT DEVELOPMENT
- OC OERLIKON MANAGEMENT AG
- COMPANY SNAPSHOT
- REVENUE ANALYSIS
- PRODUCT PORTFOLIO
- RECENT DEVELOPMENT
- UMICORE
- COMPANY SNAPSHOT
- REVENUE ANALYSIS
- PRODUCT PORTFOLIO
- RECENT DEVELOPMENT
- AIMTEK
- COMPANY SANPSHOT
- PRODUCT PORTFOLIO
- RECENT DEVELOPMENT
- BELMONT METALS
- COMPANY SNAPSHOT
- PRODUCT PORTFOLIO
- RECENT DEVELOPMENT
- ESPRIX TECHNOLOGIES
- COMPANY SNAPSHOT
- PRODUCT PORTFOLIO
- RECENT DEVELOPMENT
- HARRIS PRODUCTS GROUP.
- COMPANY SNAPSHOT
- PRODUCT PORTFOLIO
- RECENT DEVELOPMENT
- INDIUM CORPORATION
- COMPANY SNAPSHOT
- PRODUCT PORTFOLIO
- RECENT DEVELOPMENT
- JOHNSON MATTHEY
- COMPANY SNAPSHOT
- REVENUE ANALYSIS
- PRODUCT PORTFOLIO
- RECENT DEVELOPMENT
- MORGAN ADVANCED MATERIALS
- COMPANY SNAPSHOT
- PRODUCT PORTFOLIO
- RECENT DEVELOPMENT
- PRINCE IZANT COMPANY.
- COMPANY SANPSHOT
- PRODUCT PORTFOLIO
- RECENT DEVELOPMENT
- SULZER LTD
- COMPANY SNAPSHOT
- REVENUE ANALYSIS
- PRODUCT PORTFOLIO
- RECENT DEVELOPMENT
- TSI TECHNOLOGIES
- COMPANY SANPSHOT
- PRODUCT PORTFOLIO
- RECENT DEVELOPMENT
- QUESTIONNAIRE
- RELATED REPORTS
List of Table
TABLE 1 North America Braze alloys market, By Metal, 2019-2028 (USD Million)
TABLE 2 North America Steel In Braze alloys market, By Metal, 2019-2028 (USD Million)
TABLE 3 North America Braze alloys market, By Filler Material, 2019-2028 (USD Million)
TABLE 4 North America Braze alloys market, By Technology, 2019-2028 (USD Million)
TABLE 5 North America Braze alloys market, By Product Forms, 2019-2028 (USD Million)
TABLE 6 North America Braze alloys market, By Production Temperature, 2019-2028 (USD Million)
TABLE 7 North America Braze alloys market, By End-User, 2019-2028 (USD Million)
TABLE 8 North America Automotive In Braze alloys market, By Metal, 2019-2028 (USD Million)
TABLE 9 North America aerospace and defense In Braze alloys market, By Metal, 2019-2028 (USD Million)
TABLE 10 North America Electronics and electrical In Braze alloys market, By Metal, 2019-2028 (USD Million)
TABLE 11 North America Building and construction In Braze alloys market, By Metal, 2019-2028 (USD Million)
TABLE 12 North America chemicals In Braze alloys market, By Metal, 2019-2028 (USD Million)
TABLE 13 North America Marine In Braze alloys market, By Metal, 2019-2028 (USD Million)
TABLE 14 North America Others In Braze alloys market, By Metal, 2019-2028 (USD Million)
TABLE 15 North America braze alloys market, By COUNTRY, 2019-2028 (USD million)
TABLE 16 U.S. Braze alloys market, By Metal, 2019-2028 (USD Million)
TABLE 17 U.S. Steel In Braze alloys market, By Metal, 2019-2028 (USD Million)
TABLE 18 U.S. Braze alloys market, By Filler Material, 2019-2028 (USD Million)
TABLE 19 U.S. Braze alloys market, By Technology, 2019-2028 (USD Million)
TABLE 20 U.S. Braze alloys market, By Product Forms, 2019-2028 (USD Million)
TABLE 21 U.S. Braze alloys market, By Production Temperature, 2019-2028 (USD Million)
TABLE 22 U.S. Braze alloys market, By End-User, 2019-2028 (USD Million)
TABLE 23 U.S. Automotive In Braze alloys market, By Metal, 2019-2028 (USD Million)
TABLE 24 U.S. Aerospace and Defense In Braze alloys market, By Metal, 2019-2028 (USD Million)
TABLE 25 U.S. Electronics and Electrical In Braze alloys market, By Metal, 2019-2028 (USD Million)
TABLE 26 U.S. Building and Construction In Braze alloys market, By Metal, 2019-2028 (USD Million)
TABLE 27 U.S. Chemicals In Braze alloys market, By Metal, 2019-2028 (USD Million)
TABLE 28 U.S. Marine In Braze alloys market, By Metal, 2019-2028 (USD Million)
TABLE 29 U.S. Others In Braze alloys market, By Metal, 2019-2028 (USD Million)
TABLE 30 CANADA Braze alloys market, By Metal, 2019-2028 (USD Million)
TABLE 31 CANADA Steel In Braze alloys market, By Metal, 2019-2028 (USD Million)
TABLE 32 CANADA Braze alloys market, By Filler Material, 2019-2028 (USD Million)
TABLE 33 CANADA Braze alloys market, By Technology, 2019-2028 (USD Million)
TABLE 34 CANADA Braze alloys market, By Product Forms, 2019-2028 (USD Million)
TABLE 35 CANADA Braze alloys market, By Production Temperature, 2019-2028 (USD Million)
TABLE 36 CANADA Braze alloys market, By End-User, 2019-2028 (USD Million)
TABLE 37 CANADA Automotive In Braze alloys market, By Metal, 2019-2028 (USD Million)
TABLE 38 CANADA Aerospace and Defense In Braze alloys market, By Metal, 2019-2028 (USD Million)
TABLE 39 CANADA Electronics and Electrical In Braze alloys market, By Metal, 2019-2028 (USD Million)
TABLE 40 CANADA Building and Construction In Braze alloys market, By Metal, 2019-2028 (USD Million)
TABLE 41 CANADA Chemicals In Braze alloys market, By Metal, 2019-2028 (USD Million)
TABLE 42 CANADA Marine In Braze alloys market, By Metal, 2019-2028 (USD Million)
TABLE 43 CANADA Others In Braze alloys market, By Metal, 2019-2028 (USD Million)
TABLE 44 MEXICO Braze alloys market, By Metal, 2019-2028 (USD Million)
TABLE 45 MEXICO Steel In Braze alloys market, By Metal, 2019-2028 (USD Million)
TABLE 46 MEXICO Braze alloys market, By Filler Material, 2019-2028 (USD Million)
TABLE 47 MEXICO Braze alloys market, By Technology, 2019-2028 (USD Million)
TABLE 48 MEXICO Braze alloys market, By Product Forms, 2019-2028 (USD Million)
TABLE 49 MEXICO Braze alloys market, By Production Temperature, 2019-2028 (USD Million)
TABLE 50 MEXICO Braze alloys market, By End-User, 2019-2028 (USD Million)
TABLE 51 MEXICO Automotive In Braze alloys market, By Metal, 2019-2028 (USD Million)
TABLE 52 MEXICO Aerospace and Defense In Braze alloys market, By Metal, 2019-2028 (USD Million)
TABLE 53 MEXICO Electronics and Electrical In Braze alloys market, By Metal, 2019-2028 (USD Million)
TABLE 54 MEXICO Building and Construction In Braze alloys market, By Metal, 2019-2028 (USD Million)
TABLE 55 MEXICO Chemicals In Braze alloys market, By Metal, 2019-2028 (USD Million)
TABLE 56 MEXICO Marine In Braze alloys market, By Metal, 2019-2028 (USD Million)
TABLE 57 MEXICO Others In Braze alloys market, By Metal, 2019-2028 (USD Million)
List of Figure
FIGURE 1 North America Braze alloys MARKET: segmentation
FIGURE 2 North America Braze alloys MARKET: data triangulation
FIGURE 3 North America Braze alloys MARKET: DROC ANALYSIS
FIGURE 4 North America Braze alloys market: Regional VS COuntry MARKET ANALYSIS
FIGURE 5 North America Braze alloys market: COMPANY RESEARCH ANALYSIS
FIGURE 6 North America Braze alloys MARKET: INTERVIEW DEMOGRAPHICS
FIGURE 7 North America Braze alloys MARKET: DBMR MARKET POSITION GRID
FIGURE 8 North America Braze alloys MARKET: DBMR END-USER POSITION GRID
FIGURE 9 NORTH AMERICA BRAZE ALLOYS MARKET: vendor share analysis
FIGURE 10 North America Braze alloys MARKET: SEGMENTATION
FIGURE 11 AN Increase in usage of braze alloys in the automotive and aviation is a major driver for the growth of North America braze alloys market in the forecast period of 2021-2028
FIGURE 12 SILVER IS expected to account for the largest share of the North America Braze alloys market in 2021 and 2028
FIGURE 13 DRIVERS, RESTRAINTS, OPPORTUNITIES, AND CHALLENGE OF NORTH AMERICA BRAZE ALLOYS MARKET
FIGURE 14 PRICE GRAPH OF SOME OF THE METALS USED IN BRAZE ALLOYS
FIGURE 15 EXPORT OF FLUXES AND OTHER AUXILIARY PREPARATIONS FOR SOLDERING, BRAZING, OR WELDING; SOLDERING, BRAZING, OR WELDING PASTES AND POWDERS CONSISTING OF METAL AND OTHER MATERIALS
FIGURE 16 North America braze alloys Market: BY metal, 2020
FIGURE 17 North America braze alloys Market: BY filler material, 2020
FIGURE 18 North America braze alloys Market: BY Technology, 2020
FIGURE 19 North America braze alloys Market: BY product forms, 2020
FIGURE 20 North America braze alloys Market: BY Production Temperature, 2020
FIGURE 21 North America braze alloys Market: BY end user, 2020
FIGURE 22 North America braze alloys market: SNAPSHOT (2020)
FIGURE 23 North America braze alloys market: BY COUNTRY (2020)
FIGURE 24 North America braze alloys market: BY COUNTRY (2021 & 2028)
FIGURE 25 North America braze alloys market: BY COUNTRY (2020 & 2028)
FIGURE 26 North America braze alloys market: BY METAL (2021 & 2028)
FIGURE 27 North America braze alloys market: company share 2020 (%)
North America Braze Alloys Market, Supply Chain Analysis and Ecosystem Framework
To support market growth and help clients navigate the impact of geopolitical shifts, DBMR has integrated in-depth supply chain analysis into its North America Braze Alloys Market research reports. This addition empowers clients to respond effectively to global changes affecting their industries. The supply chain analysis section includes detailed insights such as North America Braze Alloys Market consumption and production by country, price trend analysis, the impact of tariffs and geopolitical developments, and import and export trends by country and HSN code. It also highlights major suppliers with data on production capacity and company profiles, as well as key importers and exporters. In addition to research, DBMR offers specialized supply chain consulting services backed by over a decade of experience, providing solutions like supplier discovery, supplier risk assessment, price trend analysis, impact evaluation of inflation and trade route changes, and comprehensive market trend analysis.
Data collection and base year analysis are done using data collection modules with large sample sizes. The stage includes obtaining market information or related data through various sources and strategies. It includes examining and planning all the data acquired from the past in advance. It likewise envelops the examination of information inconsistencies seen across different information sources. The market data is analysed and estimated using market statistical and coherent models. Also, market share analysis and key trend analysis are the major success factors in the market report. To know more, please request an analyst call or drop down your inquiry.
The key research methodology used by DBMR research team is data triangulation which involves data mining, analysis of the impact of data variables on the market and primary (industry expert) validation. Data models include Vendor Positioning Grid, Market Time Line Analysis, Market Overview and Guide, Company Positioning Grid, Patent Analysis, Pricing Analysis, Company Market Share Analysis, Standards of Measurement, Global versus Regional and Vendor Share Analysis. To know more about the research methodology, drop in an inquiry to speak to our industry experts.
Data Bridge Market Research is a leader in advanced formative research. We take pride in servicing our existing and new customers with data and analysis that match and suits their goal. The report can be customized to include price trend analysis of target brands understanding the market for additional countries (ask for the list of countries), clinical trial results data, literature review, refurbished market and product base analysis. Market analysis of target competitors can be analyzed from technology-based analysis to market portfolio strategies. We can add as many competitors that you require data about in the format and data style you are looking for. Our team of analysts can also provide you data in crude raw excel files pivot tables (Fact book) or can assist you in creating presentations from the data sets available in the report.


