
North America Cocoa Products Market
Market Size in USD Billion
 USD
5.17 Billion
USD
7.41 Billion
2024
2032
USD
5.17 Billion
USD
7.41 Billion
2024
2032
| 2025 - 2032 | |
| USD 5.17 Billion | |
| USD 7.41 Billion | |
| % | |
|
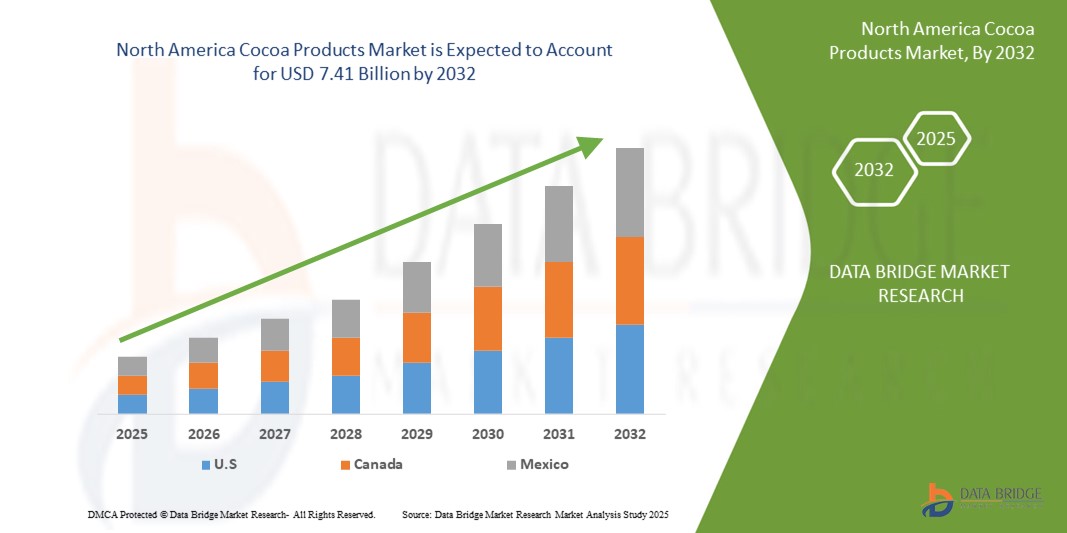
North America Cocoa Products Market Size
- The global North America cocoa products market size was valued at USD 5.17 billion in 2024 and is expected to reach USD 7.41 billion by 2032, at a CAGR of 4.60% during the forecast period
- The market growth is largely fuelled by the rising demand for chocolate confectioneries, expanding middle-class population with increased disposable income, and growing awareness of the health benefits of cocoa-based products
- In addition, the increasing penetration of Western-style bakeries and cafes, along with the rapid urbanization and evolving food preferences in emerging economies such as India, China, and Indonesia, is supporting market expansion
North America Cocoa Products Market Analysis
- The region is witnessing strong growth in cocoa products consumption, driven by changing dietary habits, increasing demand for premium chocolate, and rising urbanization
- In addition, the growth of the health and wellness trend has encouraged the consumption of dark chocolate and low-sugar cocoa products, further stimulating market demand across the region
- U.S. cocoa products market dominated the North America region in 2024, attributed to high per capita chocolate consumption, innovation in cocoa-based product formulations, and widespread adoption of clean-label ingredients
- Canada is expected to witness the highest compound annual growth rate (CAGR) in the North America cocoa products market due to rising consumer preference for ethically sourced and organic cocoa products, growing popularity of artisanal and dark chocolates, and increased adoption of cocoa in health and wellness applications
- Forastero cocoa segment dominated the market with the largest revenue share in 2024, primarily due to its widespread cultivation, high yield, and cost-effectiveness. This type of cocoa is commonly used in mass-market chocolate products and processed goods, making it a preferred choice among commercial manufacturers
Report Scope and North America Cocoa Products Market Segmentation
|
Attributes |
North America Cocoa Products Key Market Insights |
|
Segments Covered |
|
|
Countries Covered |
North America
|
|
Key Market Players |
|
|
Market Opportunities |
• Rising Demand for Organic and Ethically Sourced Cocoa Ingredients |
|
Value Added Data Infosets |
In addition to the insights on market scenarios such as market value, growth rate, segmentation, geographical coverage, and major players, the market reports curated by the Data Bridge Market Research also include in-depth expert analysis, pricing analysis, brand share analysis, consumer survey, demography analysis, supply chain analysis, value chain analysis, raw material/consumables overview, vendor selection criteria, PESTLE Analysis, Porter Analysis, and regulatory framework. |
North America Cocoa Products Market Trends
“Rising Preference for Premium and Artisanal Chocolate Products”
- Consumers across North America are increasingly opting for premium and handcrafted chocolate products due to evolving taste preferences and a growing interest in artisanal offerings
- Rising disposable income and heightened awareness of quality and sourcing are driving demand for high-quality, bean-to-bar chocolates throughout the region
- Brands are launching origin-specific and ethically sourced cocoa products to cater to luxury, sustainability-conscious, and health-focused segments
- Unique flavor innovations such as bourbon, sea salt, chili, and superfood-infused chocolates are gaining popularity among urban and millennial consumers
- For instance, in the U.S., several craft chocolate makers have introduced single-origin dark chocolates with transparent sourcing practices, appealing to consumers seeking premium, ethically produced treats
North America Cocoa Products Market Dynamics
Driver
“Increasing Health Awareness Boosting Demand for Functional Cocoa Products”
- Health-conscious consumers in North America are driving demand for cocoa products rich in flavonoids and antioxidants, particularly in dark chocolate and low-sugar formats
- Cocoa is increasingly being used in functional foods such as protein bars, nutritional shakes, and dietary supplements across the region
- Growing wellness trends and rising interest in heart-healthy indulgences are fueling demand for clean, minimally processed cocoa products
- Manufacturers are innovating with clean-label, organic, and high-cocoa-content offerings to appeal to fitness-conscious and ingredient-aware consumers
- For instance, in the U.S., brands such as Hu and Lily’s have launched dark chocolate products with high cocoa content and no added sugar, targeting health-driven buyers seeking both taste and nutritional benefits
Restraint/Challenge
“Volatility in Cocoa Prices and Supply Chain Disruptions”
- Global cocoa price fluctuations due to weather-related issues and political instability are impacting input costs for cocoa product manufacturers across North America
- Heavy reliance on cocoa imports exposes the region to foreign exchange risks, international market volatility, and potential shipping delays
- Supply chain disruptions, including port congestion and transportation bottlenecks, are creating challenges in the timely sourcing of raw cocoa ingredients
- Small and medium-sized enterprises (SMEs) in the region face difficulties managing price volatility, which affects their margins and overall competitiveness
- For instance, during the COVID-19 pandemic, manufacturers in the U.S. experienced delays and cost increases due to disrupted global supply chains and a surge in international cocoa prices
North America Cocoa Products Market Scope
The market is segmented into five notable segments based on type of cocoa, product type, source, application, and distribution channel.
• By Type of Cocoa
On the basis of type of cocoa, the North America cocoa products market is segmented into Forastero cocoa, Criollo cocoa, and Trinitario cocoa. The Forastero cocoa segment dominated the market with the largest revenue share in 2024, primarily due to its widespread cultivation, high yield, and cost-effectiveness. This type of cocoa is commonly used in mass-market chocolate products and processed goods, making it a preferred choice among commercial manufacturers.
The Criollo cocoa segment is expected to witness the fastest growth rate from 2025 to 2032, driven by increasing demand for premium and single-origin chocolate. Criollo beans are known for their fine flavor profile and are being increasingly adopted by artisanal and gourmet chocolate brands across countries such as Japan and Australia, where consumers are showing greater interest in high-quality, ethically sourced cocoa products.
• By Product Type
On the basis of product type, the market is segmented into cocoa butter, cocoa beans, cocoa powder & cake, cocoa liquor & paste, cocoa nibs, and others. The cocoa powder & cake segment held the largest market revenue share in 2024, driven by its extensive use in bakery, confectionery, and beverage applications. It is widely used by both commercial and household consumers for its affordability and versatility.
The cocoa butter segment is expected to witness the fastest growth rate from 2025 to 2032, owing to rising use in chocolates, cosmetics, and skincare formulations. The growing demand for clean-label and natural beauty products across North America has particularly increased cocoa butter’s relevance in the personal care and cosmetics industry.
• By Source
On the basis of source, the market is segmented into inorganic and organic. The inorganic segment accounted for the highest revenue share in 2024, supported by its established supply chains, cost-efficiency, and availability for large-scale manufacturing needs. Inorganic cocoa products are commonly utilized in high-volume commercial food and beverage processing.
The organic segment is expected to witness the fastest growth rate from 2025 to 2032, driven by increasing health consciousness, rising preference for chemical-free and sustainably sourced ingredients, and the proliferation of organic product offerings across retail channels in India, China, and Australia.
• By Application
On the basis of application, the North America cocoa products market is segmented into food & beverages, dietary supplements, personal care & cosmetics, and others. The food & beverages segment led the market in 2024 with the highest revenue share, attributed to the wide application of cocoa in chocolates, confectionery, dairy products, and ready-to-drink beverages.
The dietary supplements segment is expected to witness the fastest growth rate from 2025 to 2032, propelled by the expanding wellness trend and the increased inclusion of cocoa extracts in functional foods and nutraceuticals. Consumers in urban centers across Japan and South Korea are increasingly opting for cocoa-enriched supplements aimed at improving heart health and mood.
• By Distribution Channel
On the basis of distribution channel, the market is segmented into direct and indirect. The indirect segment dominated the market in 2024, backed by the growing reach of supermarkets, hypermarkets, convenience stores, and online platforms. The increasing popularity of e-commerce platforms and food delivery apps in North America has made cocoa-based products more accessible to consumers.
The direct segment is expected to witness the fastest growth rate from 2025 to 2032, particularly among business-to-business buyers, including food manufacturers and cosmetic companies sourcing cocoa ingredients directly from processors and certified cocoa cooperatives for greater quality control and traceability.
North America Cocoa Products Market Regional Analysis
- The U.S. cocoa products market dominated the North America region in 2024, attributed to high per capita chocolate consumption, innovation in cocoa-based product formulations, and widespread adoption of clean-label ingredients
- The country is home to several leading chocolate manufacturers and cocoa processors, enabling robust domestic production and supply chain integration. Rising consumer preference for healthy indulgence is fuelling demand for low-sugar, high-cocoa content offerings
- Furthermore, the U.S. market is witnessing notable growth in applications such as functional foods, nutraceuticals, and personal care, driven by increased awareness of the health benefits of cocoa antioxidants and flavonoids
Canada Cocoa Products Market Insight
The Canada cocoa products market is expected to witness the fastest growth rate from 2025 to 2032, supported by rising demand for artisanal and premium cocoa products. Canadian consumers are showing strong interest in organic and fair-trade cocoa, particularly in segments such as bakery, beverages, and plant-based snacks. In addition, the growing trend of ethical consumerism and interest in wellness-focused formulations is encouraging brands to innovate with dark chocolate, cocoa supplements, and clean-label beauty products. Expanding specialty retail channels and digital commerce platforms are further driving market growth across urban regions.
North America Cocoa Products Market Share
The North America Cocoa Products industry is primarily led by well-established companies, including:
- Cargill, Incorporated (U.S.)
- Blommer Chocolate Company (U.S.)
- Mars, Incorporated (U.S.)
- The Hershey Company (U.S.)
- Mondelez International (U.S.)
- Barry Callebaut North America (U.S.)
- Ghirardelli Chocolate Company (U.S.)
- Ciranda, Inc. (U.S.)
- United Cocoa Processor, Inc. (U.S.)
- Guittard Chocolate Company (U.S.)
SKU-

- Interactive Data Analysis Dashboard
- Company Analysis Dashboard for high growth potential opportunities
- Research Analyst Access for customization & queries
- Competitor Analysis with Interactive dashboard
- Latest News, Updates & Trend analysis
- Harness the Power of Benchmark Analysis for Comprehensive Competitor Tracking
North America Cocoa Products Market, Supply Chain Analysis and Ecosystem Framework
To support market growth and help clients navigate the impact of geopolitical shifts, DBMR has integrated in-depth supply chain analysis into its North America Cocoa Products Market research reports. This addition empowers clients to respond effectively to global changes affecting their industries. The supply chain analysis section includes detailed insights such as North America Cocoa Products Market consumption and production by country, price trend analysis, the impact of tariffs and geopolitical developments, and import and export trends by country and HSN code. It also highlights major suppliers with data on production capacity and company profiles, as well as key importers and exporters. In addition to research, DBMR offers specialized supply chain consulting services backed by over a decade of experience, providing solutions like supplier discovery, supplier risk assessment, price trend analysis, impact evaluation of inflation and trade route changes, and comprehensive market trend analysis.
Data collection and base year analysis are done using data collection modules with large sample sizes. The stage includes obtaining market information or related data through various sources and strategies. It includes examining and planning all the data acquired from the past in advance. It likewise envelops the examination of information inconsistencies seen across different information sources. The market data is analysed and estimated using market statistical and coherent models. Also, market share analysis and key trend analysis are the major success factors in the market report. To know more, please request an analyst call or drop down your inquiry.
The key research methodology used by DBMR research team is data triangulation which involves data mining, analysis of the impact of data variables on the market and primary (industry expert) validation. Data models include Vendor Positioning Grid, Market Time Line Analysis, Market Overview and Guide, Company Positioning Grid, Patent Analysis, Pricing Analysis, Company Market Share Analysis, Standards of Measurement, Global versus Regional and Vendor Share Analysis. To know more about the research methodology, drop in an inquiry to speak to our industry experts.
Data Bridge Market Research is a leader in advanced formative research. We take pride in servicing our existing and new customers with data and analysis that match and suits their goal. The report can be customized to include price trend analysis of target brands understanding the market for additional countries (ask for the list of countries), clinical trial results data, literature review, refurbished market and product base analysis. Market analysis of target competitors can be analyzed from technology-based analysis to market portfolio strategies. We can add as many competitors that you require data about in the format and data style you are looking for. Our team of analysts can also provide you data in crude raw excel files pivot tables (Fact book) or can assist you in creating presentations from the data sets available in the report.


