
North America Dehydrated Onion Market
Market Size in USD Million
 USD
41.96 Million
USD
68.93 Million
2025
2033
USD
41.96 Million
USD
68.93 Million
2025
2033
| 2026 - 2033 | |
| USD 41.96 Million | |
| USD 68.93 Million | |
| % | |
|
North America Dehydrated Onion Market Size
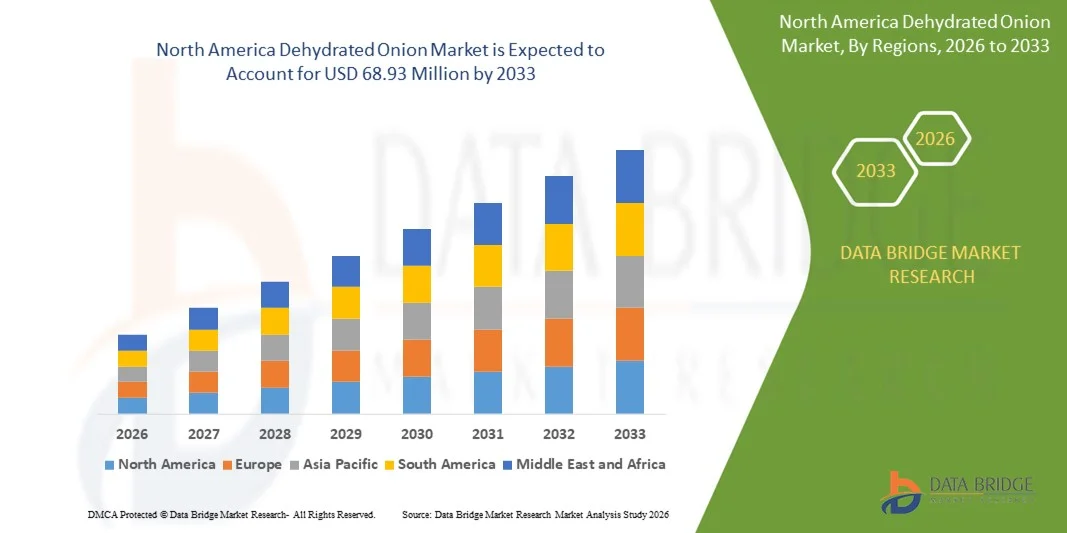
- The North America dehydrated onion market size was valued at USD 41.96 million in 2025 and is expected to reach USD 68.93 million by 2033, at a CAGR of 6.4% during the forecast period
- The market growth is largely driven by the increasing demand for long-shelf-life food ingredients and the expanding adoption of processed and convenience foods across both household and commercial food consumption. Rising urbanization and changing dietary patterns are encouraging food manufacturers and foodservice providers to rely on dehydrated onions for consistent flavor, reduced preparation time, and year-round availability
- Furthermore, the growing emphasis on cost efficiency, reduced food wastage, and simplified storage and transportation is positioning dehydrated onions as a preferred alternative to fresh onions. These combined factors are accelerating their adoption across food processing, foodservice, and industrial applications, thereby supporting sustained market expansion
North America Dehydrated Onion Market Analysis
- Dehydrated onions, produced through various drying technologies to remove moisture while retaining flavor and functional properties, are increasingly essential ingredients in processed foods, ready-to-eat meals, and culinary preparations due to their extended shelf life and operational convenience
- The rising demand for dehydrated onions is primarily supported by the growth of the global food processing industry, expanding quick-service restaurant chains, and increasing consumer preference for convenient cooking solutions that offer consistent quality and reduced handling requirements
- U.S. dominated the dehydrated onion market in 2025, due to its well-established food processing industry, extensive industrial kitchen infrastructure, and high demand for convenience ingredients across commercial and packaged food sectors
- Mexico is expected to be the fastest growing country in the dehydrated onion market during the forecast period due to rising industrial food production, expansion of foodservice outlets, and increasing demand for convenient, long-shelf-life culinary ingredients
- Powder segment dominated the market with a market share of around 40% in 2025, due to its extensive use across food processing industries due to uniform texture, long shelf life, and ease of blending in dry mixes. Dehydrated onion powder is widely preferred in soups, sauces, seasoning blends, and ready-to-eat products, where consistency and flavor dispersion are critical. Its lower storage and transportation costs further strengthen adoption among large-scale manufacturers
Report Scope and Dehydrated Onion Market Segmentation
|
Attributes |
Dehydrated Onion Key Market Insights |
|
Segments Covered |
|
|
Countries Covered |
North America
|
|
Key Market Players |
|
|
Market Opportunities |
|
|
Value Added Data Infosets |
In addition to the insights on market scenarios such as market value, growth rate, segmentation, geographical coverage, and major players, the market reports curated by the Data Bridge Market Research also include in-depth expert analysis, pricing analysis, brand share analysis, consumer survey, demography analysis, supply chain analysis, value chain analysis, raw material/consumables overview, vendor selection criteria, PESTLE Analysis, Porter Analysis, and regulatory framework. |
North America Dehydrated Onion Market Trends
Increasing Use of Dehydrated Onions in Foodservice and Industrial Cooking
- A significant trend in the dehydrated onion market is the growing adoption of dehydrated onions across foodservice, industrial kitchens, and packaged food manufacturing, driven by the rising need for convenient, time-saving, and consistent flavor ingredients. This trend is elevating dehydrated onions as essential components in processed food production, ready-to-eat meals, sauces, and seasoning blends
- For instance, Daksh Foods Pvt. Ltd. and Earth Expo Company are supplying a range of dehydrated onion powders and flakes to restaurants and large-scale food manufacturers in India, supporting uniform taste and extended usability across batches. Such products enhance operational efficiency in kitchens while ensuring consistent quality in mass food production
- The demand for dehydrated onions is further increasing in institutional catering and industrial kitchens, where bulk storage, extended shelf life, and reduced handling are critical. This positioning is driving growth as chefs and food processors increasingly prefer dehydrated onions over fresh alternatives for both reliability and cost-effectiveness
- Global food processing companies are integrating dehydrated onions into ready-to-eat meals, sauces, and snack formulations to maintain flavor stability and reduce spoilage risks. This incorporation is strengthening the market’s presence in packaged foods, creating greater dependency on standardized dehydrated onion products
- In emerging economies, industrial kitchens and small-scale food processors are adopting dehydrated onions to simplify inventory management and ensure consistent seasoning throughout production lines. The rising focus on convenience and labor efficiency is reinforcing the market adoption of dehydrated onion products
- The market is witnessing heightened utilization of dehydrated onions in soups, sauces, salad dressings, and processed snacks where uniform flavor and extended storage capability are essential. This is solidifying dehydrated onions as a preferred ingredient across diverse culinary applications and industrial processing segments
North America Dehydrated Onion Market Dynamics
Driver
Growing Need for Longer Shelf Life and Reduced Food Wastage
- The dehydrated onion market is primarily driven by the increasing demand for longer shelf life in food products and the need to reduce post-harvest losses and food waste. Dehydrated onions provide a cost-effective solution to preserve flavor, aroma, and nutritional content over extended periods, which is vital for both commercial kitchens and packaged food manufacturers
- For instance, Jain Irrigation Systems Ltd. offers advanced dehydrated onion products that maintain quality over several months, enabling food processors and distributors to optimize inventory and reduce spoilage. These solutions are particularly valuable in regions with supply chain limitations, helping manufacturers maintain consistent product availability
- The rising awareness of food sustainability and efficient storage is prompting foodservice and industrial sectors to adopt dehydrated onions to minimize wastage while ensuring consistent product quality. The ability to store and use these onions without frequent replenishment contributes directly to operational cost savings and resource efficiency
- Manufacturers increasingly prefer dehydrated onions for large-scale production due to their stable shelf life, predictable flavor profiles, and minimal storage requirements, which reduce logistical and supply chain challenges. This predictability is crucial for maintaining standardization in processed food and culinary applications
- The expanding industrial food processing sector, particularly in emerging markets, is adopting dehydrated onions to meet growing consumer demand for packaged foods and ready-to-cook meal solutions. This trend is further reinforcing the market as dehydrated onions become integral to maintaining product consistency at scale
Restraint/Challenge
Quality Degradation During Drying and Storage
- The dehydrated onion market faces challenges related to maintaining flavor, color, aroma, and nutritional content during drying, storage, and transportation. Improper drying methods, excessive heat, or prolonged storage can lead to significant quality loss, reducing product appeal and limiting adoption in premium food applications
- For instance, Green Rootz and Harmony House Foods, Inc. have highlighted challenges in preserving the natural pungency and color of onions during spray drying and bulk storage, which can impact consumer acceptance and end-product taste. Ensuring consistent quality across large batches requires sophisticated drying and packaging technologies
- Variations in moisture content and exposure to oxygen or humidity during storage further exacerbate degradation, posing logistical challenges for both domestic and international distribution. These issues necessitate stringent quality control and advanced packaging solutions to extend usability without compromising flavor
- The market is constrained by the high cost of optimized drying technologies such as vacuum or freeze drying, which are required to preserve delicate flavors and nutrients. While these methods improve quality retention, they increase production expenses, limiting widespread adoption among small and medium-scale producers
- Manufacturers must balance operational efficiency with the need to maintain premium product quality, which remains a critical challenge for the dehydrated onion market. Overcoming these barriers is essential for sustaining growth and meeting rising demand from industrial and foodservice segments
North America Dehydrated Onion Market Scope
The market is segmented on the basis of form, packaging, nature, variety, technology, distribution channel, end user, and application.
- By Form
On the basis of form, the dehydrated onion market is segmented into whole, powder, granules, slices, kibbled, cubes, minced, chopped, flakes, rings, diced, crosscuts, chunks, paste, and others. The powder segment dominated the market with the largest share of around 40% in 2025, driven by its extensive use across food processing industries due to uniform texture, long shelf life, and ease of blending in dry mixes. Dehydrated onion powder is widely preferred in soups, sauces, seasoning blends, and ready-to-eat products, where consistency and flavor dispersion are critical. Its lower storage and transportation costs further strengthen adoption among large-scale manufacturers.
The flakes segment is expected to witness the fastest growth from 2026 to 2033, supported by rising demand from foodservice and premium culinary applications. Onion flakes retain visual appeal, aroma, and texture closer to fresh onions, making them suitable for gourmet foods, instant meals, and toppings. Growing consumer preference for minimally processed ingredients also supports accelerated demand for flake-based formats.
- By Packaging
On the basis of packaging, the dehydrated onion market is segmented into bags/pouches, cans, aseptic cartons, and reusable jars. Bags and pouches accounted for the largest market share in 2025, owing to their cost efficiency, lightweight nature, and suitability for bulk transportation in B2B supply chains. Flexible packaging provides moisture resistance and extended shelf stability, which is essential for dehydrated products. Food processors and distributors favor this format for easy handling and reduced logistics costs.
Reusable jars are projected to register the fastest growth rate during the forecast period, driven by rising retail sales and consumer inclination toward sustainable and refillable packaging. These jars enhance product visibility, convenience, and perceived quality, particularly in urban and premium retail channels. Increasing household consumption of dehydrated ingredients further accelerates this trend.
- By Nature
On the basis of nature, the market is segmented into organic and conventional dehydrated onions. The conventional segment dominated the market in 2025, supported by higher availability, lower production costs, and strong penetration across mass food manufacturing. Conventional dehydrated onions remain the preferred choice for large-volume applications in snacks, sauces, and processed foods due to price stability. Established supply chains also ensure consistent quality and scalability.
The organic segment is anticipated to grow at the fastest pace from 2026 to 2033, fueled by increasing consumer awareness regarding clean-label and chemical-free food products. Rising demand from health-conscious consumers and premium food brands supports this growth. Expanding organic farming acreage and certification initiatives further strengthen long-term prospects.
- By Variety
On the basis of variety, the dehydrated onion market is segmented into white onions, red onions, pink onions, and hybrid. White onions held the largest market revenue share in 2025, driven by their mild flavor, high pungency stability after dehydration, and widespread use in processed foods. Their consistent taste profile makes them suitable for diverse culinary and industrial applications. Food manufacturers favor white onions for standardized formulations.
Hybrid onions are expected to witness the fastest growth rate during the forecast period, supported by improved yield, uniform bulb size, and enhanced dehydration efficiency. These varieties offer better shelf stability and flavor retention, attracting processors focused on operational efficiency. Advancements in seed technology further promote adoption.
- By Technology
On the basis of technology, the market is segmented into vacuum drying, air drying, spray drying, microwave drying, freeze drying, drum drying, fried, and others. Air drying dominated the market in 2025, owing to its cost-effectiveness and large-scale applicability across developing and developed regions. This method supports high-volume production while maintaining acceptable flavor and texture characteristics. Its relatively low capital requirement makes it widely accessible.
Freeze drying is projected to be the fastest-growing technology from 2026 to 2033, driven by its superior ability to preserve aroma, color, and nutritional value. Premium food and pharmaceutical applications increasingly favor freeze-dried onions for high-quality formulations. Growing demand for value-added and premium dehydrated products accelerates adoption.
- By Distribution Channel
On the basis of distribution channel, the dehydrated onion market is segmented into B2B and B2C. The B2B segment dominated the market in 2025, supported by strong demand from food processors, snack manufacturers, and foodservice operators. Bulk purchasing, long-term contracts, and consistent volume requirements contribute to sustained dominance. Dehydrated onions serve as a critical ingredient across multiple industrial food categories.
The B2C segment is expected to grow at the fastest rate over the forecast period, driven by rising household usage and expansion of online and organized retail platforms. Consumers increasingly adopt dehydrated onions for convenience cooking and longer shelf life. Improved packaging and branding further enhance retail penetration.
- By End User
On the basis of end user, the market is segmented into household, food processing, food services, and industrial. The food processing segment accounted for the largest market share in 2025, driven by extensive utilization in sauces, seasonings, snacks, and ready meals. Dehydrated onions offer consistency, reduced preparation time, and year-round availability, making them essential for processors. High-volume demand ensures steady consumption.
The food services segment is anticipated to witness the fastest growth from 2026 to 2033, supported by the rapid expansion of quick-service restaurants and cloud kitchens. Dehydrated onions provide operational efficiency and reduced wastage for commercial kitchens. Growing urbanization and eating-out trends reinforce this growth trajectory.
- By Application
On the basis of application, the dehydrated onion market is segmented into culinary, soups, sauces, salad dressings, snacks and convenience food, bakery products, beverages, pharmaceuticals, dietary supplements, personal care and cosmetics, meat and poultry products, and others. Soups and sauces dominated the market in 2025, driven by consistent demand from packaged and ready-to-eat food manufacturers. Dehydrated onions enhance flavor intensity while ensuring longer shelf stability in liquid and semi-solid formulations. Their ease of rehydration further supports extensive use.
Dietary supplements and pharmaceuticals are expected to register the fastest growth rate during the forecast period, supported by increasing utilization of onion-based bioactive compounds. Rising interest in natural ingredients for immunity and wellness applications fuels this trend. Ongoing research into functional food ingredients strengthens long-term demand.
North America Dehydrated Onion Market Regional Analysis
- U.S. dominated the dehydrated onion market with the largest revenue share in 2025, driven by its well-established food processing industry, extensive industrial kitchen infrastructure, and high demand for convenience ingredients across commercial and packaged food sectors
- Strong regulations enforced by agencies such as the U.S. Food and Drug Administration, along with continuous investments in food safety, quality control, and advanced drying technologies, encourage widespread adoption of dehydrated onion products across restaurants, catering services, and industrial food manufacturers.
- Rising focus on standardized, flavor-stable, and long-shelf-life onion powders, flakes, and slices, combined with increasing use in ready-to-cook meals, sauces, snacks, and processed foods, ensures that the U.S. maintains its dominant role throughout the forecast period. Leading domestic and international suppliers such as Harmony House Foods, Inc. and Jain Irrigation Systems Ltd. further reinforce the country’s leadership position in the regional market
Canada Dehydrated Onion Market Insight
Canada is projected to register steady growth in the North America dehydrated onion market from 2026 to 2033, supported by growing industrial kitchen setups, rising packaged food production, and increasing adoption of dehydrated onions in foodservice and culinary applications. Expanding use of high-quality, shelf-stable onion powders and flakes by urban food processors is accelerating market growth. For instance, collaborations between Canadian food ingredient distributors and global suppliers are improving product availability and consistency for industrial and commercial kitchens. Government initiatives promoting food safety, combined with rising focus on operational efficiency and reducing food waste, position Canada as a steadily growing market in the region.
Mexico Dehydrated Onion Market Insight
Mexico is expected to record the fastest CAGR in the North America dehydrated onion market from 2026 to 2033, driven by rising industrial food production, expansion of foodservice outlets, and increasing demand for convenient, long-shelf-life culinary ingredients. Growth in small- and medium-scale food processors and restaurants adopting dehydrated onions for consistent flavor and ease of storage is accelerating market penetration. Partnerships between regional suppliers such as Daksh Foods Pvt. Ltd., Earth Expo Company, and local distributors, along with investments in modern drying and packaging technologies, are enhancing product accessibility. Government initiatives supporting food processing modernization, coupled with rising urbanization and growing consumer preference for processed and ready-to-cook meals, ensure Mexico’s emergence as the fastest-growing market in the region.
North America Dehydrated Onion Market Share
The dehydrated onion industry is primarily led by well-established companies, including:
- Daksh Foods Pvt. Ltd. (India)
- Earth Expo Company (India)
- Green Rootz (India)
- Harmony House Foods, Inc. (U.S.)
- Jain Irrigation Systems Ltd (India)
- JIYAN FOOD INGREDIENTS (India)
- Natural Dehydration (India)
- Olam Group (Singapore)
- Real Dehydrates Pvt Ltd (India)
- Silva International (U.S.)
- Van Drunen Farms (U.S.)
- B.K.Dehy Foods (India)
- Rocky Mountain Spice Company (U.S.)
- Viji Foods (India)
- Qingdao UnisonEco Food Technology Co., Ltd. (China)
- Murtuza Foods Pvt Ltd (India)
- Adegermex (Mexico)
- Freeze-Dry Foods (Germany)
Latest Developments in North America Dehydrated Onion Market
- In January 2024, S4S Technologies, a decentralized agri-processing startup based in India, continued its mission to reduce farm-level food wastage by deploying solar conduction dryers to smallholder farmers. These dryers extend the shelf life of produce—such as onions—without using chemicals or preservatives, enabling year-round storage and processing. S4S also purchases the dehydrated output from farmers and supplies it to food processing companies, creating a circular supply chain that boosts farmer income and reduces post-harvest losses. This collaborative model supports sustainable agriculture and empowers women-led micro-entrepreneurs across rural India
- In March 2023, the Government of India announced plans to irradiate onions post-harvest using gamma radiation to reduce spoilage and extend shelf life. The initiative, led by the Bhabha Atomic Research Centre (BARC), targets rabi-season onions, which are more suitable for long-term storage. By treating onions with ionizing radiation before placing them in cold storage, the government aims to cut post-harvest losses from 25% to around 10–12%. This move stabilizes onion supply and prices and also indirectly supports the dehydrated onion market by ensuring a more consistent raw material base
- In March 2023, the Pangasinan State University (PSU) and the Department of Science and Technology Food Innovation Center (DOST-FIC) in the Philippines launched innovative manufacturing technologies for onion powder and shrimp paste (“bagoong”) using spray-drying techniques. These solutions aim to improve shelf life, reduce sodium content, and enhance portability—addressing common challenges in traditional packaging and storage. The onion powder, derived from shallots and red onion varieties, offers a cost-effective alternative during peak harvest seasons. This initiative reflects the region’s commitment to food innovation and supports the growing market for dehydrated condiments
- In October 2021, Olam Food Ingredients (OFI) partnered with food safety innovator Agri-Neo to launch the industry’s first organically pasteurized dried onions. The collaboration combines OFI’s global leadership in dried onion production with Agri-Neo’s Neo-Pure™ technology—a certified-organic, non-thermal pasteurization system that eliminates pathogens such as Salmonella and E. coli without using radiation. This breakthrough enhances food safety for both conventional and organic ingredients while preserving taste, color, and aroma. The partnership reflects OFI’s commitment to delivering high-quality, traceable ingredients and marks a milestone in organic food processing innovation
- In January 2021, Anuha Food Products Pvt. Ltd., an Indian startup, launched a range of ready-to-cook products under its gluten-free brand Zilli’s. The lineup includes dehydrated onion flakes, garlic cloves, ginger, tamarind, red onion powder, and fruit rolls—designed to simplify cooking while preserving nutritional value. With a shelf life of 12 to 18 months, these products cater to health-conscious consumers seeking convenience and long-term storage. Supported by Atal Innovation Mission and Startup India, Zilli’s reflects a growing trend in India’s food
SKU-

- Interactive Data Analysis Dashboard
- Company Analysis Dashboard for high growth potential opportunities
- Research Analyst Access for customization & queries
- Competitor Analysis with Interactive dashboard
- Latest News, Updates & Trend analysis
- Harness the Power of Benchmark Analysis for Comprehensive Competitor Tracking
North America Dehydrated Onion Market, Supply Chain Analysis and Ecosystem Framework
To support market growth and help clients navigate the impact of geopolitical shifts, DBMR has integrated in-depth supply chain analysis into its North America Dehydrated Onion Market research reports. This addition empowers clients to respond effectively to global changes affecting their industries. The supply chain analysis section includes detailed insights such as North America Dehydrated Onion Market consumption and production by country, price trend analysis, the impact of tariffs and geopolitical developments, and import and export trends by country and HSN code. It also highlights major suppliers with data on production capacity and company profiles, as well as key importers and exporters. In addition to research, DBMR offers specialized supply chain consulting services backed by over a decade of experience, providing solutions like supplier discovery, supplier risk assessment, price trend analysis, impact evaluation of inflation and trade route changes, and comprehensive market trend analysis.
Data collection and base year analysis are done using data collection modules with large sample sizes. The stage includes obtaining market information or related data through various sources and strategies. It includes examining and planning all the data acquired from the past in advance. It likewise envelops the examination of information inconsistencies seen across different information sources. The market data is analysed and estimated using market statistical and coherent models. Also, market share analysis and key trend analysis are the major success factors in the market report. To know more, please request an analyst call or drop down your inquiry.
The key research methodology used by DBMR research team is data triangulation which involves data mining, analysis of the impact of data variables on the market and primary (industry expert) validation. Data models include Vendor Positioning Grid, Market Time Line Analysis, Market Overview and Guide, Company Positioning Grid, Patent Analysis, Pricing Analysis, Company Market Share Analysis, Standards of Measurement, Global versus Regional and Vendor Share Analysis. To know more about the research methodology, drop in an inquiry to speak to our industry experts.
Data Bridge Market Research is a leader in advanced formative research. We take pride in servicing our existing and new customers with data and analysis that match and suits their goal. The report can be customized to include price trend analysis of target brands understanding the market for additional countries (ask for the list of countries), clinical trial results data, literature review, refurbished market and product base analysis. Market analysis of target competitors can be analyzed from technology-based analysis to market portfolio strategies. We can add as many competitors that you require data about in the format and data style you are looking for. Our team of analysts can also provide you data in crude raw excel files pivot tables (Fact book) or can assist you in creating presentations from the data sets available in the report.


