
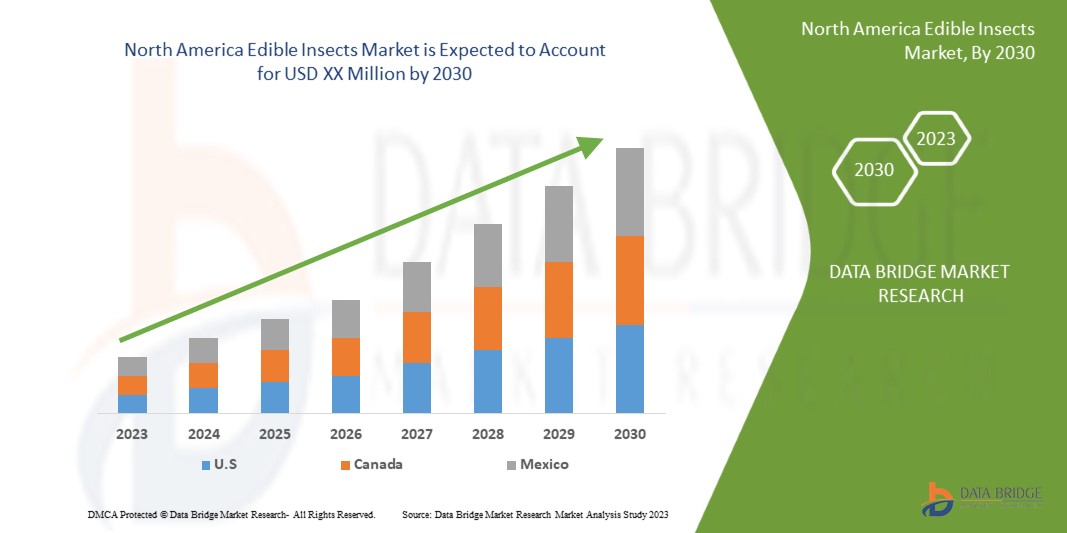
North America Edible Insects Market Analysis and Insights
North America edible insects market is driven by the factors such as rising inclination towards the consumption of protein-rich food as well as the commercial benefit of insect farming leading to the market growth.
One of the primary factors driving the growth of the edible insects market is the rising inclination toward the consumption of protein-rich food. The continuing clinical trial research conducted by several food safety businesses to better edible meat choices and the potential of edible insects as a new source of bioactive compounds is leading to market expansion. The market is also influenced by increased human foodborne pathogen prevalence in insects. However, ethical barriers associated with tradition and culture, lack of awareness amongst the population, especially in developing countries, and a prolonged time for regulatory framework may act as restraining factors for the North America edible insects market in the forecast period.
The demand for edible insects is expected to increase in North America owing to the rising malnutrition population.
The North America edible insects market is supportive and aims to reduce the risk of transmitting zoonotic diseases with the consumption of edible insects. Data Bridge Market Research analyses that the North America edible insects market will grow at a CAGR of 24.6% during the forecast period of 2023 to 2030.
|
Report Metric |
Details |
|
Forecast Period |
2023 to 2030 |
|
Base Year |
2022 |
|
Historic Years |
2021 (Customizable to 2014 - 2019) |
|
Quantitative Units |
Revenue in Million, Pricing in USD |
|
Segments Covered |
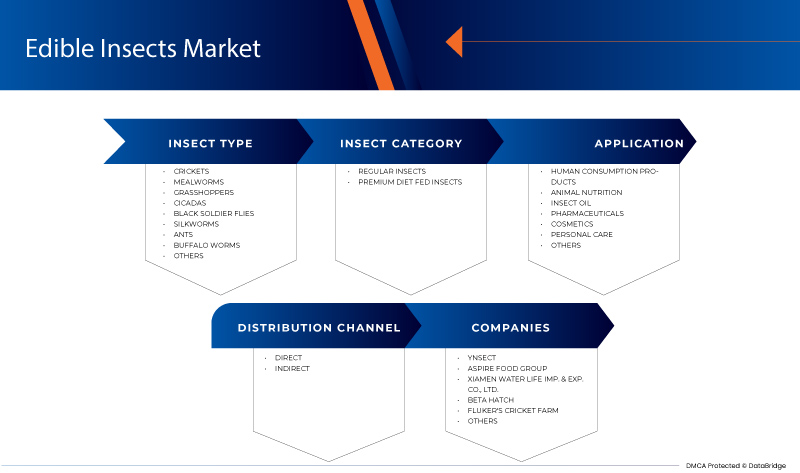
Insect Type (Crickets, Mealworms, Black Soldier Flies, Buffalo's, Grasshoppers, Ants, Silkworms, Cicadas, and Others), Insect Category (Regular Insects, and Premium Diet-Fed Insects), Application (Human Consumption Products, Animal Nutrition, Insect Oil, Pharmaceuticals, Cosmetics, Personal Care, and Others), Distribution Channel (Direct, Indirect) |
|
Countries Covered |
U.S., Canada, Mexico |
|
Market Players Covered |
Ynsect, Aspire Food Group, BETA HATCH, Fluker's Cricket Farm, Entomo Farms, Enviroflight, Chapul, LLC, Symton Black Soldier Fly, and Armstrong Crickets Georgia among others |
Market Definition
Edible insects constitute high-quality food for humans, livestock, poultry, and fish. As insects are cold-blooded, they have a high food conversion rate. Some insects are a source of complete protein and provide similar essential proteins to the vegetarian diet.
The usage of edible insects for animal feed is being considered for rapid and quick nutritional deficiency among animals. This potential utilization also helps in the mass distribution and scalability of animal feed in a short span of time. The edible insects' animal feed is also sustainable as they play a major role in making the food chain circular.
North America Edible Insects Market Dynamics
Drivers
- Commercial benefit of insect farming
Most edible insects are harvested in the wild, but a few insect species have been domesticated because of their commercially valuable products. Silkworms and bees are the best-known examples. Sericulture, the practice of rearing silkworms for the production of raw silk, has its origin in China.
Insects are also reared in agriculture to either combat insect pests or for pollination. In biological control, large rearing companies mass produce beneficial insects such as predators and parasitoids. These insects are often sold to fruit, vegetable, and flower farmers to combat insect pests and are also used in large estate crops, for instance, egg parasitoids (Trichogramma spp.) and larval parasitoids (Cotesia flavipes) to combat sugarcane borers. Bumblebees (Bombus spp.) and honeybees (Apis spp.) are reared worldwide to help farmers pollinate crops and fruit orchards.
Hence, it can be concluded that the commercial benefits of insect farming are propelling the growth of the North America edible insects market.
- Suitable alternative to high-cost conventional protein sources
The nutritional values of edible insects are highly variable, not least because of the wide variety of species. Like most foods, preparation and processing methods (for instance, drying, boiling, or frying) applied before consumption will also influence the nutritional composition. Nevertheless, because of their nutritional value, they are still a highly significant food source for human populations. Protein content also depends on the feed (for instance, vegetables, grains, or waste).
Grasshoppers in Nigeria that are fed with bran, which contains high levels of essential fatty acids, have almost double the protein content of those fed on maize. The protein content of insects also depends on the metamorphosis stage. Adults usually have higher protein content than instars.
Hence, the use of insect-based proteins as an alternative to high-cost plant and animal-based proteins is anticipated to propel the market's growth in the forecast period.
Opportunities
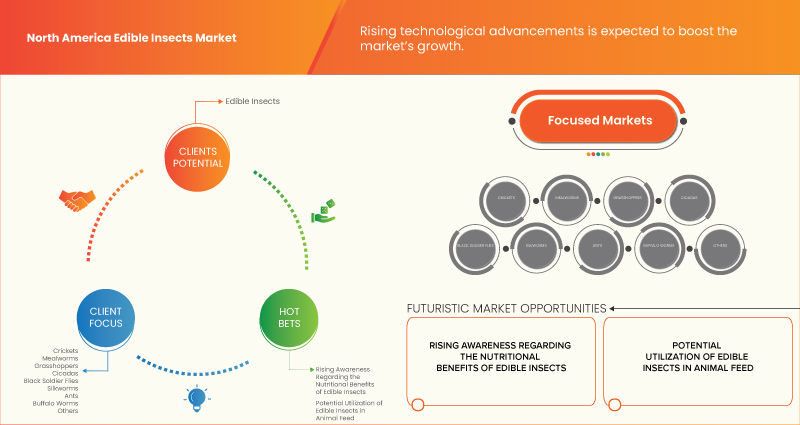
- Rising awareness regarding nutritional benefits
A nutritionally balanced diet is essential for the growth, development, and performance of animals; therefore, edible insects are turning out to be a potential nutritional option for a balanced diet. Insect ingredients act as an important source of nutrition for animals, with numerous potential health benefits
The usage of edible insects for animal feed is being considered for rapid and quick nutritional deficiency among animals. This potential utilization also helps in the mass distribution and scalability of animal feed in a short span of time. The edible insects animal feed is also sustainable as they play a major role in making the food chain circular.
However, edible insects are regulated in the same manner as any other food per the FDA informal policy, as insects are subject to food additive regulations which are managed by Generally Recognition of Safety.
Restraints/Challenges
- Increasing major food safety hazards and guidelines
Food safety hazards play an important role in the edible insects market. These stringent rules and regulations are necessary for government approval to ensure the security and safety of humans and the environment. The various or rising food safety hazards from edible insects could be biological, chemical, or physical hazards, including bacteria, viruses, fungi, mycotoxins, pesticides, parasites, and antimicrobials.
Major subsystem participants may favor or be less responsive to stringent guidelines and regulations of the industry when profit levels decrease, as stringent regulation will raise investment and production costs and potentially reduce margins for all farmers or insects cultivators and end users.
However, carrying along issues of safety and the need to establish a new legal framework are set to be ruled among various countries.
Recent Development
- In January 2023, Yensect expanded its North America presence and completed the construction of Ynfarm, the world's biggest insect farm, accelerating its delivery to clients.
- In June 2022, Aspire supported the advancement of insect agriculture through its sponsorship of the Educational Leadership Chair in the Production and Primary Processing of Edible Insects at Université Laval. The company believes this will help them spread awareness regarding edible insects.
North America Edible Insects Market Segmentation
The North America edible insects market is categorized into four notable segments based on insect type, insect category, application, and distribution channel. The growth among segments helps you analyze niche pockets of growth and strategies to approach the market and determine your core application areas and the difference in your target markets.
Insect Type
- Crickets
- Mealworms
- Grasshoppers
- Cicadas
- Black soldier flies
- Silkworms
- Ants
- Buffalo's
- Others
On the basis of insect type, the North America edible insects market is segmented into crickets, mealworms, black soldier flies, buffalo's, grasshoppers, ants, silkworms, cicadas, and others.
Insect category
- Regular Insects
- Premium Diet Fed Insects
On the basis of insect category, the North America edible insects market is segmented into regular insects and premium diet fed insects.
Application
- Human Consumption Products
- Animal Nutrition
- Insect Oil
- Pharmaceuticals
- Cosmetics
- Personal Care
- Others
On the basis of application, the North America edible insects market is segmented into human consumption products, animal nutrition, insect oil, pharmaceuticals, cosmetics, and personal care, others.
Distribution Channel
- Direct
- Indirect
On the basis of distribution channel, the North America edible insects market is segmented into direct and indirect.
Edible Insects Market Regional Analysis/Insights
The North America edible insects market is analyzed, and market size insights and trends are provided by insect type, insect category, application, and distribution channel as referenced above.
The countries covered in the North America edible insects market report are U.S., Canada, and Mexico.
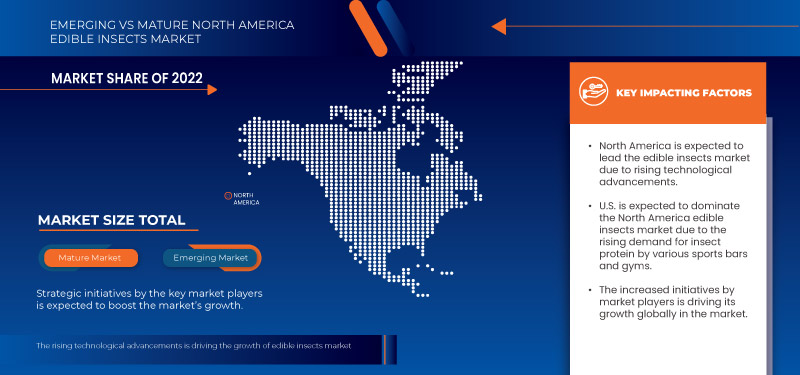
The U.S is expected to dominate the North America edible insects market due to increasing technological advancement in developing areas.
The country section of the report also provides individual market impacting factors and changes in market regulation that impact the current and future trends of the market. Data points such as downstream and upstream value chain analysis, technical trends, porter's five forces analysis, case studies are some of the pointers used to forecast the market scenario for individual countries. Also, the presence and availability of North America brands and their challenges faced due to large or scarce competition from local and domestic brands, the impact of domestic tariffs, and trade routes are considered while providing forecast analysis of the country data.
Competitive Landscape and Edible Insects Market Share Analysis
North America edible insects market competitive landscape provides details by the competitors. Details included are company overview, company financials, revenue generated, market potential, investment in research and development, new market initiatives, North America presence, production sites and facilities, production capacities, company strengths and weaknesses, product launch, product width and breadth, and application dominance. The above data points provided are only related to the companies focus on the North America edible insects market.
Some players in the North America edible insects market are Ynsect, Aspire Food Group, BETA HATCH, Fluker's Cricket Farm, Entomo Farms, Enviroflight, Chapul, LLC, Symton Black Soldier Fly, and Armstrong Crickets Georgia among others.
SKU-

- Interactive Data Analysis Dashboard
- Company Analysis Dashboard for high growth potential opportunities
- Research Analyst Access for customization & queries
- Competitor Analysis with Interactive dashboard
- Latest News, Updates & Trend analysis
- Harness the Power of Benchmark Analysis for Comprehensive Competitor Tracking
Table of Content
1 INTRODUCTION
1.1 OBJECTIVES OF THE STUDY
1.2 MARKET DEFINITION
1.3 OVERVIEW OF THE NORTH AMERICA EDIBLE INSECTS MARKET
1.4 CURRENCY AND PRICING
1.5 LIMITATIONS
1.6 MARKETS COVERED
2 NORTH AMERICA EDIBLE INSECTS MARKET: SEGMENTATION
2.1 MARKETS COVERED
2.2 GEOGRAPHICAL SCOPE
2.3 YEARS CONSIDERED FOR THE STUDY
2.4 DBMR TRIPOD DATA VALIDATION MODEL
2.5 PRIMARY INTERVIEWS WITH KEY OPINION LEADERS
2.6 MULTIVARIATE MODELLING
2.7 INSECT TYPE LIFELINE CURVE
2.8 DBMR MARKET POSITION GRID
2.9 VENDOR SHARE ANALYSIS
2.1 MARKET APPLICATION COVERAGE GRID
2.11 SECONDARY SOURCES
3 EXECUTIVE SUMMARY
4 PREMIUM INSIGHTS
4.1 PORTERS FIVE FORCES
4.2 CUSTOMER BARGAINING POWER:
4.3 SUPPLIER BARGAINING POWER:
4.4 THE THREAT OF NEW ENTRANTS
4.5 THE THREAT OF SUBSTITUTES
4.6 INTERNAL COMPETITION (RIVALRY)
4.7 IMPORT-EXPORT ANALYSIS
4.8 INDUSTRY TRENDS AND FUTURE PERSPECTIVE
4.9 GROWTH STRATEGIES ADOPTED BY KEY MARKET PLAYERS
4.1 SUPPLY CHAIN ANALYSIS
4.11 DESIGNING A SUPPLY CHAIN AND ITS IMPORTANCE
4.12 SCENARIO IN ASIAN COUNTRIES
4.13 SCENARIO IN AFRICA AND EUROPEAN UNION
4.14 ADOPTION OF E-COMMERCE
4.15 CONCLUSION
4.16 TECHNOLOGICAL OVERVIEW ON PRODUCTION METHODS
4.17 VALUE CHAIN OF EDIBLE INSECTS MARKET -
4.18 IMPACT OF ECONOMIC SLOWDOWN ON MARKET
5 REGULATORY FRAMEWORK AND GUIDELINES
5.1 REGULATORY SCENARIO IN EUROPEAN UNION
5.2 REGULATORY SCENARIO IN AMERICAS
5.3 REGULATORY SCENARIO IN ASIA-PACIFIC
5.4 REGULATORY SCENARIO IN MIDDLE EAST AND AFRICA
6 MARKET OVERVIEW
6.1 DRIVERS
6.1.1 RISING INCLINATION TOWARDS THE CONSUMPTION OF PROTEIN-RICH FOOD COUPLED WITH CHANGING FOOD HABITS OF MANY INDIVIDUALS
6.1.2 COMMERCIAL BENEFIT OF INSECT FARMING
6.1.3 SUITABLE ALTERNATIVE TO HIGH-COST CONVENTIONAL PROTEIN SOURCES
6.1.4 MINIMAL RISK OF TRANSMITTING ZOONOTIC DISEASES WITH THE CONSUMPTION OF EDIBLE INSECTS
6.2 RESTRAINTS
6.2.1 LACK OF AWARENESS REGARDING THE CONSUMPTION OF EDIBLE INSECTS
6.2.2 NON-STANDARDIZED REGULATORY FRAMEWORK IN SOME REGIONS
6.2.3 INCREASING PSYCHOLOGICAL AND ETHICAL BARRIERS
6.3 OPPORTUNITIES
6.3.1 RISING AWARENESS REGARDING NUTRITIONAL BENEFITS
6.3.2 POTENTIAL UTILIZATION OF EDIBLE INSECTS FOR ANIMAL FEED
6.4 CHALLENGES
6.4.1 INCREASING MAJOR FOOD SAFETY HAZARDS AND GUIDELINES
6.4.2 THREAT OF RISING PREVALENCE OF CHRONIC DISEASE
7 NORTH AMERICA EDIBLE INSECTS MARKET, BY INSECT TYPE
7.1 OVERVIEW
7.2 CRICKETS
7.3 MEALWORMS
7.4 GRASSHOPPERS
7.5 CICADAS
7.6 BLACK SOLDIER
7.7 SILKWORMS
7.8 ANTS
7.9 BUFFALO WORMS
7.1 OTHERS
8 NORTH AMERICA EDIBLE INSECTS MARKET, BY INSECT CATEGORY
8.1 OVERVIEW
8.2 REGULAR INSECTS
8.3 PREMIUM DIET FED INSECTS
9 NORTH AMERICA EDIBLE INSECTS MARKET, BY APPLICATION
9.1 OVERVIEW
9.2 HUMAN CONSUMPTION PRODUCTS
9.2.1 HUMAN CONSUMPTION PRODUCTS, BY TYPE
9.2.1.1 WHOLE INSECTS
9.2.1.2 INSECT FLOURS AND POWDER
9.2.1.3 NUTRITION INSECTS BAR
9.2.1.4 INSECT SNACKS
9.2.1.4.1 PROCESSED INSECTS
9.2.1.4.2 CHIPS
9.2.1.4.3 CRACKERS
9.2.1.5 BEVERAGES
9.2.1.5.1 PROTEIN DRINKS
9.2.1.5.2 INSECT DRINKS
9.2.1.5.3 BEER
9.2.1.5.4 SOFT DRINKS
9.2.1.5.5 SPIRITS
9.2.1.6 PROCESSED FOOD
9.2.1.6.1 PASTA
9.2.1.6.2 NOODLES
9.2.1.7 CONFECTIONERY
9.2.1.7.1 CANDIES
9.2.1.7.2 LOLLIES
9.2.1.7.3 CHOCOLATES
9.2.1.8 INSECT BAKERY
9.2.1.8.1 COOKIES
9.2.1.8.2 BREAD
9.2.2 HUMAN CONSUMPTION PRODUCTS, BY INSECT TYPE
9.2.2.1 CRICKETS
9.2.2.2 MEALWORMS
9.2.2.3 GRASSHOPPERS
9.2.2.4 CICADAS
9.2.2.5 BLACK SOLDIER FLIES
9.2.2.6 SILKWORMS
9.2.2.7 ANTS
9.2.2.8 BUFFALO WORMS
9.2.2.9 OTHERS
9.3 ANIMAL NUTRITION
9.3.1 ANIMAL NUTRITION, BY PRODUCT TYPE
9.3.1.1 INSECT MEAL
9.3.1.2 INSECT PROTEIN (AS INGREDIENT)
9.3.2 ANIMAL NUTRITION, BY LIVESTOCK TYPE
9.3.2.1 AQUATIC NUTRITION
9.3.2.1.1 FISH
9.3.2.1.2 CRUSTACEANS
9.3.2.1.3 MOLLUSKS
9.3.2.2 PET NUTRITION
9.3.2.3 SWINE NUTRITION
9.3.2.3.1 SOW
9.3.2.3.2 GROWER
9.3.2.3.3 STARTER
9.3.2.4 POULTRY NUTRITION
9.3.2.4.1 BROILERS
9.3.2.4.2 LAYERS
9.3.2.4.3 BREEDERS
9.3.2.5 RUMINANT NUTRITION
9.3.2.5.1 BEEF CATTLE
9.3.2.5.2 DAIRY CATTLE
9.3.2.5.3 CALVES
9.3.3 ANIMAL NUTRITION, BY INSECT TYPE
9.3.3.1 CRICKETS
9.3.3.2 MEALWORMS
9.3.3.3 GRASSHOPPERS
9.3.3.4 CICADAS
9.3.3.5 BLACK SOLDIER FLIES
9.3.3.6 SILKWORMS
9.3.3.7 ANTS
9.3.3.8 BUFFALO WORMS
9.3.3.9 OTHERS
9.4 INSECT OIL
9.4.1 CRICKETS
9.4.2 MEALWORMS
9.4.3 GRASSHOPPERS
9.4.4 CICADAS
9.4.5 BLACK SOLDIER FLIES
9.4.6 SILKWORMS
9.4.7 ANTS
9.4.8 BUFFALO WORMS
9.4.9 OTHERS
9.5 PHARMACEUTICAL
9.5.1 CRICKETS
9.5.2 MEALWORMS
9.5.3 GRASSHOPPERS
9.5.4 CICADAS
9.5.5 BLACK SOLDIER FLIES
9.5.6 SILKWORMS
9.5.7 ANTS
9.5.8 BUFFALO WORMS
9.5.9 OTHERS
9.6 COSMETICS
9.6.1 CRICKETS
9.6.2 MEALWORMS
9.6.3 GRASSHOPPERS
9.6.4 CICADAS
9.6.5 BLACK SOLDIER FLIES
9.6.6 SILKWORMS
9.6.7 ANTS
9.6.8 BUFFALO WORMS
9.6.9 OTHERS
9.7 PERSONAL CARE
9.7.1 PERSONAL CARE, BY TYPE
9.7.1.1 SKIN CARE
9.7.1.2 HAIR CARE
9.7.2 PERSONAL CARE, BY INSECT TYPE
9.7.2.1 CRICKETS
9.7.2.2 MEALWORMS
9.7.2.3 GRASSHOPPERS
9.7.2.4 CICADAS
9.7.2.5 BLACK SOLDIER FLIES
9.7.2.6 SILKWORMS
9.7.2.7 ANTS
9.7.2.8 BUFFALO WORMS
9.7.2.9 OTHERS
9.8 OTHERS
10 NORTH AMERICA EDIBLE INSECTS MARKET, BY DISTRIBUTION CHANNEL
10.1 OVERVIEW
10.2 DIRECT
10.3 INDIRECT
11 NORTH AMERICA EDIBLE INSECTS MARKET, BY REGION
11.1 NORTH AMERICA
11.1.1 MEXICO
11.1.2 U.S
11.1.3 CANADA
12 NORTH AMERICA EDIBLE INSECTS MARKET: COMPANY LANDSCAPE
12.1 COMPANY SHARE ANALYSIS: NORTH AMERICA
13 SWOT ANALYSIS
14 COMPANY PROFILE
14.1 YNSECT
14.1.1 COMPANY SNAPSHOT
14.1.2 COMPANY SHARE ANALYSIS
14.1.3 PRODUCT PORTFOLIO
14.1.4 RECENT DEVELOPMENTS
14.2 ASPIRE FOOD GROUP
14.2.1 COMPANY SNAPSHOT
14.2.2 COMPANY SHARE ANALYSIS
14.2.3 PRODUCT PORTFOLIO
14.2.4 RECENT DEVELOPMENTS
14.3 XIAMEN WATER LIFE IMP. & EXP. CO., LTD.
14.3.1 COMPANY SNAPSHOT
14.3.2 COMPANY SHARE ANALYSIS
14.3.3 PRODUCT PORTFOLIO
14.3.4 RECENT DEVELOPMENTS
14.4 BETA HATCH
14.4.1 COMPANY SNAPSHOT
14.4.2 COMPANY SHARE ANALYSIS
14.4.3 PRODUCT PORTFOLIO
14.4.4 RECENT DEVELOPMENTS
14.5 FLUCKER’S CRICKET FARM
14.5.1 COMPANY SNAPSHOT
14.5.2 COMPANY SHARE ANALYSIS
14.5.3 PRODUCT PORTFOLIO
14.5.4 RECENT DEVELOPMENTS
14.6 ARMSTRONG CRICKETS GEORGIA
14.6.1 COMPANY SNAPSHOT
14.6.2 PRODUCT PORTFOLIO
14.6.3 RECENT DEVELOPMENTS
14.7 CHAPUL, LLC
14.7.1 COMPANY SNAPSHOT
14.7.2 PRODUCT PORTFOLIO
14.7.3 RECENT DEVELOPMENTS
14.8 ENTOMO FARMS
14.8.1 COMPANY SNAPSHOT
14.8.2 COMPANY SHARE ANALYSIS
14.8.3 PRODUCT PORTFOLIO
14.8.4 RECENT DEVELOPMENTS
14.9 ENVIROFLIGHT
14.9.1 COMPANY SNAPSHOT
14.9.2 COMPANY SHARE ANALYSIS
14.9.3 PRODUCT PORTFOLIO
14.9.4 RECENT DEVELOPMENTS
14.1 INSECTÉO
14.10.1 COMPANY SNAPSHOT
14.10.2 COMPANY SHARE ANALYSIS
14.10.3 PRODUCT PORTFOLIO
14.10.4 RECENT DEVELOPMENTS
14.11 INVERTAPRO AS
14.11.1 COMPANY SNAPSHOT
14.11.2 COMPANY SHARE ANALYSIS
14.11.3 PRODUCT PORTFOLIO
14.11.4 RECENT DEVELOPMENTS
14.12 JIMINI’S
14.12.1 COMPANY SNAPSHOT
14.12.2 PRODUCT PORTFOLIO
14.12.3 RECENT DEVELOPMENTS
14.13 KRECA ENTO FEED BV
14.13.1 COMPANY SNAPSHOT
14.13.2 PRODUCT PORTFOLIO
14.13.3 RECENT DEVELOPMENTS
14.14 SYMTON BLACK SOLDIER FLY.
14.14.1 COMPANY SNAPSHOT
14.14.2 PRODUCT PORTFOLIO
14.14.3 RECENT DEVELOPMENTS
15 QUESTIONNAIRE
16 RELATED REPORTS
List of Table
TABLE 1 NORTH AMERICA EDIBLE INSECTS MARKET, BY INSECT TYPE, 2021-2030 (USD MILLION)
TABLE 2 NORTH AMERICA CRICKETS IN EDIBLE INSECTS MARKET, BY REGION, 2021-2030 (USD MILLION)
TABLE 3 NORTH AMERICA MEALWORM IN EDIBLE INSECTS MARKET, BY REGION, 2021-2030 (USD MILLION)
TABLE 4 NORTH AMERICA GRASSHOPPERS IN EDIBLE INSECTS MARKET, BY REGION, 2021-2030 (USD MILLION)
TABLE 5 NORTH AMERICA CICADAS IN EDIBLE INSECTS MARKET, BY REGION, 2021-2030 (USD MILLION)
TABLE 6 NORTH AMERICA BLACK SOLDIER IN EDIBLE INSECTS MARKET, BY REGION, 2021-2030 (USD MILLION)
TABLE 7 NORTH AMERICA SILKWORMS IN EDIBLE INSECTS MARKET, BY REGION, 2021-2030 (USD MILLION)
TABLE 8 NORTH AMERICA ANTS IN EDIBLE INSECTS MARKET, BY REGION, 2021-2030 (USD MILLION)
TABLE 9 NORTH AMERICA BUFFALO WORMS IN EDIBLE INSECTS MARKET, BY REGION, 2021-2030 (USD MILLION)
TABLE 10 NORTH AMERICA OTHERS IN EDIBLE INSECTS MARKET, BY REGION, 2021-2030 (USD MILLION)
TABLE 11 NORTH AMERICA EDIBLE INSECTS MARKET, BY INSECT CATEGORY, 2021-2030 (USD MILLION)
TABLE 12 NORTH AMERICA REGULAR INSECTS IN EDIBLE INSECTS MARKET, BY REGION, 2021-2030 (USD MILLION)
TABLE 13 NORTH AMERICA PREMIUM DIET FED INSECTS IN EDIBLE INSECTS MARKET, BY REGION, 2021-2030 (USD MILLION)
TABLE 14 NORTH AMERICA EDIBLE INSECTS MARKET, BY APPLICATION, 2021-2030 (USD MILLION)
TABLE 15 NORTH AMERICA HUMAN CONSUMPTION PRODUCTS IN EDIBLE INSECTS MARKET, BY REGION, 2021-2030 (USD MILLION)
TABLE 16 NORTH AMERICA HUMAN CONSUMPTION PRODUCTS IN EDIBLE INSECTS MARKET, BY TYPE, 2021-2030 (USD MILLION)
TABLE 17 NORTH AMERICA INSECT SNACKS IN EDIBLE INSECTS MARKET, BY APPLICATION, 2021-2030 (USD MILLION)
TABLE 18 NORTH AMERICA BEVERAGES IN EDIBLE INSECTS MARKET, BY APPLICATION, 2021-2030 (USD MILLION)
TABLE 19 NORTH AMERICA PROCESSED FOOD IN EDIBLE INSECTS MARKET, BY APPLICATION, 2021-2030 (USD MILLION)
TABLE 20 NORTH AMERICA CONFECTIONERY IN EDIBLE INSECTS MARKET, BY APPLICATION, 2021-2030 (USD MILLION)
TABLE 21 NORTH AMERICA INSECT BAKERY IN EDIBLE INSECTS MARKET, BY APPLICATION, 2021-2030 (USD MILLION)
TABLE 22 NORTH AMERICA HUMAN CONSUMPTION PRODUCTS IN EDIBLE INSECTS MARKET, BY INSECT TYPE, 2021-2030 (USD MILLION)
TABLE 23 NORTH AMERICA ANIMAL NUTRITION IN EDIBLE INSECTS MARKET, BY REGION, 2021-2030 (USD MILLION)
TABLE 24 NORTH AMERICA ANIMAL NUTRITION IN EDIBLE INSECTS MARKET, BY PRODUCT TYPE, 2021-2030 (USD MILLION)
TABLE 25 NORTH AMERICA ANIMAL NUTRITION IN EDIBLE INSECTS MARKET, BY LIVESTOCK TYPE, 2021-2030 (USD MILLION)
TABLE 26 NORTH AMERICA AQUATIC NUTRITION IN EDIBLE INSECTS MARKET, BY TYPE, 2021-2030 (USD MILLION)
TABLE 27 NORTH AMERICA SWINE NUTRITION IN EDIBLE INSECTS MARKET, BY TYPE, 2021-2030 (USD MILLION)
TABLE 28 NORTH AMERICA POULTRY NUTRITION IN EDIBLE INSECTS MARKET, BY TYPE, 2021-2030 (USD MILLION)
TABLE 29 NORTH AMERICA RUMINANT NUTRITION IN EDIBLE INSECTS MARKET, BY TYPE, 2021-2030 (USD MILLION)
TABLE 30 NORTH AMERICA ANIMAL NUTRITION IN EDIBLE INSECTS MARKET, BY INSECT TYPE, 2021-2030 (USD MILLION)
TABLE 31 NORTH AMERICA INSECT OIL IN EDIBLE INSECTS MARKET, BY REGION, 2021-2030 (USD MILLION)
TABLE 32 NORTH AMERICA INSECT OIL IN EDIBLE INSECTS MARKET, BY INSECT TYPE, 2021-2030 (USD MILLION)
TABLE 33 NORTH AMERICA PHARMACEUTICAL IN EDIBLE INSECTS MARKET, BY REGION, 2021-2030 (USD MILLION)
TABLE 34 NORTH AMERICA PHARMACEUTICAL IN EDIBLE INSECTS MARKET, BY INSECT TYPE, 2021-2030 (USD MILLION)
TABLE 35 NORTH AMERICA COSMETICS IN EDIBLE INSECTS MARKET, BY REGION, 2021-2030 (USD MILLION)
TABLE 36 NORTH AMERICA COSMETICS IN EDIBLE INSECTS MARKET, BY INSECT TYPE, 2021-2030 (USD MILLION)
TABLE 37 NORTH AMERICA PERSONAL CARE IN EDIBLE INSECTS MARKET, BY REGION, 2021-2030 (USD MILLION)
TABLE 38 NORTH AMERICA PERSONAL CARE IN EDIBLE INSECTS MARKET, BY TYPE, 2021-2030 (USD MILLION)
TABLE 39 NORTH AMERICA PERSONAL CARE IN EDIBLE INSECTS MARKET, BY INSECT TYPE, 2021-2030 (USD MILLION)
TABLE 40 NORTH AMERICA OTHERS IN EDIBLE INSECTS MARKET, BY REGION, 2021-2030 (USD MILLION)
TABLE 41 NORTH AMERICA EDIBLE INSECTS MARKET, BY DISTRIBUTION CHANNEL, 2021-2030 (USD MILLION)
TABLE 42 NORTH AMERICA DIRECT IN EDIBLE INSECTS MARKET, BY REGION, 2021-2030 (USD MILLION)
TABLE 43 NORTH AMERICA INDIRECT IN EDIBLE INSECTS MARKET, BY REGION, 2021-2030 (USD MILLION)
TABLE 44 NORTH AMERICA EDIBLE INSECTS MARKET, BY COUNTRY, 2021-2030 (USD MILLION)
TABLE 45 NORTH AMERICA EDIBLE INSECTS MARKET, BY INSECT TYPE, 2021-2030 (USD MILLION)
TABLE 46 NORTH AMERICA EDIBLE INSECTS MARKET, BY INSECT TYPE, 2021-2030 (UNIT)
TABLE 47 NORTH AMERICA EDIBLE INSECTS MARKET, BY INSECT TYPE, 2021-2030 (ASP)
TABLE 48 NORTH AMERICA EDIBLE INSECTS MARKET, BY INSECT CATEGORY, 2021-2030 (USD MILLION)
TABLE 49 NORTH AMERICA EDIBLE INSECTS MARKET, BY INSECT CATEGORY, 2021-2030 (UNIT)
TABLE 50 NORTH AMERICA EDIBLE INSECTS MARKET, BY INSECT CATEGORY, 2021-2030 (ASP)
TABLE 51 NORTH AMERICA EDIBLE INSECTS MARKET, BY APPLICATION, 2021-2030 (USD MILLION)
TABLE 52 NORTH AMERICA EDIBLE INSECTS MARKET, BY APPLICATION, 2021-2030 (UNIT)
TABLE 53 NORTH AMERICA EDIBLE INSECTS MARKET, BY APPLICATION, 2021-2030 (ASP)
TABLE 54 NORTH AMERICA HUMAN CONSUMPTION PRODUCTS IN EDIBLE INSECTS MARKET, BY TYPE, 2021-2030 (USD MILLION)
TABLE 55 NORTH AMERICA HUMAN CONSUMPTION PRODUCTS IN EDIBLE INSECTS MARKET, BY TYPE, 2021-2030 (UNIT)
TABLE 56 NORTH AMERICA HUMAN CONSUMPTION PRODUCTS IN EDIBLE INSECTS MARKET, BY TYPE, 2021-2030 (ASP)
TABLE 57 NORTH AMERICA INSECT SNACKS IN EDIBLE INSECTS MARKET, BY APPLICATION, 2021-2030 (USD MILLION)
TABLE 58 NORTH AMERICA INSECT SNACKS IN EDIBLE INSECTS MARKET, BY APPLICATION, 2021-2030 (UNIT)
TABLE 59 NORTH AMERICA INSECT SNACKS IN EDIBLE INSECTS MARKET, BY APPLICATION, 2021-2030 (ASP)
TABLE 60 NORTH AMERICA BEVERAGES IN EDIBLE INSECTS MARKET, BY APPLICATION, 2021-2030 (USD MILLION)
TABLE 61 NORTH AMERICA BEVERAGES IN EDIBLE INSECTS MARKET, BY APPLICATION, 2021-2030 (UNIT)
TABLE 62 NORTH AMERICA BEVERAGES IN EDIBLE INSECTS MARKET, BY APPLICATION, 2021-2030 (ASP)
TABLE 63 NORTH AMERICA PROCESSED FOOD IN EDIBLE INSECTS MARKET, BY APPLICATION, 2021-2030 (USD MILLION)
TABLE 64 NORTH AMERICA PROCESSED FOOD IN EDIBLE INSECTS MARKET, BY APPLICATION, 2021-2030 (UNIT)
TABLE 65 NORTH AMERICA PROCESSED FOOD IN EDIBLE INSECTS MARKET, BY APPLICATION, 2021-2030 (ASP)
TABLE 66 NORTH AMERICA CONFECTIONERY IN EDIBLE INSECTS MARKET, BY APPLICATION, 2021-2030 (USD MILLION)
TABLE 67 NORTH AMERICA CONFECTIONERY IN EDIBLE INSECTS MARKET, BY APPLICATION, 2021-2030 (UNIT)
TABLE 68 NORTH AMERICA CONFECTIONERY IN EDIBLE INSECTS MARKET, BY APPLICATION, 2021-2030 (ASP)
TABLE 69 NORTH AMERICA INSECT BAKERY IN EDIBLE INSECTS MARKET, BY APPLICATION, 2021-2030 (USD MILLION)
TABLE 70 NORTH AMERICA INSECT BAKERY IN EDIBLE INSECTS MARKET, BY APPLICATION, 2021-2030 (UNIT)
TABLE 71 NORTH AMERICA INSECT BAKERY IN EDIBLE INSECTS MARKET, BY APPLICATION, 2021-2030 (ASP)
TABLE 72 NORTH AMERICA HUMAN CONSUMPTION PRODUCTS IN EDIBLE INSECTS MARKET, BY INSECT TYPE, 2021-2030 (USD MILLION)
TABLE 73 NORTH AMERICA ANIMAL NUTRITION IN EDIBLE INSECTS MARKET, BY PRODUCT TYPE, 2021-2030 (USD MILLION)
TABLE 74 NORTH AMERICA ANIMAL NUTRITION IN EDIBLE INSECTS MARKET, BY PRODUCT TYPE, 2021-2030 (UNIT)
TABLE 75 NORTH AMERICA ANIMAL NUTRITION IN EDIBLE INSECTS MARKET, BY PRODUCT TYPE, 2021-2030 (ASP)
TABLE 76 NORTH AMERICA ANIMAL NUTRITION IN EDIBLE INSECTS MARKET, BY LIVESTOCK TYPE, 2021-2030 (USD MILLION)
TABLE 77 NORTH AMERICA ANIMAL NUTRITION IN EDIBLE INSECTS MARKET, BY LIVESTOCK TYPE, 2021-2030 (UNIT)
TABLE 78 NORTH AMERICA ANIMAL NUTRITION IN EDIBLE INSECTS MARKET, BY LIVESTOCK TYPE, 2021-2030 (ASP)
TABLE 79 NORTH AMERICA AQUATIC NUTRITION IN EDIBLE INSECTS MARKET, BY TYPE, 2021-2030 (USD MILLION)
TABLE 80 NORTH AMERICA AQUATIC NUTRITION IN EDIBLE INSECTS MARKET, BY TYPE, 2021-2030 (UNIT)
TABLE 81 NORTH AMERICA AQUATIC NUTRITION IN EDIBLE INSECTS MARKET, BY TYPE, 2021-2030 (ASP)
TABLE 82 NORTH AMERICA SWINE NUTRITION IN EDIBLE INSECTS MARKET, BY TYPE, 2021-2030 (USD MILLION)
TABLE 83 NORTH AMERICA SWINE NUTRITION IN EDIBLE INSECTS MARKET, BY TYPE, 2021-2030 (UNIT)
TABLE 84 NORTH AMERICA SWINE NUTRITION IN EDIBLE INSECTS MARKET, BY TYPE, 2021-2030 (ASP)
TABLE 85 NORTH AMERICA POULTRY NUTRITION IN EDIBLE INSECTS MARKET, BY TYPE, 2021-2030 (USD MILLION)
TABLE 86 NORTH AMERICA POULTRY NUTRITION IN EDIBLE INSECTS MARKET, BY TYPE, 2021-2030 (UNIT)
TABLE 87 NORTH AMERICA POULTRY NUTRITION IN EDIBLE INSECTS MARKET, BY TYPE, 2021-2030 (ASP)
TABLE 88 NORTH AMERICA RUMINANT NUTRITION IN EDIBLE INSECTS MARKET, BY TYPE, 2021-2030 (USD MILLION)
TABLE 89 NORTH AMERICA RUMINANT NUTRITION IN EDIBLE INSECTS MARKET, BY TYPE, 2021-2030 (UNIT)
TABLE 90 NORTH AMERICA RUMINANT NUTRITION IN EDIBLE INSECTS MARKET, BY TYPE, 2021-2030 (ASP)
TABLE 91 NORTH AMERICA ANIMAL NUTRITION IN EDIBLE INSECTS MARKET, BY INSECT TYPE, 2021-2030 (USD MILLION)
TABLE 92 NORTH AMERICA INSECT OIL IN EDIBLE INSECTS MARKET, BY INSECT TYPE, 2021-2030 (USD MILLION)
TABLE 93 NORTH AMERICA PHARMACEUTICAL IN EDIBLE INSECTS MARKET, BY INSECT TYPE, 2021-2030 (USD MILLION)
TABLE 94 NORTH AMERICA COSMETICS IN EDIBLE INSECTS MARKET, BY INSECT TYPE, 2021-2030 (USD MILLION)
TABLE 95 NORTH AMERICA PERSONAL CARE IN EDIBLE INSECTS MARKET, BY TYPE, 2021-2030 (USD MILLION)
TABLE 96 NORTH AMERICA PERSONAL CARE IN EDIBLE INSECTS MARKET, BY TYPE, 2021-2030 (UNIT)
TABLE 97 NORTH AMERICA PERSONAL CARE IN EDIBLE INSECTS MARKET, BY TYPE, 2021-2030 (ASP)
TABLE 98 NORTH AMERICA PERSONAL CARE IN EDIBLE INSECTS MARKET, BY INSECT TYPE, 2021-2030 (USD MILLION)
TABLE 99 NORTH AMERICA EDIBLE INSECTS MARKET, BY DISTRIBUTION CHANNEL, 2021-2030 (USD MILLION)
TABLE 100 MEXICO EDIBLE INSECTS MARKET, BY INSECT TYPE, 2021-2030 (USD MILLION)
TABLE 101 MEXICO EDIBLE INSECTS MARKET, BY INSECT TYPE, 2021-2030 (UNIT)
TABLE 102 MEXICO EDIBLE INSECTS MARKET, BY INSECT TYPE, 2021-2030 (ASP)
TABLE 103 MEXICO EDIBLE INSECTS MARKET, BY INSECT CATEGORY, 2021-2030 (USD MILLION)
TABLE 104 MEXICO EDIBLE INSECTS MARKET, BY INSECT CATEGORY, 2021-2030 (UNIT)
TABLE 105 MEXICO EDIBLE INSECTS MARKET, BY INSECT CATEGORY, 2021-2030 (ASP)
TABLE 106 MEXICO EDIBLE INSECTS MARKET, BY APPLICATION, 2021-2030 (USD MILLION)
TABLE 107 MEXICO EDIBLE INSECTS MARKET, BY APPLICATION, 2021-2030 (UNIT)
TABLE 108 MEXICO EDIBLE INSECTS MARKET, BY APPLICATION, 2021-2030 (ASP)
TABLE 109 MEXICO HUMAN CONSUMPTION PRODUCTS IN EDIBLE INSECTS MARKET, BY TYPE, 2021-2030 (USD MILLION)
TABLE 110 MEXICO HUMAN CONSUMPTION PRODUCTS IN EDIBLE INSECTS MARKET, BY TYPE, 2021-2030 (UNIT)
TABLE 111 MEXICO HUMAN CONSUMPTION PRODUCTS IN EDIBLE INSECTS MARKET, BY TYPE, 2021-2030 (ASP)
TABLE 112 MEXICO INSECT SNACKS IN EDIBLE INSECTS MARKET, BY APPLICATION, 2021-2030 (USD MILLION)
TABLE 113 MEXICO INSECT SNACKS IN EDIBLE INSECTS MARKET, BY APPLICATION, 2021-2030 (UNIT)
TABLE 114 MEXICO INSECT SNACKS IN EDIBLE INSECTS MARKET, BY APPLICATION, 2021-2030 (ASP)
TABLE 115 MEXICO BEVERAGES IN EDIBLE INSECTS MARKET, BY APPLICATION, 2021-2030 (USD MILLION)
TABLE 116 MEXICO BEVERAGES IN EDIBLE INSECTS MARKET, BY APPLICATION, 2021-2030 (UNIT)
TABLE 117 MEXICO BEVERAGES IN EDIBLE INSECTS MARKET, BY APPLICATION, 2021-2030 (ASP)
TABLE 118 MEXICO PROCESSED FOOD IN EDIBLE INSECTS MARKET, BY APPLICATION, 2021-2030 (USD MILLION)
TABLE 119 MEXICO PROCESSED FOOD IN EDIBLE INSECTS MARKET, BY APPLICATION, 2021-2030 (UNIT)
TABLE 120 MEXICO PROCESSED FOOD IN EDIBLE INSECTS MARKET, BY APPLICATION, 2021-2030 (ASP)
TABLE 121 MEXICO CONFECTIONERY IN EDIBLE INSECTS MARKET, BY APPLICATION, 2021-2030 (USD MILLION)
TABLE 122 MEXICO CONFECTIONERY IN EDIBLE INSECTS MARKET, BY APPLICATION, 2021-2030 (UNIT)
TABLE 123 MEXICO CONFECTIONERY IN EDIBLE INSECTS MARKET, BY APPLICATION, 2021-2030 (ASP)
TABLE 124 MEXICO INSECT BAKERY IN EDIBLE INSECTS MARKET, BY APPLICATION, 2021-2030 (USD MILLION)
TABLE 125 MEXICO INSECT BAKERY IN EDIBLE INSECTS MARKET, BY APPLICATION, 2021-2030 (UNIT)
TABLE 126 MEXICO INSECT BAKERY IN EDIBLE INSECTS MARKET, BY APPLICATION, 2021-2030 (ASP)
TABLE 127 MEXICO HUMAN CONSUMPTION PRODUCTS IN EDIBLE INSECTS MARKET, BY INSECT TYPE, 2021-2030 (USD MILLION)
TABLE 128 MEXICO ANIMAL NUTRITION IN EDIBLE INSECTS MARKET, BY PRODUCT TYPE, 2021-2030 (USD MILLION)
TABLE 129 MEXICO ANIMAL NUTRITION IN EDIBLE INSECTS MARKET, BY PRODUCT TYPE, 2021-2030 (UNIT)
TABLE 130 MEXICO ANIMAL NUTRITION IN EDIBLE INSECTS MARKET, BY PRODUCT TYPE, 2021-2030 (ASP)
TABLE 131 MEXICO ANIMAL NUTRITION IN EDIBLE INSECTS MARKET, BY LIVESTOCK TYPE, 2021-2030 (USD MILLION)
TABLE 132 MEXICO ANIMAL NUTRITION IN EDIBLE INSECTS MARKET, BY LIVESTOCK TYPE, 2021-2030 (UNIT)
TABLE 133 MEXICO ANIMAL NUTRITION IN EDIBLE INSECTS MARKET, BY LIVESTOCK TYPE, 2021-2030 (ASP)
TABLE 134 MEXICO AQUATIC NUTRITION IN EDIBLE INSECTS MARKET, BY TYPE, 2021-2030 (USD MILLION)
TABLE 135 MEXICO AQUATIC NUTRITION IN EDIBLE INSECTS MARKET, BY TYPE, 2021-2030 (UNIT)
TABLE 136 MEXICO AQUATIC NUTRITION IN EDIBLE INSECTS MARKET, BY TYPE, 2021-2030 (ASP)
TABLE 137 MEXICO SWINE NUTRITION IN EDIBLE INSECTS MARKET, BY TYPE, 2021-2030 (USD MILLION)
TABLE 138 MEXICO SWINE NUTRITION IN EDIBLE INSECTS MARKET, BY TYPE, 2021-2030 (UNIT)
TABLE 139 MEXICO SWINE NUTRITION IN EDIBLE INSECTS MARKET, BY TYPE, 2021-2030 (ASP)
TABLE 140 MEXICO POULTRY NUTRITION IN EDIBLE INSECTS MARKET, BY TYPE, 2021-2030 (USD MILLION)
TABLE 141 MEXICO POULTRY NUTRITION IN EDIBLE INSECTS MARKET, BY TYPE, 2021-2030 (UNIT)
TABLE 142 MEXICO POULTRY NUTRITION IN EDIBLE INSECTS MARKET, BY TYPE, 2021-2030 (ASP)
TABLE 143 MEXICO RUMINANT NUTRITION IN EDIBLE INSECTS MARKET, BY TYPE, 2021-2030 (USD MILLION)
TABLE 144 MEXICO RUMINANT NUTRITION IN EDIBLE INSECTS MARKET, BY TYPE, 2021-2030 (UNIT)
TABLE 145 MEXICO RUMINANT NUTRITION IN EDIBLE INSECTS MARKET, BY TYPE, 2021-2030 (ASP)
TABLE 146 MEXICO ANIMAL NUTRITION IN EDIBLE INSECTS MARKET, BY INSECT TYPE, 2021-2030 (USD MILLION)
TABLE 147 MEXICO INSECT OIL IN EDIBLE INSECTS MARKET, BY INSECT TYPE, 2021-2030 (USD MILLION)
TABLE 148 MEXICO PHARMACEUTICAL IN EDIBLE INSECTS MARKET, BY INSECT TYPE, 2021-2030 (USD MILLION)
TABLE 149 MEXICO COSMETICS IN EDIBLE INSECTS MARKET, BY INSECT TYPE, 2021-2030 (USD MILLION)
TABLE 150 MEXICO PERSONAL CARE IN EDIBLE INSECTS MARKET, BY TYPE, 2021-2030 (USD MILLION)
TABLE 151 MEXICO PERSONAL CARE IN EDIBLE INSECTS MARKET, BY TYPE, 2021-2030 (UNIT)
TABLE 152 MEXICO PERSONAL CARE IN EDIBLE INSECTS MARKET, BY TYPE, 2021-2030 (ASP)
TABLE 153 MEXICO PERSONAL CARE IN EDIBLE INSECTS MARKET, BY INSECT TYPE, 2021-2030 (USD MILLION)
TABLE 154 MEXICO EDIBLE INSECTS MARKET, BY DISTRIBUTION CHANNEL, 2021-2030 (USD MILLION)
TABLE 155 U.S. EDIBLE INSECTS MARKET, BY INSECT TYPE, 2021-2030 (USD MILLION)
TABLE 156 U.S. EDIBLE INSECTS MARKET, BY INSECT TYPE, 2021-2030 (UNIT)
TABLE 157 U.S. EDIBLE INSECTS MARKET, BY INSECT TYPE, 2021-2030 (ASP)
TABLE 158 U.S. EDIBLE INSECTS MARKET, BY INSECT CATEGORY, 2021-2030 (USD MILLION)
TABLE 159 U.S. EDIBLE INSECTS MARKET, BY INSECT CATEGORY, 2021-2030 (UNIT)
TABLE 160 U.S. EDIBLE INSECTS MARKET, BY INSECT CATEGORY, 2021-2030 (ASP)
TABLE 161 U.S. EDIBLE INSECTS MARKET, BY APPLICATION, 2021-2030 (USD MILLION)
TABLE 162 U.S. EDIBLE INSECTS MARKET, BY APPLICATION, 2021-2030 (UNIT)
TABLE 163 U.S. EDIBLE INSECTS MARKET, BY APPLICATION, 2021-2030 (ASP)
TABLE 164 U.S. HUMAN CONSUMPTION PRODUCTS IN EDIBLE INSECTS MARKET, BY TYPE, 2021-2030 (USD MILLION)
TABLE 165 U.S. HUMAN CONSUMPTION PRODUCTS IN EDIBLE INSECTS MARKET, BY TYPE, 2021-2030 (UNIT)
TABLE 166 U.S. HUMAN CONSUMPTION PRODUCTS IN EDIBLE INSECTS MARKET, BY TYPE, 2021-2030 (ASP)
TABLE 167 U.S. INSECT SNACKS IN EDIBLE INSECTS MARKET, BY APPLICATION, 2021-2030 (USD MILLION)
TABLE 168 U.S. INSECT SNACKS IN EDIBLE INSECTS MARKET, BY APPLICATION, 2021-2030 (UNIT)
TABLE 169 U.S. INSECT SNACKS IN EDIBLE INSECTS MARKET, BY APPLICATION, 2021-2030 (ASP)
TABLE 170 U.S. BEVERAGES IN EDIBLE INSECTS MARKET, BY APPLICATION, 2021-2030 (USD MILLION)
TABLE 171 U.S. BEVERAGES IN EDIBLE INSECTS MARKET, BY APPLICATION, 2021-2030 (UNIT)
TABLE 172 U.S. BEVERAGES IN EDIBLE INSECTS MARKET, BY APPLICATION, 2021-2030 (ASP)
TABLE 173 U.S. PROCESSED FOOD IN EDIBLE INSECTS MARKET, BY APPLICATION, 2021-2030 (USD MILLION)
TABLE 174 U.S. PROCESSED FOOD IN EDIBLE INSECTS MARKET, BY APPLICATION, 2021-2030 (UNIT)
TABLE 175 U.S. PROCESSED FOOD IN EDIBLE INSECTS MARKET, BY APPLICATION, 2021-2030 (ASP)
TABLE 176 U.S. CONFECTIONERY IN EDIBLE INSECTS MARKET, BY APPLICATION, 2021-2030 (USD MILLION)
TABLE 177 U.S. CONFECTIONERY IN EDIBLE INSECTS MARKET, BY APPLICATION, 2021-2030 (UNIT)
TABLE 178 U.S. CONFECTIONERY IN EDIBLE INSECTS MARKET, BY APPLICATION, 2021-2030 (ASP)
TABLE 179 U.S. INSECT BAKERY IN EDIBLE INSECTS MARKET, BY APPLICATION, 2021-2030 (USD MILLION)
TABLE 180 U.S. INSECT BAKERY IN EDIBLE INSECTS MARKET, BY APPLICATION, 2021-2030 (UNIT)
TABLE 181 U.S. INSECT BAKERY IN EDIBLE INSECTS MARKET, BY APPLICATION, 2021-2030 (ASP)
TABLE 182 U.S. HUMAN CONSUMPTION PRODUCTS IN EDIBLE INSECTS MARKET, BY INSECT TYPE, 2021-2030 (USD MILLION)
TABLE 183 U.S. ANIMAL NUTRITION IN EDIBLE INSECTS MARKET, BY PRODUCT TYPE, 2021-2030 (USD MILLION)
TABLE 184 U.S. ANIMAL NUTRITION IN EDIBLE INSECTS MARKET, BY PRODUCT TYPE, 2021-2030 (UNIT)
TABLE 185 U.S. ANIMAL NUTRITION IN EDIBLE INSECTS MARKET, BY PRODUCT TYPE, 2021-2030 (ASP)
TABLE 186 U.S. ANIMAL NUTRITION IN EDIBLE INSECTS MARKET, BY LIVESTOCK TYPE, 2021-2030 (USD MILLION)
TABLE 187 U.S. ANIMAL NUTRITION IN EDIBLE INSECTS MARKET, BY LIVESTOCK TYPE, 2021-2030 (UNIT)
TABLE 188 U.S. ANIMAL NUTRITION IN EDIBLE INSECTS MARKET, BY LIVESTOCK TYPE, 2021-2030 (ASP)
TABLE 189 U.S. AQUATIC NUTRITION IN EDIBLE INSECTS MARKET, BY TYPE, 2021-2030 (USD MILLION)
TABLE 190 U.S. AQUATIC NUTRITION IN EDIBLE INSECTS MARKET, BY TYPE, 2021-2030 (UNIT)
TABLE 191 U.S. AQUATIC NUTRITION IN EDIBLE INSECTS MARKET, BY TYPE, 2021-2030 (ASP)
TABLE 192 U.S. SWINE NUTRITION IN EDIBLE INSECTS MARKET, BY TYPE, 2021-2030 (USD MILLION)
TABLE 193 U.S. SWINE NUTRITION IN EDIBLE INSECTS MARKET, BY TYPE, 2021-2030 (UNIT)
TABLE 194 U.S. SWINE NUTRITION IN EDIBLE INSECTS MARKET, BY TYPE, 2021-2030 (ASP)
TABLE 195 U.S. POULTRY NUTRITION IN EDIBLE INSECTS MARKET, BY TYPE, 2021-2030 (USD MILLION)
TABLE 196 U.S. POULTRY NUTRITION IN EDIBLE INSECTS MARKET, BY TYPE, 2021-2030 (UNIT)
TABLE 197 U.S. POULTRY NUTRITION IN EDIBLE INSECTS MARKET, BY TYPE, 2021-2030 (ASP)
TABLE 198 U.S. RUMINANT NUTRITION IN EDIBLE INSECTS MARKET, BY TYPE, 2021-2030 (USD MILLION)
TABLE 199 U.S. RUMINANT NUTRITION IN EDIBLE INSECTS MARKET, BY TYPE, 2021-2030 (UNIT)
TABLE 200 U.S. RUMINANT NUTRITION IN EDIBLE INSECTS MARKET, BY TYPE, 2021-2030 (ASP)
TABLE 201 U.S. ANIMAL NUTRITION IN EDIBLE INSECTS MARKET, BY INSECT TYPE, 2021-2030 (USD MILLION)
TABLE 202 U.S. INSECT OIL IN EDIBLE INSECTS MARKET, BY INSECT TYPE, 2021-2030 (USD MILLION)
TABLE 203 U.S. PHARMACEUTICAL IN EDIBLE INSECTS MARKET, BY INSECT TYPE, 2021-2030 (USD MILLION)
TABLE 204 U.S. COSMETICS IN EDIBLE INSECTS MARKET, BY INSECT TYPE, 2021-2030 (USD MILLION)
TABLE 205 U.S. PERSONAL CARE IN EDIBLE INSECTS MARKET, BY TYPE, 2021-2030 (USD MILLION)
TABLE 206 U.S. PERSONAL CARE IN EDIBLE INSECTS MARKET, BY TYPE, 2021-2030 (UNIT)
TABLE 207 U.S. PERSONAL CARE IN EDIBLE INSECTS MARKET, BY TYPE, 2021-2030 (ASP)
TABLE 208 U.S. PERSONAL CARE IN EDIBLE INSECTS MARKET, BY INSECT TYPE, 2021-2030 (USD MILLION)
TABLE 209 U.S. EDIBLE INSECTS MARKET, BY DISTRIBUTION CHANNEL, 2021-2030 (USD MILLION)
TABLE 210 CANADA EDIBLE INSECTS MARKET, BY INSECT TYPE, 2021-2030 (USD MILLION)
TABLE 211 CANADA EDIBLE INSECTS MARKET, BY INSECT TYPE, 2021-2030 (UNIT)
TABLE 212 CANADA EDIBLE INSECTS MARKET, BY INSECT TYPE, 2021-2030 (ASP)
TABLE 213 CANADA EDIBLE INSECTS MARKET, BY INSECT CATEGORY, 2021-2030 (USD MILLION)
TABLE 214 CANADA EDIBLE INSECTS MARKET, BY INSECT CATEGORY, 2021-2030 (UNIT)
TABLE 215 CANADA EDIBLE INSECTS MARKET, BY INSECT CATEGORY, 2021-2030 (ASP)
TABLE 216 CANADA EDIBLE INSECTS MARKET, BY APPLICATION, 2021-2030 (USD MILLION)
TABLE 217 CANADA EDIBLE INSECTS MARKET, BY APPLICATION, 2021-2030 (UNIT)
TABLE 218 CANADA EDIBLE INSECTS MARKET, BY APPLICATION, 2021-2030 (ASP)
TABLE 219 CANADA HUMAN CONSUMPTION PRODUCTS IN EDIBLE INSECTS MARKET, BY TYPE, 2021-2030 (USD MILLION)
TABLE 220 CANADA HUMAN CONSUMPTION PRODUCTS IN EDIBLE INSECTS MARKET, BY TYPE, 2021-2030 (UNIT)
TABLE 221 CANADA HUMAN CONSUMPTION PRODUCTS IN EDIBLE INSECTS MARKET, BY TYPE, 2021-2030 (ASP)
TABLE 222 CANADA INSECT SNACKS IN EDIBLE INSECTS MARKET, BY APPLICATION, 2021-2030 (USD MILLION)
TABLE 223 CANADA INSECT SNACKS IN EDIBLE INSECTS MARKET, BY APPLICATION, 2021-2030 (UNIT)
TABLE 224 CANADA INSECT SNACKS IN EDIBLE INSECTS MARKET, BY APPLICATION, 2021-2030 (ASP)
TABLE 225 CANADA BEVERAGES IN EDIBLE INSECTS MARKET, BY APPLICATION, 2021-2030 (USD MILLION)
TABLE 226 CANADA BEVERAGES IN EDIBLE INSECTS MARKET, BY APPLICATION, 2021-2030 (UNIT)
TABLE 227 CANADA BEVERAGES IN EDIBLE INSECTS MARKET, BY APPLICATION, 2021-2030 (ASP)
TABLE 228 CANADA PROCESSED FOOD IN EDIBLE INSECTS MARKET, BY APPLICATION, 2021-2030 (USD MILLION)
TABLE 229 CANADA PROCESSED FOOD IN EDIBLE INSECTS MARKET, BY APPLICATION, 2021-2030 (UNIT)
TABLE 230 CANADA PROCESSED FOOD IN EDIBLE INSECTS MARKET, BY APPLICATION, 2021-2030 (ASP)
TABLE 231 CANADA CONFECTIONERY IN EDIBLE INSECTS MARKET, BY APPLICATION, 2021-2030 (USD MILLION)
TABLE 232 CANADA CONFECTIONERY IN EDIBLE INSECTS MARKET, BY APPLICATION, 2021-2030 (UNIT)
TABLE 233 CANADA CONFECTIONERY IN EDIBLE INSECTS MARKET, BY APPLICATION, 2021-2030 (ASP)
TABLE 234 CANADA INSECT BAKERY IN EDIBLE INSECTS MARKET, BY APPLICATION, 2021-2030 (USD MILLION)
TABLE 235 CANADA INSECT BAKERY IN EDIBLE INSECTS MARKET, BY APPLICATION, 2021-2030 (UNIT)
TABLE 236 CANADA INSECT BAKERY IN EDIBLE INSECTS MARKET, BY APPLICATION, 2021-2030 (ASP)
TABLE 237 CANADA HUMAN CONSUMPTION PRODUCTS IN EDIBLE INSECTS MARKET, BY INSECT TYPE, 2021-2030 (USD MILLION)
TABLE 238 CANADA ANIMAL NUTRITION IN EDIBLE INSECTS MARKET, BY PRODUCT TYPE, 2021-2030 (USD MILLION)
TABLE 239 CANADA ANIMAL NUTRITION IN EDIBLE INSECTS MARKET, BY PRODUCT TYPE, 2021-2030 (UNIT)
TABLE 240 CANADA ANIMAL NUTRITION IN EDIBLE INSECTS MARKET, BY PRODUCT TYPE, 2021-2030 (ASP)
TABLE 241 CANADA ANIMAL NUTRITION IN EDIBLE INSECTS MARKET, BY LIVESTOCK TYPE, 2021-2030 (USD MILLION)
TABLE 242 CANADA ANIMAL NUTRITION IN EDIBLE INSECTS MARKET, BY LIVESTOCK TYPE, 2021-2030 (UNIT)
TABLE 243 CANADA ANIMAL NUTRITION IN EDIBLE INSECTS MARKET, BY LIVESTOCK TYPE, 2021-2030 (ASP)
TABLE 244 CANADA AQUATIC NUTRITION IN EDIBLE INSECTS MARKET, BY TYPE, 2021-2030 (USD MILLION)
TABLE 245 CANADA AQUATIC NUTRITION IN EDIBLE INSECTS MARKET, BY TYPE, 2021-2030 (UNIT)
TABLE 246 CANADA AQUATIC NUTRITION IN EDIBLE INSECTS MARKET, BY TYPE, 2021-2030 (ASP)
TABLE 247 CANADA SWINE NUTRITION IN EDIBLE INSECTS MARKET, BY TYPE, 2021-2030 (USD MILLION)
TABLE 248 CANADA SWINE NUTRITION IN EDIBLE INSECTS MARKET, BY TYPE, 2021-2030 (UNIT)
TABLE 249 CANADA SWINE NUTRITION IN EDIBLE INSECTS MARKET, BY TYPE, 2021-2030 (ASP)
TABLE 250 CANADA POULTRY NUTRITION IN EDIBLE INSECTS MARKET, BY TYPE, 2021-2030 (USD MILLION)
TABLE 251 CANADA POULTRY NUTRITION IN EDIBLE INSECTS MARKET, BY TYPE, 2021-2030 (UNIT)
TABLE 252 CANADA POULTRY NUTRITION IN EDIBLE INSECTS MARKET, BY TYPE, 2021-2030 (ASP)
TABLE 253 CANADA RUMINANT NUTRITION IN EDIBLE INSECTS MARKET, BY TYPE, 2021-2030 (USD MILLION)
TABLE 254 CANADA RUMINANT NUTRITION IN EDIBLE INSECTS MARKET, BY TYPE, 2021-2030 (UNIT)
TABLE 255 CANADA RUMINANT NUTRITION IN EDIBLE INSECTS MARKET, BY TYPE, 2021-2030 (ASP)
TABLE 256 CANADA ANIMAL NUTRITION IN EDIBLE INSECTS MARKET, BY INSECT TYPE, 2021-2030 (USD MILLION)
TABLE 257 CANADA INSECT OIL IN EDIBLE INSECTS MARKET, BY INSECT TYPE, 2021-2030 (USD MILLION)
TABLE 258 CANADA PHARMACEUTICAL IN EDIBLE INSECTS MARKET, BY INSECT TYPE, 2021-2030 (USD MILLION)
TABLE 259 CANADA COSMETICS IN EDIBLE INSECTS MARKET, BY INSECT TYPE, 2021-2030 (USD MILLION)
TABLE 260 CANADA PERSONAL CARE IN EDIBLE INSECTS MARKET, BY TYPE, 2021-2030 (USD MILLION)
TABLE 261 CANADA PERSONAL CARE IN EDIBLE INSECTS MARKET, BY TYPE, 2021-2030 (UNIT)
TABLE 262 CANADA PERSONAL CARE IN EDIBLE INSECTS MARKET, BY TYPE, 2021-2030 (ASP)
TABLE 263 CANADA PERSONAL CARE IN EDIBLE INSECTS MARKET, BY INSECT TYPE, 2021-2030 (USD MILLION)
TABLE 264 CANADA EDIBLE INSECTS MARKET, BY DISTRIBUTION CHANNEL, 2021-2030 (USD MILLION)
List of Figure
FIGURE 1 NORTH AMERICA EDIBLE INSECTS MARKET: SEGMENTATION
FIGURE 2 NORTH AMERICA EDIBLE INSECTS MARKET: DATA TRIANGULATION
FIGURE 3 NORTH AMERICA EDIBLE INSECTS MARKET: DROC ANALYSIS
FIGURE 4 NORTH AMERICA EDIBLE INSECTS MARKET: NORTH AMERICA VS REGIONAL MARKET ANALYSIS
FIGURE 5 NORTH AMERICA EDIBLE INSECTS MARKET: COMPANY RESEARCH ANALYSIS
FIGURE 6 NORTH AMERICA EDIBLE INSECTS MARKET: INTERVIEW DEMOGRAPHICS
FIGURE 7 NORTH AMERICA EDIBLE INSECTS MARKET: DBMR POSITION GRID
FIGURE 8 NORTH AMERICA EDIBLE INSECTS MARKET: VENDOR SHARE ANALYSIS
FIGURE 9 NORTH AMERICA EDIBLE INSECTS MARKET: APPLICATION COVERAGE GRID
FIGURE 10 NORTH AMERICA EDIBLE INSECTS MARKET: SEGMENTATION
FIGURE 11 RISING INCLINATION TOWARDS THE CONSUMPTION OF PROTEIN-RICH FOOD COUPLED WITH CHANGING EATING HABITS OF MANY INDIVIDUALS IS EXPECTED TO DRIVE THE NORTH AMERICA EDIBLE INSECTS MARKET GROWTH IN THE FORECAST PERIOD OF 2023 TO 2030
FIGURE 12 CRICKETS IS EXPECTED TO HAVE THE LARGEST SHARE OF THE NORTH AMERICA EDIBLE INSECTS MARKET IN THE FORECAST PERIOD 2023 & 2030
FIGURE 13 DRIVERS, RESTRAINTS, OPPORTUNITIES, AND CHALLENGES OF THE NORTH AMERICA EDIBLE INSECTS MARKET
FIGURE 14 NORTH AMERICA EDIBLE INSECTS MARKET: BY INSECT TYPE, 2022
FIGURE 15 NORTH AMERICA EDIBLE INSECTS MARKET: BY INSECT TYPE, 2023-2030 (USD MILLION)
FIGURE 16 NORTH AMERICA EDIBLE INSECTS MARKET: BY INSECT TYPE, CAGR (2023-2030)
FIGURE 17 NORTH AMERICA EDIBLE INSECTS MARKET: BY INSECT TYPE, LIFELINE CURVE
FIGURE 18 NORTH AMERICA EDIBLE INSECTS MARKET: BY INSECT CATEGORY, 2022
FIGURE 19 NORTH AMERICA EDIBLE INSECTS MARKET: BY INSECT CATEGORY, 2023-2030 (USD MILLION)
FIGURE 20 NORTH AMERICA EDIBLE INSECTS MARKET: BY INSECT CATEGORY, CAGR (2023-2030)
FIGURE 21 NORTH AMERICA EDIBLE INSECTS MARKET: BY INSECT CATEGORY, LIFELINE CURVE
FIGURE 22 NORTH AMERICA EDIBLE INSECTS MARKET: BY APPLICATION, 2022
FIGURE 23 NORTH AMERICA EDIBLE INSECTS MARKET: BY APPLICATION, 2023-2030 (USD MILLION)
FIGURE 24 NORTH AMERICA EDIBLE INSECTS MARKET: BY APPLICATION, CAGR (2023-2030)
FIGURE 25 NORTH AMERICA EDIBLE INSECTS MARKET: BY APPLICATION, LIFELINE CURVE
FIGURE 26 NORTH AMERICA EDIBLE INSECTS MARKET: BY DISTRIBUTION CHANNEL, 2022
FIGURE 27 NORTH AMERICA EDIBLE INSECTS MARKET: BY DISTRIBUTION CHANNEL, 2023-2030 (USD MILLION)
FIGURE 28 NORTH AMERICA EDIBLE INSECTS MARKET: BY DISTRIBUTION CHANNEL, CAGR (2023-2030)
FIGURE 29 NORTH AMERICA EDIBLE INSECTS MARKET: BY DISTRIBUTION CHANNEL, LIFELINE CURVE
FIGURE 30 NORTH AMERICA EDIBLE INSECTS MARKET: SNAPSHOT (2022)
FIGURE 31 NORTH AMERICA EDIBLE INSECTS MARKET: BY COUNTRY (2022)
FIGURE 32 NORTH AMERICA EDIBLE INSECTS MARKET: BY COUNTRY (2023 & 2030)
FIGURE 33 NORTH AMERICA EDIBLE INSECTS MARKET: BY COUNTRY (2022 & 2030)
FIGURE 34 NORTH AMERICA EDIBLE INSECTS MARKET: INSECT TYPE (2023-2030)
FIGURE 35 NORTH AMERICA EDIBLE INSECTS MARKET: COMPANY SHARE 2022 (%)
North America Edible Insects Market, Supply Chain Analysis and Ecosystem Framework
To support market growth and help clients navigate the impact of geopolitical shifts, DBMR has integrated in-depth supply chain analysis into its North America Edible Insects Market research reports. This addition empowers clients to respond effectively to global changes affecting their industries. The supply chain analysis section includes detailed insights such as North America Edible Insects Market consumption and production by country, price trend analysis, the impact of tariffs and geopolitical developments, and import and export trends by country and HSN code. It also highlights major suppliers with data on production capacity and company profiles, as well as key importers and exporters. In addition to research, DBMR offers specialized supply chain consulting services backed by over a decade of experience, providing solutions like supplier discovery, supplier risk assessment, price trend analysis, impact evaluation of inflation and trade route changes, and comprehensive market trend analysis.
Data collection and base year analysis are done using data collection modules with large sample sizes. The stage includes obtaining market information or related data through various sources and strategies. It includes examining and planning all the data acquired from the past in advance. It likewise envelops the examination of information inconsistencies seen across different information sources. The market data is analysed and estimated using market statistical and coherent models. Also, market share analysis and key trend analysis are the major success factors in the market report. To know more, please request an analyst call or drop down your inquiry.
The key research methodology used by DBMR research team is data triangulation which involves data mining, analysis of the impact of data variables on the market and primary (industry expert) validation. Data models include Vendor Positioning Grid, Market Time Line Analysis, Market Overview and Guide, Company Positioning Grid, Patent Analysis, Pricing Analysis, Company Market Share Analysis, Standards of Measurement, Global versus Regional and Vendor Share Analysis. To know more about the research methodology, drop in an inquiry to speak to our industry experts.
Data Bridge Market Research is a leader in advanced formative research. We take pride in servicing our existing and new customers with data and analysis that match and suits their goal. The report can be customized to include price trend analysis of target brands understanding the market for additional countries (ask for the list of countries), clinical trial results data, literature review, refurbished market and product base analysis. Market analysis of target competitors can be analyzed from technology-based analysis to market portfolio strategies. We can add as many competitors that you require data about in the format and data style you are looking for. Our team of analysts can also provide you data in crude raw excel files pivot tables (Fact book) or can assist you in creating presentations from the data sets available in the report.


