
North America Flow Cytometry Market
Market Size in USD Billion
 USD
3.40 Billion
USD
7.77 Billion
2024
2032
USD
3.40 Billion
USD
7.77 Billion
2024
2032
| 2025 - 2032 | |
| USD 3.40 Billion | |
| USD 7.77 Billion | |
| % | |
|
North America Flow Cytometry Market Analysis
Flow cytometry is a technique for detecting and quantifying the physical and chemical properties of a population of cells or particles. A sample containing cells or particles is suspended in a fluid and injected into the flow cytometer equipment in this process. Flow cytometry is a well-established technology for identifying cells in a solution that is most typically used to assess peripheral blood, bone marrow, and other bodily fluids. Immune cells are identified and quantified using flow cytometry, which is also used to describe hematological malignancies. The evaluation of cells through this technique has a key role in diagnosing many chronic diseases. It analyzes biological activities inside cells, apoptosis, necrosis, cell cycle, cell membrane, cell proliferation, and measurement of DNA per cell.
The major diagnostic applications include benign hematologic process, cancer, AIDS, immune deficiency, benign hematologic, and these diseases' detection using fluorescence. In this process, cells are dyed with fluorophores to detect the light emitted to produce the intensity by labeling specific proteins (immunophenotyping) for diagnosing leukemia and lymphomas.
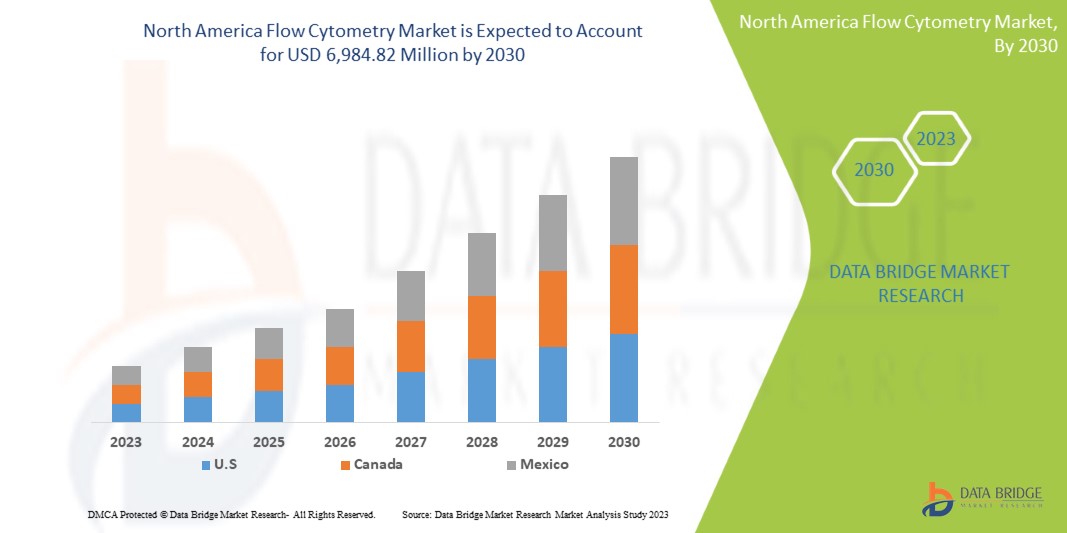
North America Flow Cytometry Market Size
North America flow cytometry market size was valued at USD 3.40 billion in 2024 and is projected to reach USD 7.77 billion by 2032, with a CAGR of 10.8% during the forecast period of 2025 to 2032. In addition to the insights on market scenarios such as market value, growth rate, segmentation, geographical coverage, and major players, the market reports curated by the Data Bridge Market Research also include import export analysis, production capacity overview, production consumption analysis, price trend analysis, climate change scenario, supply chain analysis, value chain analysis, raw material/consumables overview, vendor selection criteria, PESTLE Analysis, Porter Analysis, and regulatory framework.
North America Flow Cytometry Market Trends
“Increasing Adoption of Multi-Parameter Analysis Capabilities”
One significant trend in the North America flow cytometry market is the increasing adoption of multi-parameter analysis capabilities, driven by advancements in technology that allow for the simultaneous measurement of numerous cellular markers. This trend is largely fueled by the rising demand for detailed cellular characterization in areas such as cancer research, immunology, and personalized medicine, where complex cellular interactions need to be understood. Innovations in laser systems, detectors, and software are making it possible to analyze more parameters with greater sensitivity and resolution, enabling researchers and clinicians to gain deeper insights into biological processes and improve diagnostic accuracy. This shift towards more sophisticated flow cytometry systems is transforming research methodologies and expanding the applicability of flow cytometry across various fields.
Report Scope and North America Flow Cytometry Market Segmentation
|
Attributes |
North America Flow Cytometry Market Insights |
|
Segments Covered |
|
|
Region Covered |
U.S., Canada , Mexico, Germany, France, U.K., Italy, Spain, Russia, Netherlands, Switzerland, Turkey, Belgium, Austria, Ireland, Norway, Poland, Rest of Europe, Japan, China, India, South Korea, Australia, Singapore, Thailand, Malaysia, Indonesia, Vietnam, Philippines, Rest of Asia-Pacific, Brazil, Argentina, Peru, Rest of South America, South Africa, Saudi Arabia, U.A.E., Egypt, Kuwait, Israel, and Rest of Middle East & Africa |
|
Key Market Players |
BD (U.S.), Agilent Technologies, Inc.(U.S.), Thermo Fisher Scientific Inc.(U.S.), Bio-Rad Laboratories, Inc.(U.S.), Sartorius AG (Germany), Bennubio Inc. (U.S.), Enzo Biochem Inc. (U.S.), Apogee Flow Systems Ltd. (U.K.), Beckman Coulter, Inc. (U.S.), Coherent Corp. (U.S.), Cell Signaling Technology, Inc. (U.S.), Cytek Biosciences (U.S.), Biomérieux. (France), Cytonome/ST LLC (U.S.), among others |
|
Market Opportunities |
|
|
Value Added Data Infosets |
In addition to the insights on market scenarios such as market value, growth rate, segmentation, geographical coverage, and major players, the market reports curated by the Data Bridge Market Research also include import export analysis, production capacity overview, production consumption analysis, price trend analysis, climate change scenario, supply chain analysis, value chain analysis, raw material/consumables overview, vendor selection criteria, PESTLE Analysis, Porter Analysis, and regulatory framework. |
North America Flow Cytometry Market Definition
The North America flow cytometry market refers to the industry that encompasses the development, production, and distribution of flow cytometry equipment, reagents, software, and services used for analyzing and sorting cells and other particles suspended in a fluid stream. Flow cytometry is a powerful technique that allows for the simultaneous measurement of multiple physical and chemical characteristics of individual cells, such as size, complexity, and protein expression. This technology is widely employed in various applications, including immunology, oncology, microbiology, and drug development, making it an essential tool in both clinical diagnostics and research settings.
North America Flow Cytometry Market Dynamics
Drivers
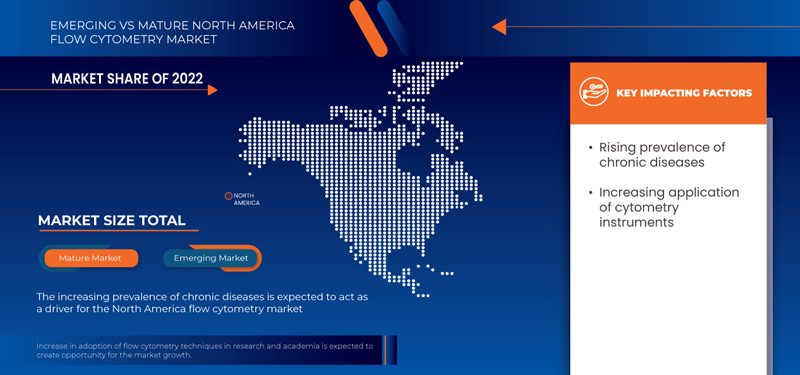
- Rising Prevalence of Chronic Diseases
Flow cytometry is a technique for detecting and quantifying the physical and chemical properties of a population of cells or particles. A sample containing cells or particles is suspended in a fluid and injected into the flow cytometer equipment in this process. Flow cytometry is a well-established technology for identifying cells in a solution that is most typically used to assess peripheral blood, bone marrow, and other bodily fluids. Immune cells are identified and quantified using flow cytometry, which is also used to describe hematological malignancies. The evaluation of cells through this technique has a key role in diagnosing many chronic diseases. It analyzes biological activities inside cells, apoptosis, necrosis, cell cycle, cell membrane, cell proliferation, and measurement of DNA per cell.
The major diagnostic applications include benign hematologic process, cancer, AIDS, immune deficiency, benign hematologic, and these diseases' detection using fluorescence. In this process, cells are dyed with fluorophores to detect the light emitted to produce the intensity by labeling specific proteins (immunophenotyping) for diagnosing leukemia and lymphomas.
The increasing prevalence of chronic diseases has created a growing demand for flow cytometric techniques that can help researchers and clinicians better understand the underlying mechanisms of these diseases and develop more effective treatments.
- Increasing Application of Cytometry Instruments
Flow cytometry is a powerful analytical tool used to analyze and quantify single cells or particles in a heterogeneous mixture. It uses lasers and optics to detect and measure cells or particles such as size, shape and fluorescence intensity. This technique involves labeling cells or particles with fluorescent dyes or antibodies that bind to specific cell surface markers or intracellular molecules. The labeled cells or particles are then passed through a flow cytometer, which detects and measures the fluorescence emitted by each cell or particle. Flow cytometry is widely used in many research fields, including immunology, microbiology, stem cell research, cancer research, drug discovery and development, and clinical diagnostics. The technique is constantly evolving with new applications and hardware and software improvements, making it an important tool in the study of biological systems.
For instance,
- In July 2023, according to the article published by NCBI, the increasing application of flow cytometry in diverse fields, including immunophenotyping, viability assays, cell cycle analysis, and rare cell identification, drives the North America flow cytometry market. Its ability to analyze individual cells at a single-cell level and sort specific populations for advanced research fuels demand. This versatility accelerates growth in both academic and clinical research, propelling market expansion.
- In June 2020, according to the article published by the Wiley online library, flow cytometry can be used to identify and characterize different subsets of immune cells in patients with autoimmune diseases such as Systemic Lupus Erythematosus (SLE). The study concluded that flow cytometry could provide valuable insights into the pathogenesis of these diseases and help develop more targeted therapies. This accelerates growth in both academic and clinical research, propelling market expansion.
Growing Use of Flow Cytometry in Drug Discovery
- The expanding research activities are projected to drive the growth of flow cytometry. It has emerged as the major key to exploring drug discovery and development processes. Due to its outstanding ability to analyze heterogeneous populations of cells, flow cytometry presents an appealing promise for drug discovery and development paths. It delivers higher-resolution insights into the multiparameter functional and biological information of a single cell. Moreover, continuing progress in flow cytometry approaches such as high-throughput multifactorial analysis, cell sorting improvements, and quick event detection and resolution ensures increased efficiency in finding and characterizing novel bioactive medicines.
- For instance;-
- In March 2024, according to the article published by NCBI, the increasing use of flow cytometry in drug discovery, particularly for biomarker modulation in early clinical trials, drives the North America flow cytometry market. Its ability to provide valuable insights into molecule progression and reverse translation of patient data accelerates discoveries in therapeutic development. This growing application in drug discovery propels the demand for advanced flow cytometry technologies in the healthcare and pharmaceutical sectors.
- In November 2021, according to the article published by News Medical Life Sciences, the increased use of flow cytometry in drug discovery, from target identification to lead development, is driving the North America market. It enables the analysis of various biomolecular structures, including cell membranes, proteins, DNA, and mRNA, allowing for precise targeting in drug development. This broad applicability in understanding complex biological processes accelerates the demand for flow cytometry technologies in pharmaceutical research.
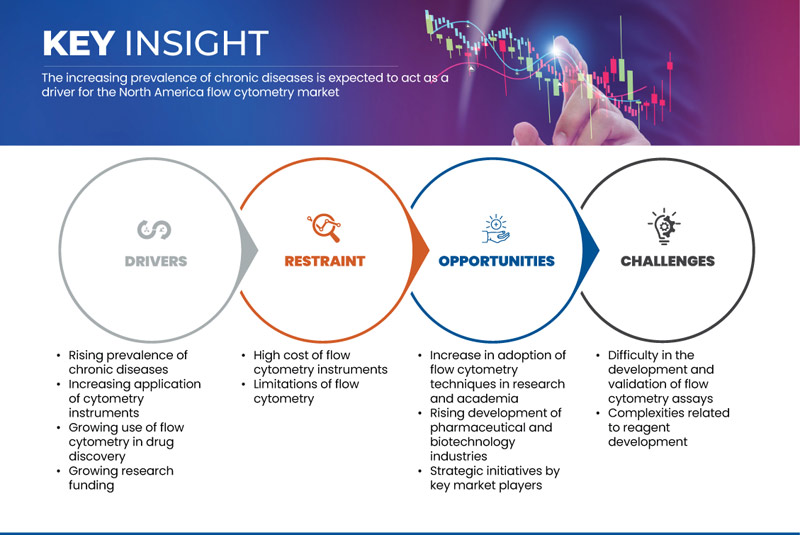
Opportunities
- Increase In Adoption of Flow Cytometry Techniques in Research and Academia
Flow cytometry is a sophisticated technique for measuring individual cells and other particles in suspension at a rate of thousands of cells per second. Flow cytometry has been extended to environmental investigations, extracellular vesicle analysis, and the capacity to use upwards of 30 different parameters for more extensive analysis. It is most typically used in the setting of immunology. Flow cytometers provide exceptional capabilities, high-quality data, and an easy-to-use platform that saves time for researchers while collecting and evaluating data.
The rise in chronic diseases and infectious diseases prevalence and incidence has opened wide opportunities for enormous research and development for novel diagnostic and therapeutic applications.
For instances,
In February 2021, according to a study published in PLOS ONE, researchers used flow cytometry to analyze the immune response of patients with COVID-19. The study found that flow cytometry was a reliable and effective tool for characterizing the immune response to the virus, which could help guide treatment strategies
In April 2021, according to a study published in Frontiers in Immunology, researchers used flow cytometry to study the immune response to HIV infection. The study found that flow cytometry was an effective tool for characterizing the immune response to the virus, which could lead to the development of new treatments and vaccines
- Rising Development of Pharmaceutical and Biotechnology Industries
Flow cytometry instruments have become an integral part of drug discovery and development in the pharmaceutical and biotechnology industries. The development of new flow cytometry equipment has helped researchers analyze and sort cells faster, more accurately and more efficiently, which has helped speed up the drug development timeline. For instance, Beckman Coulter, a leading manufacturer of flow cytometry equipment, has developed the CytoFLEX LX flow cytometer with rapid detection, enhanced sensitivity and a small footprint. CytoFLEX LX is designed to help researchers analyze rare cell populations faster and more efficiently.
Overall, the development of new flow cytometry devices is helping pharmaceutical and biotechnology companies accelerate drug development timelines by enabling faster and more accurate analysis of complex cell populations. With the rising geriatric population and chronic disease cases, the growth of biotechnology and pharmaceutical firms is also expanding. Across the globe, research and development activities are escalating due to public health expenditure with economic performance.
For instance,
- In October 2024, Ardena announced a substantial expansion of its Bioanalytical in the Netherlands. Moreover, it focused on expanding its capabilities in immunochemistry, flow cytometry, and qPCR platforms, increasing its LC-MS/MS capacity, and adding new Hamilton automated systems to enhance efficiency and address evolving bioanalytical challenges
- In April 2021, according to data provided by the CBO (Congressional Budget Office), the pharmaceutical sector spent USD 83 Billion on research and development. These costs were incurred for a number of operations, including the discovery and testing of novel medications, the development of incremental advancements such as product expansions, and clinical testing for safety monitoring and marketing
Restraints/Challenges
- High Cost of Flow Cytometry Instruments
The substantial initial investment required for flow cytometry instruments, coupled with the ongoing costs of reagents, dyes, and maintenance, creates financial barriers, particularly for smaller laboratories or those in resource-constrained environments. In addition, the technical complexity of flow cytometry demands skilled personnel for operation, with specialized training required to properly utilize the technology. This limits its accessibility in regions where expertise is lacking, reducing its adoption rate. Moreover, flow cytometry systems require regular maintenance, calibration, and troubleshooting, which increases operational costs and can result in downtime, further impacting laboratory efficiency. Stringent regulatory requirements for approval of these medical devices also create delays in market entry and additional compliance costs. These factors collectively hinder the widespread adoption of flow cytometry, especially in emerging markets where financial constraints, lack of trained professionals, and slow regulatory processes act as significant barriers to growth, ultimately restraining the market’s potential expansion.
For Instance
- In January 2024, according to the article published by Excedr, the high cost of flow cytometry instruments, ranging from USDUSD100,000 to USDUSD1.5 million, acts as a significant restraint for the North America market. These expenses limit access to smaller labs and institutions, making it challenging for them to adopt advanced technology. As a result, the high initial investment and maintenance costs hinder widespread use and slow market growth, especially in resource-limited settings.
- In November 2023, according to the article published by NCBI, the high cost of flow cytometry instruments, ranging from USD50,000 to USD750,000 or more, acts as a significant restraint on the North America market. This substantial financial investment required for advanced features and specifications limits accessibility, especially for smaller research labs and institutions with constrained budgets. Consequently, the high cost slows adoption and hampers market growth, particularly in resource-limited settings.
The initial investment in instruments and the ongoing expenses for reagents and maintenance create financial challenges for smaller labs and those in resource-limited areas. The technology’s complexity also requires trained personnel, limiting its use in regions lacking expertise. In addition, the need for regular maintenance and calibration increases operational costs and causes potential downtime. Strict regulatory requirements further delay product approval and market entry. These factors limit the adoption of flow cytometry, especially in emerging markets, restraining the overall growth of the market.
- Limitations of Flow Cytometry
Flow cytometry has inherent limitations, such as its inability to analyze formalin-fixed tissues, which restricts its use in certain research and clinical applications. The method is designed for fresh or frozen samples, and formalin fixation can alter cell structure and marker expression, rendering them unsuitable for analysis. In addition, flow cytometry struggles to fully capture complex cellular interactions or multi-layered signaling pathways. These restrictions limit the scope of its use in various fields and act as a restraint on the North America flow cytometry market by narrowing its applicability, particularly in clinical and pathology settings.
For instance-
- In June 2021, according to the article published by LearnHaem, Flow cytometry requires fresh samples to be processed immediately after collection, as improper storage or prolonged storage leads to natural apoptosis, which diminishes the accuracy of results. In addition, flow cytometry cannot be used on formalin-fixed tissues, limiting its application in certain clinical and research environments. These constraints act as a restraint on the North America flow cytometry market by reducing its versatility and applicability in some areas.
- In March 2020, according to the article published by NCBI, Flow cytometry faced limitations due to optical blur caused by high cell movement, which affects image clarity. In addition, the detection of rare and atypical objects, such as Circulating Tumor Cells (CTCs), poses a challenge despite their prognostic importance. These issues limit the ability to accurately capture and analyze critical biomarkers, restraining the growth and application of flow cytometry in certain diagnostic and research areas.
Flow cytometry faces limitations, such as its inability to analyze formalin-fixed tissues, which are commonly used in pathology and clinical diagnostics. The process requires fresh or frozen samples, and the chemical fixation process alters cell markers, rendering them incompatible with flow cytometric analysis. Furthermore, the technique struggles to fully capture intricate cellular interactions or complex signaling pathways. These limitations restrict the technology’s broader application, acting as a restraint on the North America flow cytometry market by reducing its versatility in clinical and research settings.
North America Flow Cytometry Market Scope
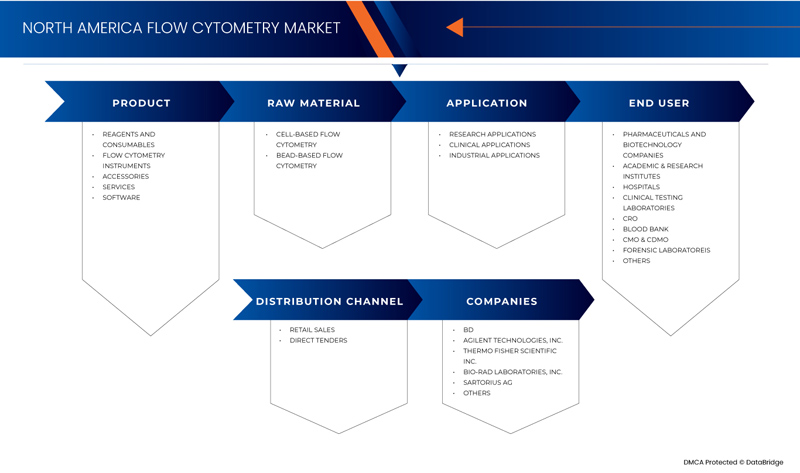
The market is segmented on the basis of product, application, technology, distribution channel, and end user. The growth amongst these segments will help you analyze meagre growth segments in the industries and provide the users with a valuable market overview and market insights to help them make strategic decisions for identifying core market applications.
Product
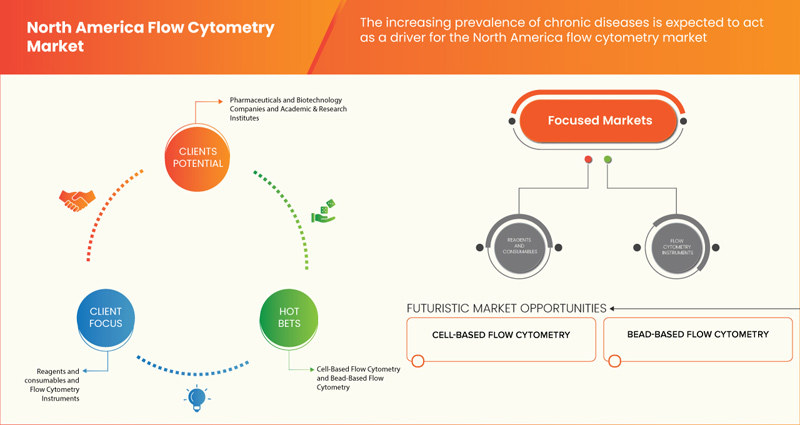
- Reagents And Consumables
- Dye
- Antibodies
- Beads
- Others
- Flow Cytometry Instruments
- Cell Analyzers
- By Type
- Imaging Flow Cytometers
- Non-Imaging Flow Cytometers
- By Range
- High-Range Cell Analyzers
- Mid-Range Cell Analyzers
- Low-Range Cell Analyzers
- By Modality
- Benchtop
- Standalone
- By Type
- Cell Sorters
- By Modality
- Benchtop
- Standalone
- By Range
- High-Range Cell Analyzers
- Mid-Range Cell Analyzers
- Low-Range Cell Analyzers
- By Modality
- Cell Analyzers
- Accessories
- Filters
- Detectors
- Others
- Services
- Software
Technology
- Cell-Based Flow Cytometry
- Flow Cytometry Instruments
- Reagnets & Consumables
- Accessories
- Bead-Based Flow Cytometry
- Flow Cytometry Instruments
- Reagnets & Consumables
- Accessories
Application
- Research Applications
- Cell Cycle Analysis
- Cell Sorting/Screening
- Cell Transfection/Viability
- Pharmaceutical And Biotechnology
- Drug Discovery
- Stem Cell Research
- In Vitro Toxicity Testing
- Immunology
- Apoptosis
- Cell Counting
- Others
- Clinical Applications
- Hematology
- Cancer
- Immunodeficiency Diseases
- Organ Transplantation
- Other Clinical Application
- Industrial Applications
End User
- Pharmaceuticals And Biotechnology Companies
- Academic & Research Institutes
- Hospitals
- Clinical Testing Laboratories
- Cro
- Blood Bank
- Cmo & Cdmo
- Forensic Laboratoreis
- Others
Distribution Channel
- Retail Sales
- Offline
- Online
- Direct Tenders
North America Flow Cytometry Market Regional Analysis
The market is analyzed and market size insights and trends are provided by country, product, application, technology, distribution channel, and end user as referenced above.
The countries covered in the market are U.S., Canada , Mexico, Germany, France, U.K., Italy, Spain, Russia, Netherlands, Switzerland, Turkey, Belgium, Austria, Ireland, Norway, Poland, Rest of Europe, Japan, China, India, South Korea, Australia, Singapore, Thailand, Malaysia, Indonesia, Vietnam, Philippines, Rest of Asia-Pacific, Brazil, Argentina, Peru, Rest of South America, South Africa, Saudi Arabia, U.A.E., Egypt, Kuwait, Israel, and Rest of Middle East & Africa.
The U.S. dominate the flow cytometry market due to its strong research and development sector, presence of leading companies like BD Biosciences and Beckman Coulter, and substantial government funding. In addition, its advanced healthcare and biotechnology industries drive the widespread use of flow cytometry in research and clinical applications.
Canada is the fastest-growing country in flow cytometry due to its expanding biotechnology and pharmaceutical sectors, increasing research funding, and strong academic collaborations. The country's focus on healthcare innovation, coupled with a growing demand for advanced diagnostic tools, drives the adoption of flow cytometry technologies in research and clinical applications.
The country section of the report also provides individual market impacting factors and changes in regulation in the market domestically that impacts the current and future trends of the market. Data points like down-stream and upstream value chain analysis, technical trends and porter's five forces analysis, case studies are some of the pointers used to forecast the market scenario for individual countries. Also, the presence and availability of North America brands and their challenges faced due to large or scarce competition from local and domestic brands, impact of domestic tariffs and trade routes are considered while providing forecast analysis of the country data.
North America Flow Cytometry Market Share
The market competitive landscape provides details by competitor. Details included are company overview, company financials, revenue generated, market potential, investment in research and development, new market initiatives, North America presence, production sites and facilities, production capacities, company strengths and weaknesses, product launch, product width and breadth, application dominance. The above data points provided are only related to the companies' focus related to market.
North America Flow Cytometry Market Leaders Operating in the Market Are:
- BD (U.S.)
- Agilent Technologies, Inc. (U.S.)
- Thermo Fisher Scientific Inc. (U.S.)
- Bio-Rad Laboratories, Inc. (U.S.)
- Sartorius AG(U.S.)
- CytoBuoy(U.S.)
- ORLFO Technologies(U.S.)
- Bennubio Inc. (U.S.)
- Enzo Biochem Inc. (U.S.)
- Merck KGaA(U.S.)
- Apogee Flow Systems Ltd. (U.S.)
- Beckman Coulter, Inc. (U.S.)
- Coherent Corp. (U.S.)
- NeoGenomics Laboratories (U.S.)
- Sysmex Corporation (U.S.)
- Luminex Corporation(U.S.)
- Elabscience Bionovation Inc. (U.S.)
- Miltenyi Biotec
- Takara Bio Inc. (U.S.)
- Cell Signaling Technology, Inc. (U.S.)
- Sony Biotechnology Inc. (U.S.)
- Cytek Biosciences(U.S.)
- Biomérieux(U.S.).
- On-chip Biotechnologies Co., Ltd. Corporation(U.S.)
- NanoCellect Biomedical(U.S.)
- Stratedigm, Inc(U.S.)
- Cytonome/ST LLC(U.S.)
- Union Biometrica, Inc. (U.S.)
Latest Developments North America Flow Cytometry Market
- In July 2024, Agilent Technologies has announced the acquisition of Canadian drug services firm BioVectra for USD 925 million. This move expands Agilent's capabilities in gene editing, specifically in manufacturing oligonucleotides and peptides, enhancing its role in RNA-based therapies and gene editing technologies like CRISPR-Cas
- In June 2024, Thermo Fisher celebrated the ribbon-cutting of a 72,500-square-foot expansion at its Middleton campus, which will serve as a laboratory for pharmaceutical testing. The project will create 350 jobs over the next two years, with state tax credits supporting the initiative
- In November 2024, Sartorius Stedim Biotech has opened a new Center for Bioprocess Innovation in Marlborough, Massachusetts, aimed at advancing the development of next-generation therapeutics. The 63,000-square-foot facility will provide process optimization, training, and GMP suites for clinical production starting in 2025
- In March 2024, Beckman Coulter Life Sciences has launched the CytoFLEX nano Flow Cytometer, a breakthrough in nanoparticle analysis that enables detection as small as 40 nm. This system enhances sensitivity, offering up to 50% more data for research into extracellular vesicles and lower-abundance targets
- In March 2024, Beckman Coulter Life Sciences has received FDA 510(k) clearance to distribute its DxFLEX Clinical Flow Cytometer in the U.S. This simplifies high-complexity testing with enhanced sensitivity and automated compensation, making multicolor flow cytometry more accessible and efficient for labs
SKU-

- Interactive Data Analysis Dashboard
- Company Analysis Dashboard for high growth potential opportunities
- Research Analyst Access for customization & queries
- Competitor Analysis with Interactive dashboard
- Latest News, Updates & Trend analysis
- Harness the Power of Benchmark Analysis for Comprehensive Competitor Tracking
Table of Content
1 INTRODUCTION
1.1 OBJECTIVES OF THE STUDY
1.2 MARKET DEFINITION
1.3 OVERVIEW OF THE NORTH AMERICA FLOW CYTOMETRY MARKET
1.4 CURRENCY AND PRICING
1.5 LIMITATIONS
1.6 MARKETS COVERED
2 MARKET SEGMENTATION
2.1 MARKETS COVERED
2.2 GEOGRAPHICAL SCOPE
2.3 YEARS CONSIDERED FOR THE STUDY
2.4 DBMR TRIPOD DATA VALIDATION MODEL
2.5 PRIMARY INTERVIEWS WITH KEY OPINION LEADERS
2.6 MULTIVARIATE MODELLING
2.7 DBMR MARKET POSITION GRID
2.8 VENDOR SHARE ANALYSIS
2.9 MARKET END USER COVERAGE GRID
2.1 SECONDARY SOURCES
2.11 ASSUMPTIONS
3 EXECUTIVE SUMMARY
4 PREMIUM INSIGHTS
4.1 PORTER’S FIVE FORCES
4.2 PESTEL ANALYSIS
5 NORTH AMERICA FLOW CYTOMETRY MARKET: REGULATIONS
5.1 NORTH AMERICA (U.S. AND CANADA)
6 MARKET OVERVIEW
6.1 DRIVERS
6.1.1 RISING PREVALENCE OF CHRONIC DISEASES
6.1.2 INCREASING APPLICATION OF CYTOMETRY INSTRUMENTS
6.1.3 GROWING USE OF FLOW CYTOMETRY IN DRUG DISCOVERY
6.1.4 GROWING RESEARCH FUNDING
6.2 RESTRAINTS
6.2.1 HIGH COST OF FLOW CYTOMETRY INSTRUMENTS
6.2.2 LIMITATIONS OF FLOW CYTOMETRY
6.3 OPPORTUNITIES
6.3.1 INCREASE IN ADOPTION OF FLOW CYTOMETRY TECHNIQUES IN RESEARCH AND ACADEMIA
6.3.2 RISING DEVELOPMENT OF PHARMACEUTICAL AND BIOTECHNOLOGY INDUSTRIES
6.3.3 STRATEGIC INITIATIVES BY KEY MARKET PLAYERS
6.4 CHALLENGES
6.4.1 DIFFICULTY IN THE DEVELOPMENT AND VALIDATION OF FLOW CYTOMETRY ASSAYS
6.4.2 COMPLEXITIES RELATED TO REAGENT DEVELOPMENT
7 NORTH AMERICA FLOW CYTOMETRY MARKET, BY PRODUCT
7.1 OVERVIEW
7.2 REAGENTS AND CONSUMABLES
7.2.1 DYE
7.2.2 ANTIBODIES
7.2.3 BEADS
7.2.4 OTHERS
7.3 FLOW CYTOMETRY INSTRUMENTS
7.3.1 CELL ANALYZERS
7.3.1.1 CELL ANALYZERS, BY TYPE
7.3.1.1.1 IMAGING FLOW CYTOMETERS
7.3.1.1.2 NON-IMAGING FLOW CYTOMETERS
7.3.1.2 CELL ANALYZERS, BY RANGE
7.3.1.2.1 HIGH-RANGE CELL ANALYZERS
7.3.1.2.2 MID-RANGE CELL ANALYZERS
7.3.1.2.3 LOW-RANGE CELL ANALYZERS
7.3.1.3 CELL ANALYZERS, BY MODALITY
7.3.1.3.1 BENCHTOP
7.3.1.3.2 STANDALONE
7.3.2 CELL SORTERS
7.3.2.1 BENCHTOP
7.3.2.2 STANDALONE
7.3.3 CELL SORTERS
7.3.3.1 HIGH-RANGE CELL ANALYZERS
7.3.3.2 MID-RANGE CELL ANALYZERS
7.3.3.3 LOW-RANGE CELL ANALYZERS
7.4 ACCESSORIES
7.4.1 FILTERS
7.4.2 DETECTORS
7.4.3 OTHERS
7.5 SERVICES
7.6 SOFTWARE
8 NORTH AMERICA FLOW CYTOMETRY MARKET, BY TECHNOLOGY
8.1 OVERVIEW
8.2 CELL-BASED FLOW CYTOMETRY
8.2.1 FLOW CYTOMETRY INSTRUMENTS
8.2.2 REAGENTS & CONSUMABLES
8.2.3 ACCESSORIES
8.3 BEAD-BASED FLOW CYTOMETRY
8.3.1 FLOW CYTOMETRY INSTRUMENTS
8.3.2 REAGENTS & CONSUMABLES
8.3.3 ACCESSORIES
9 NORTH AMERICA FLOW CYTOMETRY MARKET, BY APPLICATION
9.1 OVERVIEW
9.2 RESEARCH APPLICATIONS
9.2.1 CELL CYCLE ANALYSIS
9.2.2 CELL SORTING/SCREENING
9.2.3 CELL TRANSFECTION/VIABILITY
9.2.4 PHARMACEUTICAL AND BIOTECHNOLOGY
9.2.4.1 DRUG DISCOVERY
9.2.4.2 STEM CELL RESEARCH
9.2.4.3 IN VITRO TOXICITY TESTING
9.2.5 IMMUNOLOGY
9.2.6 APOPTOSIS
9.2.7 CELL COUNTING
9.2.8 OTHERS
9.3 CLINICAL APPLICATIONS
9.3.1 HAEMATOLOGY
9.3.2 CANCER
9.3.3 IMMUNODEFICIENCY DISEASES
9.3.4 ORGAN TRANSPLANTATION
9.3.5 OTHER CLINICAL APPLICATION
9.4 INDUSTRIAL APPLICATIONS
10 NORTH AMERICA FLOW CYTOMETRY MARKET, BY DISTRIBUTION CHANNEL
10.1 OVERVIEW
10.2 RETAIL SALES
10.2.1 OFFLINE
10.2.2 ONLINE
10.3 DIRECT TENDERS
11 NORTH AMERICA FLOW CYTOMETRY MARKET, BY END USER
11.1 OVERVIEW
11.2 PHARMACEUTICALS AND BIOTECHNOLOGY COMPANIES
11.3 ACADEMIC & RESEARCH INSTITUTES
11.4 HOSPITALS
11.5 CLINICAL TESTING LABORATORIES
11.6 CRO
11.7 BLOOD BANK
11.8 CMO & CDMO
11.9 FORENSIC LABORATORIES
11.1 OTHERS
12 NORTH AMERICA FLOW CYTOMETRY MARKET, BY COUNTRY
12.1 NORTH AMERICA
12.1.1 U.S.
12.1.2 CANADA
12.1.3 MEXICO
13 NORTH AMERICA FLOW CYTOMETRY MARKET: COMPANY LANDSCAPE
13.1 COMPANY SHARE ANALYSIS: NORTH AMERICA
14 SWOT ANALYSIS
15 COMPANY PROFILES
15.1 BD
15.1.1 COMPANY SNAPSHOT
15.1.2 REVENUE ANALYSIS
15.1.3 PRODUCT PORTFOLIO
15.1.4 RECENT DEVELOPMENT
15.2 AGILENT TECHNOLOGIES, INC.
15.2.1 COMPANY SNAPSHOT
15.2.2 REVENUE ANALYSIS
15.2.3 PRODUCT PORTFOLIO
15.2.4 RECENT DEVELOPMENT
15.3 THERMO FISHER SCIENTIFIC INC.
15.3.1 COMPANY SNAPSHOT
15.3.2 REVENUE ANALYSIS
15.3.3 PRODUCT PORTFOLIO
15.3.4 RECENT DEVELOPMENT
15.4 BIO-RAD LABORATORIES, INC.
15.4.1 COMPANY SNAPSHOT
15.4.2 REVENUE ANALYSIS
15.4.3 PRODUCT PORTFOLIO
15.4.4 RECENT DEVELOPMENT
15.5 SARTORIUS AG
15.5.1 COMPANY SNAPSHOT
15.5.2 REVENUE ANALYSIS
15.5.3 PRODUCT PORTFOLIO
15.5.4 RECENT DEVELOPMENT
15.6 APOGEE FLOW SYSTEMS LTD.
15.6.1 COMPANY SNAPSHOT
15.6.2 PRODUCT PORTFOLIO
15.6.3 RECENT DEVELOPMENT
15.7 BECKMAN COULTER, INC. (A SUBSIDIARY OF DANAHER CORPORATION)
15.7.1 COMPANY SNAPSHOT
15.7.2 REVENUE ANALYSIS
15.7.3 PRODUCT PORTFOLIO
15.7.4 RECENT DEVELOPMENT
15.8 BIOMÉRIEUX
15.8.1 COMPANY SNAPSHOT
15.8.2 REVENUE ANALYSIS
15.8.3 PRODUCT PORTFOLIO
15.8.4 RECENT DEVELOPMENT
15.9 BIOLEGEND, INC.
15.9.1 COMPANY SNAPSHOT
15.9.2 PRODUCT PORTFOLIO
15.9.3 RECENT DEVELOPMENT
15.1 BENNUBIO INC.
15.10.1 COMPANY SNAPSHOT
15.10.2 PRODUCT PORTFOLIO
15.10.3 RECENT DEVELOPMENT
15.11 COHERENT CORP.
15.11.1 COMPANY SNAPSHOT
15.11.2 REVENUE ANALYSIS
15.11.3 PRODUCT PORTFOLIO
15.11.4 RECENT DEVELOPMENT
15.12 CYTONOME/ST, LLC
15.12.1 COMPANY SNAPSHOT
15.12.2 PRODUCT PORTFOLIO
15.12.3 RECENT DEVELOPMENTS
15.13 CELL SIGNALING TECHNOLOGY, INC
15.13.1 COMPANY SNAPSHOT
15.13.2 PRODUCT PORTFOLIO
15.13.3 RECENT DEVELOPMENT
15.14 CYTEK BIOSCIENCES
15.14.1 COMPANY SNAPSHOT
15.14.2 PRODUCT PORTFOLIO
15.14.3 RECENT DEVELOPMENT
15.15 DIASORIN S.P.A.
15.15.1 COMPANY SNAPSHOT
15.15.2 REVENUE ANALYSIS
15.15.3 PRODUCT PORTFOLIO
15.15.4 RECENT DEVELOPMENT
15.16 ELABSCIENCE BIONOVATION INC.
15.16.1 COMPANY SNAPSHOT
15.16.2 PRODUCT PORTFOLIO
15.16.3 RECENT DEVELOPMENT
15.17 ENZO BIOCHEM, INC
15.17.1 COMPANY SNAPSHOT
15.17.2 REVENUE ANALYSIS
15.17.3 PRODUCT PORTFOLIO
15.17.4 RECENT DEVELOPMENT
15.18 MILTENYI BIOTEC
15.18.1 COMPANY SNAPSHOT
15.18.2 PRODUCT PORTFOLIO
15.18.3 RECENT DEVELOPMENT
15.19 MERCK KGAA
15.19.1 COMPANY SNAPSHOT
15.19.2 REVENUE ANALYSIS
15.19.3 PRODUCT PORTFOLIO
15.19.4 RECENT DEVELOPMENT
15.2 NANOCELLECT BIOMEDICAL
15.20.1 COMPANY SNAPSHOT
15.20.2 PRODUCT PORTFOLIO
15.20.3 RECENT DEVELOPMENTS
15.21 NEOGENOMICS LABORATORIES
15.21.1 COMPANY SNAPSHOT
15.21.2 REVENUE ANALYSIS
15.21.3 PRODUCT PORTFOLIO
15.21.4 RECENT DEVELOPMENT
15.22 ON-CHIP BIOTECHNOLOGIES CO., LTD. CORPORATION
15.22.1 COMPANY SNAPSHOT
15.22.2 PRODUCT PORTFOLIO
15.22.3 RECENT DEVELOPMENTS
15.23 ORLFO TECHNOLOGIES
15.23.1 COMPANY SNAPSHOT
15.23.2 PRODUCT PORTFOLIO
15.23.3 RECENT DEVELOPMENT
15.24 STRATEDIGM, INC
15.24.1 COMPANY SNAPSHOT
15.24.2 PRODUCT PORTFOLIO
15.24.3 RECENT DEVELOPMENTS
15.25 SONY BIOTECHNOLOGY INC.
15.25.1 COMPANY SNAPSHOT
15.25.2 PRODUCT PORTFOLIO
15.25.3 RECENT DEVELOPMENT
15.26 SYSMEX ASIA PACIFIC PTE LTD (PART OF SYSMEX CORPORATION)
15.26.1 COMPANY SNAPSHOT
15.26.2 REVENUE ANALYSIS
15.26.3 PRODUCT PORTFOLIO
15.26.4 RECENT DEVELOPMENT
15.27 UNION BIOMETRICA, INC.
15.27.1 COMPANY SNAPSHOT
15.27.2 PRODUCT PORTFOLIO
15.27.3 RECENT DEVELOPMENTS
16 QUESTIONNAIRE
17 RELATED REPORTS
List of Table
TABLE 1 NORTH AMERICA FLOW CYTOMETRY MARKET, BY PRODUCT, 2018-2032 (USD MILLION)
TABLE 2 NORTH AMERICA REAGENTS AND CONSUMABLES IN FLOW CYTOMETRY MARKET, BY PRODUCT, 2018-2032 (USD MILLION)
TABLE 3 NORTH AMERICA REAGENTS AND CONSUMABLES IN FLOW CYTOMETRY MARKET, BY PRODUCT, 2018-2032 (VOLUME)
TABLE 4 NORTH AMERICA FLOW CYTOMETRY INSTRUMENTS IN FLOW CYTOMETRY MARKET, BY PRODUCT, 2018-2032 (USD MILLION)
TABLE 5 NORTH AMERICA CELL ANALYZERS IN FLOW CYTOMETRY MARKET, BY TYPE, 2018-2032 (USD MILLION)
TABLE 6 NORTH AMERICA CELL ANALYZERS IN FLOW CYTOMETRY MARKET, BY TYPE, 2018-2032 (VOLUME)
TABLE 7 NORTH AMERICA CELL ANALYZERS IN FLOW CYTOMETRY MARKET, BY RANGE, 2018-2032 (USD MILLION)
TABLE 8 NORTH AMERICA CELL ANALYZERS IN FLOW CYTOMETRY MARKET, BY MODALITY, 2018-2032 (USD MILLION)
TABLE 9 NORTH AMERICA CELL ANALYZERS IN FLOW CYTOMETRY MARKET, BY MODALITY, 2018-2032 (VOLUME)
TABLE 10 NORTH AMERICA CELL SORTERS IN FLOW CYTOMETRY MARKET, BY MODALITY, 2018-2032 (USD MILLION)
TABLE 11 NORTH AMERICA CELL SORTERS IN FLOW CYTOMETRY MARKET, BY MODALITY, 2018-2032 (VOLUME)
TABLE 12 NORTH AMERICA CELL SORTERS IN FLOW CYTOMETRY MARKET, BY RANGE, 2018-2032 (USD MILLION)
TABLE 13 NORTH AMERICA CELL SORTERS IN FLOW CYTOMETRY MARKET, BY MODALITY, 2018-2032 (VOLUME)
TABLE 14 NORTH AMERICA ACCESSORIES IN FLOW CYTOMETRY MARKET, BY PRODUCT, 2018-2032 (USD MILLION)
TABLE 15 NORTH AMERICA ACCESSORIES IN FLOW CYTOMETRY MARKET, BY PRODUCT, 2018-2032 (VOLUME)
TABLE 16 NORTH AMERICA FLOW CYTOMETRY MARKET, BY TECHNOLOGY, 2018-2032 (USD MILLION)
TABLE 17 NORTH AMERICA CELL-BASED IN FLOW CYTOMETRY MARKET, BY TECHNOLOGY, 2018-2032 (USD MILLION)
TABLE 18 NORTH AMERICA BEAD-BASED IN FLOW CYTOMETRY MARKET, BY TECHNOLOGY, 2018-2032 (USD MILLION)
TABLE 19 NORTH AMERICA FLOW CYTOMETRY MARKET, BY APPLICATION, 2018-2032 (USD MILLION)
TABLE 20 NORTH AMERICA RESEARCH APPLICATIONS IN FLOW CYTOMETRY MARKET, BY APPLICATION, 2018-2032 (USD MILLION)
TABLE 21 NORTH AMERICA PHARMACEUTICAL AND BIOTECHNOLOGY IN FLOW CYTOMETRY MARKET, BY APPLICATION, 2018-2032 (USD MILLION)
TABLE 22 NORTH AMERICA CLINICAL APPLICATIONS IN FLOW CYTOMETRY MARKET, BY APPLICATION, 2018-2032 (USD MILLION)
TABLE 23 NORTH AMERICA FLOW CYTOMETRY MARKET, BY DISTRIBUTION CHANNEL, 2018-2032 (USD MILLION)
TABLE 24 NORTH AMERICA RETAIL SALES IN FLOW CYTOMETRY MARKET, BY DISTRIBUTION CHANNEL, 2018-2032 (USD MILLION)
TABLE 25 NORTH AMERICA FLOW CYTOMETRY MARKET, BY END USER, 2018-2032 (USD MILLION)
TABLE 26 NORTH AMERICA FLOW CYTOMETRY MARKET, BY COUNTRY, 2018-2032 (USD MILLION)
TABLE 27 U.S. FLOW CYTOMETRY MARKET, BY PRODUCT, 2018-2032 (USD MILLION)
TABLE 28 U.S. REAGENTS AND CONSUMABLES IN FLOW CYTOMETRY MARKET, BY PRODUCT, 2018-2032 (USD MILLION)
TABLE 29 U.S. REAGENTS AND CONSUMABLES IN FLOW CYTOMETRY MARKET, BY PRODUCT, 2018-2032 (VOLUME)
TABLE 30 U.S. REAGENTS AND CONSUMABLES IN FLOW CYTOMETRY MARKET, BY PRODUCT, 2018-2032 (ASP)
TABLE 31 U.S. FLOW CYTOMETRY INSTRUMENTS IN FLOW CYTOMETRY MARKET, BY PRODUCT, 2018-2032 (USD MILLION)
TABLE 32 U.S. CELL ANALYZERS IN FLOW CYTOMETRY MARKET, BY TYPE, 2018-2032 (USD MILLION)
TABLE 33 U.S. CELL ANALYZERS IN FLOW CYTOMETRY MARKET, BY TYPE, 2018-2032 (VOLUME)
TABLE 34 U.S. CELL ANALYZERS IN FLOW CYTOMETRY MARKET, BY TYPE, 2018-2032 (ASP)
TABLE 35 U.S. CELL ANALYZERS IN FLOW CYTOMETRY MARKET, BY RANGE, 2018-2032 (USD MILLION)
TABLE 36 U.S. CELL ANALYZERS IN FLOW CYTOMETRY MARKET, BY MODALITY, 2018-2032 (USD MILLION)
TABLE 37 U.S. CELL ANALYZERS IN FLOW CYTOMETRY MARKET, BY MODALITY, 2018-2032 (VOLUME)
TABLE 38 U.S. CELL ANALYZERS IN FLOW CYTOMETRY MARKET, BY MODALITY, 2018-2032 (ASP)
TABLE 39 U.S. CELL SORTERS IN FLOW CYTOMETRY MARKET, BY MODALITY, 2018-2032 (USD MILLION)
TABLE 40 U.S. CELL SORTERS IN FLOW CYTOMETRY MARKET, BY MODALITY, 2018-2032 (VOLUME)
TABLE 41 U.S. CELL SORTERS IN FLOW CYTOMETRY MARKET, BY MODALITY, 2018-2032 (ASP)
TABLE 42 U.S. CELL SORTERS IN FLOW CYTOMETRY MARKET, BY RANGE, 2018-2032 (USD MILLION)
TABLE 43 U.S. CELL SORTERS IN FLOW CYTOMETRY MARKET, BY RANGE, 2018-2032 (VOLUME)
TABLE 44 U.S. CELL SORTERS IN FLOW CYTOMETRY MARKET, BY RANGE, 2018-2032 (ASP)
TABLE 45 U.S. ACCESSORIES IN FLOW CYTOMETRY MARKET, BY PRODUCT, 2018-2032 (USD MILLION)
TABLE 46 U.S. ACCESSORIES IN FLOW CYTOMETRY MARKET, BY PRODUCT, 2018-2032 (VOLUME)
TABLE 47 U.S. ACCESSORIES IN FLOW CYTOMETRY MARKET, BY PRODUCT, 2018-2032 (ASP)
TABLE 48 U.S. FLOW CYTOMETRY MARKET, BY TECHNOLOGY, 2018-2032 (USD MILLION)
TABLE 49 U.S. CELL-BASED FLOW CYTOMETRY MARKET, BY TECHNOLOGY, 2018-2032 (USD MILLION)
TABLE 50 U.S. BEAD-BASED IN FLOW CYTOMETRY MARKET, BY TECHNOLOGY, 2018-2032 (USD MILLION)
TABLE 51 U.S. FLOW CYTOMETRY MARKET, BY APPLICATION, 2018-2032 (USD MILLION)
TABLE 52 U.S. RESEARCH APPLICATIONS IN FLOW CYTOMETRY MARKET, BY APPLICATION, 2018-2032 (USD MILLION)
TABLE 53 U.S. PHARMACEUTICAL AND BIOTECHNOLOGY IN FLOW CYTOMETRY MARKET, BY APPLICATION, 2018-2032 (USD MILLION)
TABLE 54 U.S. CLINICAL APPLICATIONS IN FLOW CYTOMETRY MARKET, BY APPLICATION, 2018-2032 (USD MILLION)
TABLE 55 U.S. FLOW CYTOMETRY MARKET, BY END USER, 2018-2032 (USD MILLION)
TABLE 56 U.S. FLOW CYTOMETRY MARKET, BY DISTRIBUTION CHANNEL, 2018-2032 (USD MILLION)
TABLE 57 U.S. RETAIL SALES IN FLOW CYTOMETRY MARKET, BY DISTRIBUTION CHANNEL, 2018-2032 (USD MILLION)
TABLE 58 CANADA FLOW CYTOMETRY MARKET, BY PRODUCT, 2018-2032 (USD MILLION)
TABLE 59 CANADA REAGENTS AND CONSUMABLES IN FLOW CYTOMETRY MARKET, BY PRODUCT, 2018-2032 (USD MILLION)
TABLE 60 CANADA REAGENTS AND CONSUMABLES IN FLOW CYTOMETRY MARKET, BY PRODUCT, 2018-2032 (VOLUME)
TABLE 61 CANADA REAGENTS AND CONSUMABLES IN FLOW CYTOMETRY MARKET, BY PRODUCT, 2018-2032 (ASP)
TABLE 62 CANADA FLOW CYTOMETRY INSTRUMENTS IN FLOW CYTOMETRY MARKET, BY PRODUCT, 2018-2032 (USD MILLION)
TABLE 63 CANADA CELL ANALYZERS IN FLOW CYTOMETRY MARKET, BY TYPE, 2018-2032 (USD MILLION)
TABLE 64 CANADA CELL ANALYZERS IN FLOW CYTOMETRY MARKET, BY TYPE, 2018-2032 (VOLUME)
TABLE 65 CANADA CELL ANALYZERS IN FLOW CYTOMETRY MARKET, BY TYPE, 2018-2032 (ASP)
TABLE 66 CANADA CELL ANALYZERS IN FLOW CYTOMETRY MARKET, BY RANGE, 2018-2032 (USD MILLION)
TABLE 67 CANADA CELL ANALYZERS IN FLOW CYTOMETRY MARKET, BY MODALITY, 2018-2032 (USD MILLION)
TABLE 68 CANADA CELL ANALYZERS IN FLOW CYTOMETRY MARKET, BY MODALITY, 2018-2032 (VOLUME)
TABLE 69 CANADA CELL ANALYZERS IN FLOW CYTOMETRY MARKET, BY MODALITY, 2018-2032 (ASP)
TABLE 70 CANADA CELL SORTERS IN FLOW CYTOMETRY MARKET, BY MODALITY, 2018-2032 (USD MILLION)
TABLE 71 CANADA CELL SORTERS IN FLOW CYTOMETRY MARKET, BY MODALITY, 2018-2032 (VOLUME)
TABLE 72 CANADA CELL SORTERS IN FLOW CYTOMETRY MARKET, BY MODALITY, 2018-2032 (ASP)
TABLE 73 CANADA CELL SORTERS IN FLOW CYTOMETRY MARKET, BY RANGE, 2018-2032 (USD MILLION)
TABLE 74 CANADA CELL SORTERS IN FLOW CYTOMETRY MARKET, BY RANGE, 2018-2032 (VOLUME)
TABLE 75 CANADA CELL SORTERS IN FLOW CYTOMETRY MARKET, BY RANGE, 2018-2032 (ASP)
TABLE 76 CANADA ACCESSORIES IN FLOW CYTOMETRY MARKET, BY PRODUCT, 2018-2032 (USD MILLION)
TABLE 77 CANADA ACCESSORIES IN FLOW CYTOMETRY MARKET, BY PRODUCT, 2018-2032 (VOLUME)
TABLE 78 CANADA ACCESSORIES IN FLOW CYTOMETRY MARKET, BY PRODUCT, 2018-2032 (ASP)
TABLE 79 CANADA FLOW CYTOMETRY MARKET, BY TECHNOLOGY, 2018-2032 (USD MILLION)
TABLE 80 CANADA CELL-BASED FLOW CYTOMETRY MARKET, BY TECHNOLOGY, 2018-2032 (USD MILLION)
TABLE 81 CANADA BEAD-BASED IN FLOW CYTOMETRY MARKET, BY TECHNOLOGY, 2018-2032 (USD MILLION)
TABLE 82 CANADA FLOW CYTOMETRY MARKET, BY APPLICATION, 2018-2032 (USD MILLION)
TABLE 83 CANADA RESEARCH APPLICATIONS IN FLOW CYTOMETRY MARKET, BY APPLICATION, 2018-2032 (USD MILLION)
TABLE 84 CANADA PHARMACEUTICAL AND BIOTECHNOLOGY IN FLOW CYTOMETRY MARKET, BY APPLICATION, 2018-2032 (USD MILLION)
TABLE 85 CANADA CLINICAL APPLICATIONS IN FLOW CYTOMETRY MARKET, BY APPLICATION, 2018-2032 (USD MILLION)
TABLE 86 CANADA FLOW CYTOMETRY MARKET, BY END USER, 2018-2032 (USD MILLION)
TABLE 87 CANADA FLOW CYTOMETRY MARKET, BY DISTRIBUTION CHANNEL, 2018-2032 (USD MILLION)
TABLE 88 CANADA RETAIL SALES IN FLOW CYTOMETRY MARKET, BY DISTRIBUTION CHANNEL, 2018-2032 (USD MILLION)
TABLE 89 MEXICO FLOW CYTOMETRY MARKET, BY PRODUCT, 2018-2032 (USD MILLION)
TABLE 90 MEXICO REAGENTS AND CONSUMABLES IN FLOW CYTOMETRY MARKET, BY PRODUCT, 2018-2032 (USD MILLION)
TABLE 91 MEXICO REAGENTS AND CONSUMABLES IN FLOW CYTOMETRY MARKET, BY PRODUCT, 2018-2032 (VOLUME)
TABLE 92 MEXICO REAGENTS AND CONSUMABLES IN FLOW CYTOMETRY MARKET, BY PRODUCT, 2018-2032 (ASP)
TABLE 93 MEXICO FLOW CYTOMETRY INSTRUMENTS IN FLOW CYTOMETRY MARKET, BY PRODUCT, 2018-2032 (USD MILLION)
TABLE 94 MEXICO CELL ANALYZERS IN FLOW CYTOMETRY MARKET, BY TYPE, 2018-2032 (USD MILLION)
TABLE 95 MEXICO CELL ANALYZERS IN FLOW CYTOMETRY MARKET, BY TYPE, 2018-2032 (VOLUME)
TABLE 96 MEXICO CELL ANALYZERS IN FLOW CYTOMETRY MARKET, BY TYPE, 2018-2032 (ASP)
TABLE 97 MEXICO CELL ANALYZERS IN FLOW CYTOMETRY MARKET, BY RANGE, 2018-2032 (USD MILLION)
TABLE 98 MEXICO CELL ANALYZERS IN FLOW CYTOMETRY MARKET, BY MODALITY, 2018-2032 (USD MILLION)
TABLE 99 MEXICO CELL ANALYZERS IN FLOW CYTOMETRY MARKET, BY MODALITY, 2018-2032 (VOLUME)
TABLE 100 MEXICO CELL ANALYZERS IN FLOW CYTOMETRY MARKET, BY MODALITY, 2018-2032 (ASP)
TABLE 101 MEXICO CELL SORTERS IN FLOW CYTOMETRY MARKET, BY MODALITY, 2018-2032 (USD MILLION)
TABLE 102 MEXICO CELL SORTERS IN FLOW CYTOMETRY MARKET, BY MODALITY, 2018-2032 (VOLUME)
TABLE 103 MEXICO CELL SORTERS IN FLOW CYTOMETRY MARKET, BY MODALITY, 2018-2032 (ASP)
TABLE 104 MEXICO CELL SORTERS IN FLOW CYTOMETRY MARKET, BY RANGE, 2018-2032 (USD MILLION)
TABLE 105 MEXICO CELL SORTERS IN FLOW CYTOMETRY MARKET, BY RANGE, 2018-2032 (VOLUME)
TABLE 106 MEXICO CELL SORTERS IN FLOW CYTOMETRY MARKET, BY RANGE, 2018-2032 (ASP)
TABLE 107 MEXICO ACCESSORIES IN FLOW CYTOMETRY MARKET, BY PRODUCT, 2018-2032 (USD MILLION)
TABLE 108 MEXICO ACCESSORIES IN FLOW CYTOMETRY MARKET, BY PRODUCT, 2018-2032 (VOLUME)
TABLE 109 MEXICO ACCESSORIES IN FLOW CYTOMETRY MARKET, BY PRODUCT, 2018-2032 (ASP)
TABLE 110 MEXICO FLOW CYTOMETRY MARKET, BY TECHNOLOGY, 2018-2032 (USD MILLION)
TABLE 111 MEXICO CELL-BASED FLOW CYTOMETRY MARKET, BY TECHNOLOGY, 2018-2032 (USD MILLION)
TABLE 112 MEXICO BEAD-BASED IN FLOW CYTOMETRY MARKET, BY TECHNOLOGY, 2018-2032 (USD MILLION)
TABLE 113 MEXICO FLOW CYTOMETRY MARKET, BY APPLICATION, 2018-2032 (USD MILLION)
TABLE 114 MEXICO RESEARCH APPLICATIONS IN FLOW CYTOMETRY MARKET, BY APPLICATION, 2018-2032 (USD MILLION)
TABLE 115 MEXICO PHARMACEUTICAL AND BIOTECHNOLOGY IN FLOW CYTOMETRY MARKET, BY APPLICATION, 2018-2032 (USD MILLION)
TABLE 116 MEXICO CLINICAL APPLICATIONS IN FLOW CYTOMETRY MARKET, BY APPLICATION, 2018-2032 (USD MILLION)
TABLE 117 MEXICO FLOW CYTOMETRY MARKET, BY END USER, 2018-2032 (USD MILLION)
TABLE 118 MEXICO FLOW CYTOMETRY MARKET, BY DISTRIBUTION CHANNEL, 2018-2032 (USD MILLION)
TABLE 119 MEXICO RETAIL SALES IN FLOW CYTOMETRY MARKET, BY DISTRIBUTION CHANNEL, 2018-2032 (USD MILLION)
List of Figure
FIGURE 1 NORTH AMERICA FLOW CYTOMETRY MARKET: SEGMENTATION
FIGURE 2 NORTH AMERICA FLOW CYTOMETRY MARKET: DATA TRIANGULATION
FIGURE 3 NORTH AMERICA FLOW CYTOMETRY MARKET: DROC ANALYSIS
FIGURE 4 NORTH AMERICA FLOW CYTOMETRY MARKET: COUNTRY-WISE MARKET ANALYSIS
FIGURE 5 NORTH AMERICA FLOW CYTOMETRY MARKET: COMPANY RESEARCH ANALYSIS
FIGURE 6 NORTH AMERICA FLOW CYTOMETRY MARKET: INTERVIEW DEMOGRAPHICS
FIGURE 7 NORTH AMERICA FLOW CYTOMETRY MARKET: DBMR MARKET POSITION GRID
FIGURE 8 NORTH AMERICA FLOW CYTOMETRY MARKET: VENDOR SHARE ANALYSIS
FIGURE 9 MARKET END USER COVERAGE GRID
FIGURE 10 NORTH AMERICA FLOW CYTOMETRY MARKET: SEGMENTATION
FIGURE 11 FIVE SEGMENTS COMPRISE THE NORTH AMERICA FLOW CYTOMETRY MARKET, BY PRODUCT
FIGURE 12 NORTH AMERICA FLOW CYTOMETRY MARKET EXECUTIVE SUMMARY
FIGURE 13 STRATEGIC DECISIONS
FIGURE 14 RISING PREVALENCE OF CHRONIC DISEASES IS DRIVING THE GROWTH OF THE NORTH AMERICA FLOW CYTOMETRY MARKET FROM 2025 TO 2032
FIGURE 15 THE REAGENTS AND CONSUMABLES SEGMENT IS EXPECTED TO ACCOUNT FOR THE LARGEST SHARE OF THE NORTH AMERICA FLOW CYTOMETRY MARKET IN 2025 AND 2032
FIGURE 16 DRIVERS, RESTRAINTS, OPPORTUNITIES, AND CHALLENGES OF THE NORTH AMERICA FLOW CYTOMETRY MARKET
FIGURE 17 NORTH AMERICA FLOW CYTOMETRY MARKET: BY PRODUCT, 2024
FIGURE 18 NORTH AMERICA FLOW CYTOMETRY MARKET: BY PRODUCT, 2025-2032 (USD MILLION)
FIGURE 19 NORTH AMERICA FLOW CYTOMETRY MARKET: BY PRODUCT, CAGR (2025-2032)
FIGURE 20 NORTH AMERICA FLOW CYTOMETRY MARKET: BY PRODUCT, LIFELINE CURVE
FIGURE 21 NORTH AMERICA FLOW CYTOMETRY MARKET: BY TECHNOLOGY, 2024
FIGURE 22 NORTH AMERICA FLOW CYTOMETRY MARKET: BY TECHNOLOGY, 2025-2032 (USD MILLION)
FIGURE 23 NORTH AMERICA FLOW CYTOMETRY MARKET: BY TECHNOLOGY, CAGR (2025-2032)
FIGURE 24 NORTH AMERICA FLOW CYTOMETRY MARKET: BY TECHNOLOGY, LIFELINE CURVE
FIGURE 25 NORTH AMERICA FLOW CYTOMETRY MARKET: BY APPLICATION, 2024
FIGURE 26 NORTH AMERICA FLOW CYTOMETRY MARKET: BY APPLICATION, 2025-2032 (USD MILLION)
FIGURE 27 NORTH AMERICA FLOW CYTOMETRY MARKET: BY APPLICATION, CAGR (2025-2032)
FIGURE 28 NORTH AMERICA FLOW CYTOMETRY MARKET: BY APPLICATION, LIFELINE CURVE
FIGURE 29 NORTH AMERICA FLOW CYTOMETRY MARKET: BY DISTRIBUTION CHANNEL, 2024
FIGURE 30 NORTH AMERICA FLOW CYTOMETRY MARKET: BY DISTRIBUTION CHANNEL, 2025-2032 (USD MILLION)
FIGURE 31 NORTH AMERICA FLOW CYTOMETRY MARKET: BY DISTRIBUTION CHANNEL, CAGR (2025-2032)
FIGURE 32 NORTH AMERICA FLOW CYTOMETRY MARKET: BY DISTRIBUTION CHANNEL, LIFELINE CURVE
FIGURE 33 NORTH AMERICA FLOW CYTOMETRY MARKET: BY END USER, 2024
FIGURE 34 NORTH AMERICA FLOW CYTOMETRY MARKET: BY END USER, 2025-2032 (USD MILLION)
FIGURE 35 NORTH AMERICA FLOW CYTOMETRY MARKET: BY END USER, CAGR (2025-2032)
FIGURE 36 NORTH AMERICA FLOW CYTOMETRY MARKET: BY END USER, LIFELINE CURVE
FIGURE 37 NORTH AMERICA FLOW CYTOMETRY MARKET: SNAPSHOT
FIGURE 38 NORTH AMERICA FLOW CYTOMETRY MARKET: COMPANY SHARE 2024 (%)
Data collection and base year analysis are done using data collection modules with large sample sizes. The stage includes obtaining market information or related data through various sources and strategies. It includes examining and planning all the data acquired from the past in advance. It likewise envelops the examination of information inconsistencies seen across different information sources. The market data is analysed and estimated using market statistical and coherent models. Also, market share analysis and key trend analysis are the major success factors in the market report. To know more, please request an analyst call or drop down your inquiry.
The key research methodology used by DBMR research team is data triangulation which involves data mining, analysis of the impact of data variables on the market and primary (industry expert) validation. Data models include Vendor Positioning Grid, Market Time Line Analysis, Market Overview and Guide, Company Positioning Grid, Patent Analysis, Pricing Analysis, Company Market Share Analysis, Standards of Measurement, Global versus Regional and Vendor Share Analysis. To know more about the research methodology, drop in an inquiry to speak to our industry experts.
Data Bridge Market Research is a leader in advanced formative research. We take pride in servicing our existing and new customers with data and analysis that match and suits their goal. The report can be customized to include price trend analysis of target brands understanding the market for additional countries (ask for the list of countries), clinical trial results data, literature review, refurbished market and product base analysis. Market analysis of target competitors can be analyzed from technology-based analysis to market portfolio strategies. We can add as many competitors that you require data about in the format and data style you are looking for. Our team of analysts can also provide you data in crude raw excel files pivot tables (Fact book) or can assist you in creating presentations from the data sets available in the report.


