
North America Hydrocarbon Solvents Market
Market Size in USD Billion
 USD
1.98 Billion
USD
5.62 Billion
2024
2040
USD
1.98 Billion
USD
5.62 Billion
2024
2040
| 2025 - 2040 | |
| USD 1.98 Billion | |
| USD 5.62 Billion | |
| % | |
Hydrocarbon Solvents Market Analysis
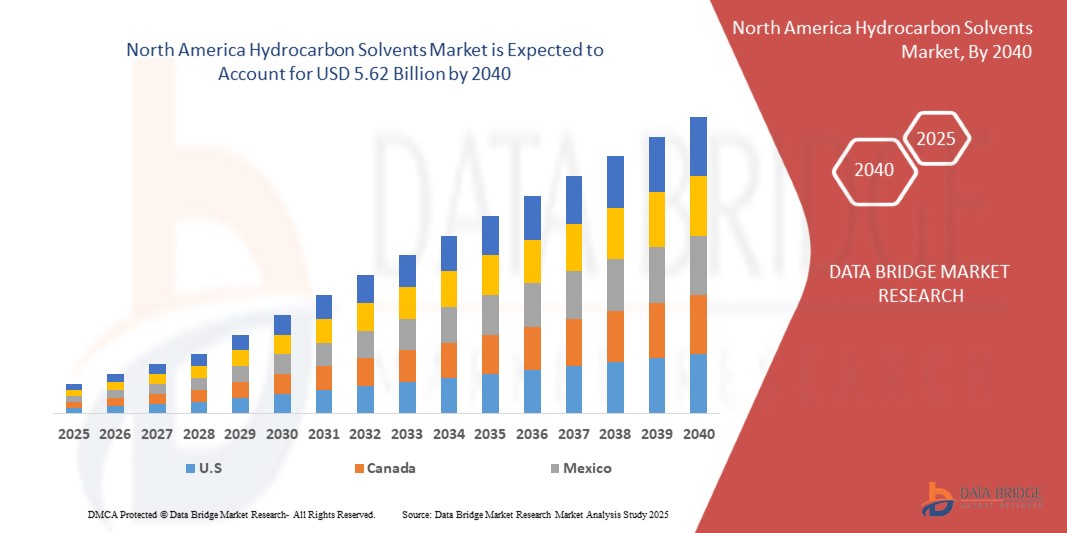
North America hydrocarbon solvents market has evolved significantly over the years, driven by the increasing demand for various industrial applications. In the early stages, hydrocarbon solvents were primarily used in industries such as automotive, construction, and cleaning, thanks to their effectiveness in dissolving a wide range of substances. Initially, these solvents were derived primarily from petroleum and natural gas, as they were cost-effective and readily available. In recent years, technological advancements have driven the market forward, with manufacturers focusing on improving solvent efficiency, reducing toxicity, and enhancing safety. As industrial cleaning applications and demand for solvents in sectors such as pharmaceuticals and paints continue to expand, the hydrocarbon solvent market remains an essential component of North America industrial processes, though it is evolving to address the growing emphasis on sustainability and environmental concerns
Hydrocarbon Solvents Market Size
North America hydrocarbon solvents market size was valued at USD 1.98 billion in 2024 and is projected to reach USD 5.62 billion by 2040, with a CAGR of 6.92% during the forecast period of 2024 to 2040. In addition to the insights on market scenarios such as market value, growth rate, segmentation, geographical coverage, and major players, the market reports curated by the Data Bridge Market Research also include import export analysis, production capacity overview, production consumption analysis, price trend analysis, climate change scenario, supply chain analysis, value chain analysis, raw material/consumables overview, vendor selection criteria, PESTLE Analysis, Porter Analysis, and regulatory framework.
Hydrocarbon Solvents Market
“Growing Demand For Hydrocarbon Solvents From End-Use Industries”
The hydrocarbon solvents market is experiencing robust growth, largely driven by the rising demand from various end-use industries such as paints and coatings, automotive, electronics, cleaning products, and construction. These sectors rely extensively on hydrocarbon solvents for a range of critical applications, including degreasing, cleaning, coating, and thinning. In the paints and coatings industry, hydrocarbon solvents are indispensable in formulating paints, varnishes, and other coatings, as they help adjust viscosity and aid in the smooth application of these products. As the construction and infrastructure sectors expand, particularly in emerging markets, the demand for paints and coatings increases, which in turn drives the demand for hydrocarbon solvents. Moreover, the automotive sector relies heavily on hydrocarbon solvents for applications such as surface cleaning, paint formulations, and degreasing of vehicle parts during manufacturing and maintenance. As automotive production ramps up North Americaly, especially in emerging economies, the need for hydrocarbon solvents in the automotive industry remains high. Whereas, the electronics sector also significantly contributes to the demand for hydrocarbon solvents, as they are used for the precision cleaning of electronic components and circuits. With the ongoing advancements in technology and the rise of smart devices, there is a constant need for solvent-based cleaning solutions in the electronics industry.
Report Scope and Market Segmentation
|
Attributes |
Hydrocarbon Solvents Ingredients Key Market Insights |
|
Segments Covered |
|
|
Countries Covered |
U.S., Canada, and Mexico |
|
Key Market Players |
Exxon Mobil Corporation (U.S.), BASF (Germany), TotalEnergies (France), Shell plc (U.K.), Chevron Phillips Chemical Company LLC (U.S.), China Petrochemical Corporation (China), ADNOC (U.A.E.), SASOL (South Africa), Eastman Chemical Company (U.S.), ENGEN PETROLEUM LTD (South Africa), Ashland (U.S.), Reliance Industries Limited. (India), Honeywell International Inc (U.S.), LyondellBasell Industries Holdings B.V. (Netherlands), BP p.l.c. (U.K.), Calumet, Inc. (U.S.), Braskem (Brazil), Haltermann Carless Group GmbH (Germany), Neste (Finland), LANXESS (Germany), RB PRODUCTS INC. (U.S.), Gulf Chemical & industrial Oils (Saudi Arabia), Jun Yuan Petroleum Group (China), Halton Chemical Inc. (U.S.), Avani Petrochem Pvt. Ltd. (India), and Gotham Industries (U.S.) |
|
Market Opportunities |
|
|
Value Added Data Infosets |
In addition to the insights on market scenarios such as market value, growth rate, segmentation, geographical coverage, and major players, the market reports curated by the Data Bridge Market Research also include import export analysis, production capacity overview, production consumption analysis, price trend analysis, climate change scenario, supply chain analysis, value chain analysis, raw material/consumables overview, vendor selection criteria, PESTLE Analysis, Porter Analysis, and regulatory framework. |
Hydrocarbon Solvents Market Definition
A hydrocarbon solvent is a type of solvent derived from hydrocarbons, which are organic compounds made up of hydrogen and carbon atoms. These solvents are typically used to dissolve or dilute substances and can be classified into aliphatic (linear or branched chain) or aromatic (ring-shaped) hydrocarbons. Common examples include gasoline, kerosene, paint thinners, and mineral spirits. Hydrocarbon solvents are widely used in industries such as painting, cleaning, and manufacturing.
Biochar Market Dynamics
Drivers
- Fast Expanding Construction And Automotive Sectors
The construction and automotive sectors are two of the fastest-growing industries North Americaly, significantly driving the demand for hydrocarbon solvents. These sectors rely heavily on various solvents for applications such as coatings, cleaning, degreasing, and paint formulations, all of which are essential in ensuring efficiency, quality, and durability in production processes. As these industries continue to expand, the demand for hydrocarbon solvents is expected to rise proportionally.
In the construction industry, hydrocarbon solvents are crucial for the formulation of paints and coatings used in buildings, infrastructure projects, and other construction works. Solvents help in controlling the viscosity of these materials, ensuring smooth application and improving the finish of surfaces. With rapid urbanization and infrastructure development, particularly in emerging markets such as Asia-Pacific and Africa, the demand for construction-related materials, including paints and coatings, is surging. This, in turn, drives the need for hydrocarbon solvents, which are an essential component of these products.
- Rising Demand For Industrial Cleaning Agents
As industries across the globe focus on improving cleaning efficiency, maintaining equipment, and ensuring workplace safety, hydrocarbon solvents have become integral to various cleaning and degreasing applications. These solvents are widely used in cleaning machinery, tools, parts, and surfaces that require precise and effective removal of oils, grease, dirt, and other contaminants. The manufacturing sector, particularly in industries such as automotive, aerospace, electronics, and heavy machinery, heavily relies on industrial cleaning solutions to maintain high operational standards and prevent equipment failure due to the accumulation of contaminants. Hydrocarbon solvents offer superior cleaning properties, ensuring that critical machinery and equipment operate efficiently and safely. With industries expanding, the need for cleaning agents to remove industrial residues and ensure smooth production processes is increasing, which in turn boosts the demand for hydrocarbon solvents.
For instance, In November 2023, according to Cleanfax, the future of the cleaning industry is shaped by innovation, cleaning for health, sustainability, and diversity initiatives. Advancements in AI, robotics, and safer chemistry will revolutionize operations. Sustainability trends emphasize eco-friendly products and practices. As health consciousness rises, cleaning standards will evolve, ensuring safer, more efficient solutions across sectors
Opportunities
- Growing Demand For Green And Bio-Based Solvents
As environmental concerns intensify and industries face mounting pressure to reduce their carbon footprint, the transition towards more sustainable solutions has become crucial. Green and bio-based solvents, derived from renewable sources such as plants, agricultural by-products, and waste biomass, are seen as viable alternatives to traditional petroleum-based solvents, which are often associated with environmental pollution and health hazards.
One of the primary drivers of this shift is the growing regulatory framework and policies aimed at reducing harmful emissions and promoting sustainability. Governments worldwide are implementing stricter regulations on the use of Volatile Organic Compounds (VOCs) in products such as paints, coatings, adhesives, and cleaning agents. As a result, industries are increasingly adopting bio-based solvents that emit fewer VOCs, offering an eco-friendly and safer alternative. For instance, solvents derived from renewable resources such as ethanol, d-limonene, and turpentine are gaining traction in industries such as paints and coatings, automotive, and pharmaceuticals.
- Technological Advancements And Innovations In Solvent Blends
Technological advancements and innovations in solvent blends present a significant opportunity for the North America hydrocarbon solvents market. As industries continue to prioritize efficiency, sustainability, and cost-effectiveness, the development of new and improved solvent blends has become a key area of focus. These advancements not only enhance the performance of solvents but also meet the evolving regulatory requirements, driving demand for more efficient and eco-friendly solutions.
Innovations in solvent blends have led to the creation of highly specialized formulations that offer improved solvency power, lower volatility, and enhanced safety profiles. These customized blends cater to a wide range of industries, including coatings, pharmaceuticals, chemicals, and cleaning products, ensuring optimized performance in various applications. In addition, advancements in solvent recovery technologies have allowed for more efficient use of solvent blends, reducing waste and improving sustainability efforts. Furthermore, the ongoing development of green solvents—blends derived from renewable resources or with lower environmental impact—has positioned the market to meet increasing regulatory pressures. These innovations offer the advantage of maintaining or even enhancing the effectiveness of traditional hydrocarbon-based solvents while reducing harmful emissions and toxic byproducts. The demand for these innovative blends is growing, particularly in industries that are under stringent environmental regulations.
Restraints/Challenges
- Stiff Competition From Alternative Solvents
As environmental concerns grow and regulatory standards become more stringent, the demand for more sustainable and eco-friendly solvents is increasing. Hydrocarbon solvents, which are derived primarily from petroleum, have long been favored for their versatility and cost-effectiveness in various industrial applications, including in the production of paints, coatings, pharmaceuticals, and cleaning products. However, their environmental impact, particularly in terms of greenhouse gas emissions and pollution, has led to increasing scrutiny from governments, environmental organizations, and consumers.
Alternative solvents, including bio-based, water-based, and ionic solvents, are gaining traction as cleaner and greener substitutes for hydrocarbon-based options. These alternatives are often perceived as safer for both human health and the environment, with advantages such as lower toxicity, reduced volatility, and better biodegradability. As a result, industries that have traditionally relied on hydrocarbon solvents are increasingly exploring and adopting these alternatives to align with sustainability goals and regulatory requirements.
- Health Hazards And Toxicity Issues For Workers
Hydrocarbon solvents, commonly used in industries such as pharmaceuticals, paints, and coatings, contain chemical compounds that can be harmful to workers exposed to them. Many of these solvents are volatile and may cause respiratory problems, skin irritation, headaches, dizziness, and other acute symptoms when inhaled or absorbed through the skin. Prolonged exposure to high concentrations of these solvents can lead to chronic health issues, including liver and kidney damage, nervous system disorders, and even cancer.
Regulations regarding worker safety have become increasingly stringent, requiring businesses to implement measures such as protective equipment, proper ventilation, and regular health monitoring. However, these measures often incur additional costs, making it challenging for companies to maintain compliance while remaining competitive in the market. As awareness of occupational health risks grows, workers, labor unions, and health organizations are pressuring companies to adopt safer practices and minimize their reliance on harmful solvents. Moreover, the growing concern over the environmental and health impacts of hydrocarbon solvents is leading to increased scrutiny from regulatory bodies. Governments are enforcing stricter regulations, including limits on solvent emissions, stricter labeling requirements, and guidelines for waste disposal, all of which contribute to increased operational costs for manufacturers.
Impact and Current Market Scenario of Raw Material Shortage and Shipping Delays
Data Bridge Market Research offers a high-level analysis of the market and delivers information by keeping in account the impact and current market environment of raw material shortage and shipping delays. This translates into assessing strategic possibilities, creating effective action plans, and assisting businesses in making important decisions.
Apart from the standard report, we also offer in-depth analysis of the procurement level from forecasted shipping delays, distributor mapping by region, commodity analysis, production analysis, price mapping trends, sourcing, category performance analysis, supply chain risk management solutions, advanced benchmarking, and other services for procurement and strategic support.
Expected Impact of Economic Slowdown on the Pricing and Availability of Products
When economic activity slows, industries begin to suffer. The forecasted effects of the economic downturn on the pricing and accessibility of the products are taken into account in the market insight reports and intelligence services provided by DBMR. With this, our clients can typically keep one step ahead of their competitors, project their sales and revenue, and estimate their profit and loss expenditures.
North America Hydrocarbon Solvents Market Scope
The North America long-chain polyamide market is segmented into five notable segments based on type, source, form, application and end-use. The growth amongst these segments will help you analyze meagre growth segments in the industries and provide the users with a valuable market overview and market insights to help them make strategic decisions for identifying core market applications.
Type
- Aromatic Solvents
- Aromatic Solvents, By Type
- Toluene
- Xylene
- Xylene, By Type
- Mixed Xylene
- Para Xylene
- Xylene, By Type
- Naphthalene
- Benzene
- Ethylbenzene
- Cumene
- Others
- Aromatic Solvents, By Type
- Aliphatic Solvents
- Aliphatic Solvents, By Type
- Mineral Spirits or White Spirits
- Varnish Makers & Painters Naphtha
- Hexane
- Heptane
- Paraffinic Solvents
- Kerosene
- Pentane
- Others
- Aliphatic Solvents, By Type
- Mineral Oils
- Cycloaliphatic Solvents
- Cycloaliphatic Solvents, By Type
- Cyclohexane
- Methylcyclohexane
- Decalin (Decahydronaphthalene)
- Others
- Cycloaliphatic Solvents, By Type
- Others
Application
- Paints and Coatings
- Paints and Coatings, By Type
- Aliphatic Solvents
- Aromatic Solvents
- Cycloaliphatic Solvents
- Mineral Oils
- Others
- Paints and Coatings, By Type
- Adhesives
- Adhesives, By Type
- Aromatic Solvents
- Aliphatic Solvents
- Cycloaliphatic Solvents
- Mineral Oils
- Others
- Adhesives, By Type
- Pharmaceutical
- Pharmaceutical, By Type
- Aliphatic Solvents
- Mineral Oils
- Aromatic Solvents
- Cycloaliphatic Solvents
- Others
- Pharmaceutical, By Type
- Cleaning and Degreasing
- Cleaning and Degreasing, By Type
- Aliphatic Solvents
- Aromatic Solvents
- Cycloaliphatic Solvents
- Mineral Oils
- Others
- Cleaning and Degreasing, By Type
- Printing Inks
- Printing Inks, Type
- Aromatic Solvents
- Aliphatic Solvents
- Cycloaliphatic Solvents
- Mineral Oils
- Others
- Printing Inks, Type
- Agriculture
- Agriculture, By Type
- Aromatic Solvents
- Aliphatic Solvents
- Mineral Oils
- Cycloaliphatic Solvents
- Others
- Agriculture, By Type
- Rubber and Polymers
- Rubber and Polymers, By Type
- Aromatic Solvents
- Aliphatic Solvents
- Cycloaliphatic Solvents
- Mineral Oils
- Others
- Rubber and Polymers, By Type
- Chemicals
- Chemicals, By Type
- Aromatic Solvents
- Aliphatic Solvents
- Cycloaliphatic Solvents
- Mineral Oils
- Others
- Chemicals, By Type
- Aerosols
- Aerosols, By Type
- Aliphatic Solvents
- Aromatic Solvents
- Cycloaliphatic Solvents
- Mineral Oils
- Others
- Aerosols, By Type
- Cosmetics
- Cosmetics, By Type
- Mineral Oils
- Aliphatic Solvents
- Cycloaliphatic Solvents
- Aromatic Solvents
- Others
- Cosmetics, By Type
- Drilling Fluids
- Drilling Fluids, By Type
- Mineral Oils
- Aliphatic Solvents
- Cycloaliphatic Solvents
- Aromatic Solvents
- Others
- Drilling Fluids, By Type
- Fluxes For Bitumen
- Fluxes For Bitumen, By Type
- Aliphatic Solvents
- Aromatic Solvents
- Mineral Oils
- Cycloaliphatic Solvents
- Others
- Fluxes For Bitumen, By Type
- Metal Extraction
- Metal Extraction, By Type
- Aromatic Solvents
- Aliphatic Solvents
- Cycloaliphatic Solvents
- Mineral Oils
- Others
- Metal Extraction, By Type
- Metal Working Lubricant
- Metal Working Lubricant, By Type
- Mineral Oils
- Aliphatic Solvents
- Cycloaliphatic Solvents
- Aromatic Solvents
- Others
- Metal Working Lubricant, By Type
- Sealants
- Sealants, By Type
- Aliphatic Solvents
- Aromatic Solvents
- Cycloaliphatic Solvents
- Mineral Oils
- Others
- Sealants, By Type
- Explosives
- Explosives, By Application
- Aromatic Solvents
- Aliphatic Solvents
- Cycloaliphatic Solvents
- Mineral Oils
- Others
- Explosives, By Application
- Others
- Others, By Type
- Aromatic Solvents
- Aliphatic Solvents
- Cycloaliphatic Solvents
- Mineral Oils
- Others
- Others, By Type
North America Hydrocarbon Solvents Market Regional Analysis
The market is analyzed and market size insights and trends are provided by country, type and application as referenced above.
The countries covered in the market are U.S., Canada, and Mexico.
U.S. is expected to dominate the hydrocarbon solvents market due to advanced technological innovation, strong Paints and Coatings industries, a focus on sustainability, and high demand for high-performance materials in various applications.
The country section of the report also provides individual market impacting factors and changes in regulation in the market domestically that impacts the current and future trends of the market. Data points such as down-stream and upstream value chain analysis, technical trends and porter's five forces analysis, case studies are some of the pointers used to forecast the market scenario for individual countries. Also, the presence and availability of North America brands and their challenges faced due to large or scarce competition from local and domestic brands, impact of domestic tariffs and trade routes are considered while providing forecast analysis of the country data.
North America Hydrocarbon Solvents Market Share
The market competitive landscape provides details by competitors. Details included are company overview, company financials, revenue generated, market potential, investment in research and development, new market initiatives, North America presence, production sites and facilities, production capacities, company strengths and weaknesses, product launch, product width and breadth, application dominance. The above data points provided are only related to the companies' focus related to market.
North America Hydrocarbon Solvents Market Leaders Operating in the Market Are:
- Exxon Mobil Corporation (U.S.)
- BASF (Germany)
- TotalEnergies (France)
- Shell plc (U.K.)
- Chevron Phillips Chemical Company LLC (U.S.)
- China Petrochemical Corporation (China)
- ADNOC (U.A.E.)
- SASOL (South Africa)
- Eastman Chemical Company (U.S.)
- ENGEN PETROLEUM LTD (South Africa)
- Ashland (U.S.)
- Reliance Industries Limited. (India)
- Honeywell International Inc (U.S.)
- LyondellBasell Industries Holdings B.V. (Netherlands)
- BP p.l.c. (U.K.)
- Calumet, Inc. (U.S.)
- Braskem (Brazil)
- Haltermann Carless Group GmbH (Germany)
- Neste (Finland)
- LANXESS (Germany)
- RB PRODUCTS INC. (U.S.)
- Gulf Chemical & industrial Oils (Saudi Arabia)
- Jun Yuan Petroleum Group (China)
- Halton Chemical Inc. (U.S.)
- Avani Petrochem Pvt. Ltd. (India)
- Gotham Industries (U.S.)
Latest Developments in North America Hydrocarbon Solvents Market
- In November 2023, Shell Chemicals was honored as a winner in BNSF’s 2023 Sustainability Awards program. Alongside nine other recipients, Shell Chemicals received this recognition from BNSF, a prominent North American freight transportation company, for its advancements in sustainable solutions throughout the year
- In February 2023, Oil and Natural Gas Corporation Limited (ONGC) and BP p.l.c. signed a Memorandum of Understanding (MoU) to explore collaboration in oil and gas exploration and production, trading, and other energy vectors both in India and internationally. The agreement, signed in New Delhi on the eve of India Energy Week, was attended by key dignitaries, including Honourable Minister of Petroleum and Natural Gas, Shri Hardeep Singh Puri, Secretary, Ministry of Petroleum and Natural Gas, Shri Pankaj Jain, ONGC’s Chairman and CEO, Shri Arun Kumar Singh, and bp’s Executive Vice President, William Lin, alongside senior leadership from both organizations
- In July 2024, Calumet Specialty Products Partners, L.P. completed its conversion to a C-Corporation, transforming into Calumet, Inc. This shift enables broader institutional investment, attracting passive indices that typically own large stakes in C-Corps. The change is expected to enhance shareholder growth, capitalize on new capital opportunities, and further drive Calumet's transformation in the specialty products and renewables markets
- In December 2024, China Petrochemical Corporation was honored at the Hong Kong International Finance Week (IFW) and the Golden Bauhinia Awards, receiving the Best Business Contributor to the 75th Anniversary of the Founding of the People’s Republic of China and Excellent Listed Company in Investor Relations Management awards. Chairman Mr. MA Yongsheng was recognized as Economic Figure of the Year, while Mr. HUANG Wensheng, Vice President and Board Secretary, won Excellent Board Secretary
SKU-

- Interactive Data Analysis Dashboard
- Company Analysis Dashboard for high growth potential opportunities
- Research Analyst Access for customization & queries
- Competitor Analysis with Interactive dashboard
- Latest News, Updates & Trend analysis
- Harness the Power of Benchmark Analysis for Comprehensive Competitor Tracking
Table of Content
1 INTRODUCTION
1.1 OBJECTIVES OF THE STUDY
1.2 MARKET DEFINITION
1.3 OVERVIEW
1.4 LIMITATIONS
1.5 MARKETS COVERED
2 MARKET SEGMENTATION
2.1 MARKETS COVERED
2.2 GEOGRAPHICAL SCOPE
2.3 YEARS CONSIDERED FOR THE STUDY
2.4 CURRENCY AND PRICING
2.5 DBMR TRIPOD DATA VALIDATION MODEL
2.6 MULTIVARIATE MODELING
2.7 PRIMARY INTERVIEWS WITH KEY OPINION LEADERS
2.8 DBMR MARKET POSITION GRID
2.9 DBMR VENDOR SHARE ANALYSIS
2.1 MARKET APPLICATION COVERAGE GRID
2.11 SECONDARY SOURCES
2.12 ASSUMPTIONS
3 EXECUTIVE SUMMARY
4 PREMIUM INSIGHTS
4.1 PESTEL ANALYSIS
4.1.1 POLITICAL FACTORS
4.1.2 ECONOMIC FACTORS
4.1.3 SOCIAL FACTORS
4.1.4 TECHNOLOGICAL FACTORS
4.1.5 ENVIRONMENTAL FACTORS
4.1.6 LEGAL FACTORS
4.2 PORTER’S FIVE FORCES
4.2.1 THREAT OF NEW ENTRANTS
4.2.2 BARGAINING POWER OF SUPPLIERS
4.2.3 BARGAINING POWER OF BUYERS
4.2.4 THREAT OF SUBSTITUTES
4.2.5 INDUSTRY RIVALRY
4.3 PRICING ANALYSIS
4.4 PRODUCTION CAPACITY OF KEY MANUFACTURERS
4.5 IMPORT EXPORT SCENARIO
4.6 PRODUCTION CONSUMPTION ANALYSIS
4.7 CLIMATE CHANGE SCENARIO
4.7.1 ENVIRONMENTAL CONCERNS
4.7.2 INDUSTRY RESPONSE
4.7.3 GOVERNMENT’S ROLE
4.7.4 ANALYST RECOMMENDATIONS
4.8 VENDOR SELECTION CRITERIA
4.9 DETAILED OVERVIEW OF THE COMPOSITION AND CHARACTERISTICS OF HYDROCARBON SOLVENTS
4.9.1 ALIPHATIC HYDROCARBONS
4.9.1.1 MINERAL SPIRITS / WHITE SPIRIT
4.9.1.2 PARAFFINIC SOLVENTS
4.9.2 MINERAL OIL (WHITE OIL)
4.9.3 AROMATIC SOLVENTS
4.9.4 CYCLOALIPHATIC SOLVENTS
4.9.5 GENERAL CONSIDERATIONS
4.1 PRICE INFORMATION OF SUB-PRODUCTS
4.10.1 NAPTHA
4.10.1.1 FACTORS AFFECTING PRICE MOVEMENTS
4.10.2 TOLUENE
4.10.2.1 FACTORS AFFECTING PRICE MOVEMENTS
4.10.3 XYLENE
4.10.3.1 FACTORS AFFECTING PRICE MOVEMENTS
4.10.4 XYLENE
4.10.4.1 FACTORS AFFECTING PRICE MOVEMENTS
4.11 RAW MATERIAL COVERAGE
4.11.1 PETROLEUM-BASED RAW MATERIALS
4.11.2 NATURAL GAS-DERIVED RAW MATERIALS
4.11.3 RENEWABLE FEEDSTOCKS: BIO-BASED HYDROCARBONS
4.11.4 RECYCLED SOLVENTS
4.11.5 SYNTHETIC HYDROCARBONS
4.12 SOURCES OF HYDROCARBON SOLVENT STREAMS: REFINERY VS. PETROCHEMICAL
4.12.1 REFINERY STREAMS
4.12.2 PETROCHEMICAL STREAMS
4.12.3 KEY DIFFERENCES BETWEEN REFINERY AND PETROCHEMICAL STREAMS
4.12.4 EXAMPLES OF HYDROCARBON STREAMS AND THEIR USE IN SOLVENT PRODUCTION
4.12.5 CONCLUSION
4.13 SUPPLY CHAIN ANALYSIS
4.13.1 OVERVIEW
4.13.2 LOGISTIC COST SCENARIO
4.13.3 IMPORTANCE OF LOGISTICS SERVICE PROVIDERS
4.14 TECHNOLOGICAL ADVANCEMENTS
4.14.1 DEVELOPMENT OF LOW-VOC AND NON-VOC SOLVENTS
4.14.2 BIO-BASED HYDROCARBON SOLVENTS
4.14.3 SOLVENT BLENDS FOR IMPROVED EFFICIENCY
4.14.4 ADVANCED PURIFICATION AND RECYCLING TECHNIQUES
4.14.5 INNOVATION IN PACKAGING AND SAFETY
4.14.6 DIGITALIZATION AND SMART SOLVENT SYSTEMS
4.14.7 CONCLUSION
5 REGULATORY COVERAGE
6 MARKET OVERVIEW
6.1 DRIVERS
6.1.1 GROWING DEMAND FOR HYDROCARBON SOLVENTS FROM END-USE INDUSTRIES
6.1.2 FAST EXPANDING CONSTRUCTION AND AUTOMOTIVE SECTORS
6.1.3 RISING DEMAND FOR INDUSTRIAL CLEANING AGENTS
6.1.4 INCREASING USE OF HYDROCARBON SOLVENTS IN OIL AND GAS
6.2 RESTRAINTS
6.2.1 STRICT REGULATIONS ON VOLATILE ORGANIC COMPOUNDS EMISSIONS AND SOLVENT DISPOSAL
6.2.2 VOLATILITY IN RAW MATERIAL PRICES
6.3 OPPORTUNITIES
6.3.1 GROWING DEMAND FOR GREEN AND BIO-BASED SOLVENTS
6.3.2 TECHNOLOGICAL ADVANCEMENTS AND INNOVATIONS IN SOLVENT BLENDS
6.3.3 INCREASING APPLICATIONS IN PHARMACEUTICALS AND PERSONAL CARE
6.4 CHALLENGES
6.4.1 STIFF COMPETITION FROM ALTERNATIVE SOLVENTS
6.4.2 HEALTH HAZARDS AND TOXICITY ISSUES FOR WORKERS
7 NORTH AMERICA HYDROCARBON SOLVENTS MARKET, BY TYPE
7.1 OVERVIEW
7.2 AROMATIC SOLVENTS
7.3 ALIPHATIC SOLVENTS
7.4 MINERAL OILS
7.5 CYCLOALIPHATIC SOLVENTS
7.6 OTHERS
8 NORTH AMERICA HYDROCARBON SOLVENTS MARKET, BY APPLICATION
8.1 OVERVIEW
8.2 PAINTS AND COATINGS
8.3 ADHESIVES
8.4 PHARMACEUTICAL
8.5 CLEANING AND DEGREASING
8.6 PRINTING INKS
8.7 AGRICULTURE
8.8 RUBBER AND POLYMERS
8.9 CHEMICALS
8.1 AEROSOLS
8.11 COSMETICS
8.12 DRILLING FLUIDS
8.13 FLUXES FOR BITUMEN
8.14 METAL EXTRACTION
8.15 METAL WORKING LUBRICANT
8.16 SEALANTS
8.17 EXPLOSIVES
8.18 OTHERS
9 NORTH AMERICA HYDROCARBON SOLVENTS MARKET, BY REGION
9.1 NORTH AMERICA
9.1.1 U.S.
9.1.2 CANADA
9.1.3 MEXICO
10 NORTH AMERICA HYDROCARBON SOLVENTS MARKET: COMPANY LANDSCAPE
10.1 COMPANY SHARE ANALYSIS: NORTH AMERICA
11 SWOT ANALYSIS
12 COMPANY PROFILES
12.1 EXXON MOBIL CORPORATION
12.1.1 COMPANY SNAPSHOT
12.1.2 REVENUE ANALYSIS
12.1.3 COMPANY SHARE ANALYSIS
12.1.4 PRODUCT PORTFOLIO
12.1.5 RECENT DEVELOPMENT
12.2 BASF
12.2.1 COMPANY SNAPSHOT
12.2.2 REVENUE ANALYSIS
12.2.3 COMPANY SHARE ANALYSIS
12.2.4 PRODUCT PORTFOLIO
12.2.5 RECENT DEVELOPMENT
12.3 TOTALENERGIES
12.3.1 COMPANY SNAPSHOT
12.3.2 REVENUE ANALYSIS
12.3.3 COMPANY SHARE ANALYSIS
12.3.4 PRODUCT PORTFOLIO
12.3.5 RECENT DEVELOPMENT
12.4 SHELL PLC
12.4.1 COMPANY SNAPSHOT
12.4.2 REVENUE ANALYSIS
12.4.3 COMPANY SHARE ANALYSIS
12.4.4 PRODUCT PORTFOLIO
12.4.5 RECENT DEVELOPMENT/NEWS
12.5 CHEVRON PHILLIPS CHEMICAL COMPANY LLC
12.5.1 COMPANY SNAPSHOT
12.5.2 COMPANY SHARE ANALYSIS
12.5.3 PRODUCT PORTFOLIO
12.5.4 RECENT DEVELOPMENT/NEWS
12.6 ADNOC
12.6.1 COMPANY SNAPSHOT
12.6.2 PRODUCT PORTFOLIO
12.6.3 RECENT DEVELOPMENT
12.7 ASHLAND
12.7.1 COMPANY SNAPSHOT
12.7.2 REVENUE ANALYSIS
12.7.3 PRODUCT PORTFOLIO
12.7.4 RECENT DEVELOPMENT
12.8 AVANI PETROCHEM PVT. LTD.
12.8.1 COMPANY SNAPSHOT
12.8.2 PRODUCT PORTFOLIO
12.8.3 RECENT DEVELOPMENT
12.9 BP P.L.C.
12.9.1 COMPANY SNAPSHOT
12.9.2 REVENUE ANALYSIS
12.9.3 PRODUCT PORTFOLIO
12.9.4 RECENT DEVELOPMENT
12.1 BRASKEM
12.10.1 COMPANY SNAPSHOT
12.10.2 REVENUE ANALYSIS
12.10.3 PRODUCT PORTFOLIO
12.10.4 RECENT DEVELOPMENT
12.11 CALUMET, INC.
12.11.1 COMPANY SNAPSHOT
12.11.2 REVENUE ANALYSIS
12.11.3 PRODUCT PORTFOLIO
12.11.4 RECENT DEVELOPMENT
12.12 CHINA PETROCHEMICAL CORPORATION
12.12.1 COMPANY SNAPSHOT
12.12.2 REVENUE ANALYSIS
12.12.3 PRODUCT PORTFOLIO
12.12.4 RECENT DEVELOPMENT/NEWS
12.13 EASTMAN CHEMICAL COMPANY
12.13.1 COMPANY SNAPSHOT
12.13.2 REVENUE ANALYSIS
12.13.3 PRODUCT PORTFOLIO
12.13.4 RECENT DEVELOPMENT
12.14 ENGEN PETROLEUM LTD
12.14.1 COMPANY SNAPSHOT
12.14.2 PRODUCT PORTFOLIO
12.14.3 RECENT DEVELOPMENT
12.15 GOTHAM INDUSTRIES
12.15.1 COMPANY SNAPSHOT
12.15.2 PRODUCT PORTFOLIO
12.15.3 RECENT DEVELOPMENT
12.16 GULF CHEMICAL & INDUSTRAL OILS
12.16.1 COMPANY SNAPSHOT
12.16.2 PRODUCT PORTFOLIO
12.16.3 RECENT DEVELOPMENT
12.17 HALTERMANN CARLESS GROUP GMBH
12.17.1 COMPANY SNAPSHOT
12.17.2 PRODUCT PORTFOLIO
12.17.3 RECENT DEVELOPMENT/NEWS
12.18 HALTON CHEMICAL INC.
12.18.1 COMPANY SNAPSHOT
12.18.2 PRODUCT PORTFOLIO
12.18.3 RECENT DEVELOPMENT
12.19 HONEYWELL INTERNATIONAL INC
12.19.1 COMPANY SNAPSHOT
12.19.2 REVENUE ANALYSIS
12.19.3 PRODUCT PORTFOLIO
12.19.4 RECENT DEVELOPMENT
12.2 JUN YUAN PETROLEUM GROUP
12.20.1 COMPANY SNAPSHOT
12.20.2 PRODUCT PORTFOLIO
12.20.3 RECENT DEVELOPMENT
12.21 LANXESS
12.21.1 COMPANY SNAPSHOT
12.21.2 REVENUE ANALYSIS
12.21.3 PRODUCT PORTFOLIO
12.21.4 RECENT DEVELOPMENT
12.22 LYONDELLBASELL INDUSTRIES HOLDING B.V.
12.22.1 COMPANY SNAPSHOT
12.22.2 REVENUE ANALYSIS
12.22.3 PRODUCT PORTFOLIO
12.22.4 RECENT DEVELOPMENT
12.23 NESTE
12.23.1 COMPANY SNAPSHOT
12.23.2 REVENUE ANALYSIS
12.23.3 PRODUCT PORTFOLIO
12.23.4 RECENT DEVELOPMENT
12.24 RB PRODUCTS, INC.
12.24.1 COMPANY SNAPSHOT
12.24.2 PRODUCT PORTFOLIO
12.24.3 RECENT DEVELOPMENT
12.25 RELIANCE INDUSTRIES LIMITED
12.25.1 COMPANY SNAPSHOT
12.25.2 REVENUE ANALYSIS
12.25.3 PRODUCT PORTFOLIO
12.25.4 RECENT DEVELOPMENT
12.26 SASOL
12.26.1 COMPANY SNAPSHOT
12.26.2 REVENUE ANALYSIS
12.26.3 PRODUCT PORTFOLIO
12.26.4 RECENT DEVELOPMENT
13 QUESTIONNAIRE
14 RELATED REPORTSR
List of Table
TABLE 1 PRODUCTION CAPACITY OF KEY MANUFACTURERS
TABLE 2 REGULATORY COVERAGE
TABLE 3 NORTH AMERICA HYDROCARBON SOLVENTS MARKET, BY TYPE, 2018-2040 (USD THOUSAND)
TABLE 4 NORTH AMERICA AROMATIC SOLVENTS IN HYDROCARBON SOLVENTS MARKET, BY REGION, 2018-2040 (USD THOUSAND)
TABLE 5 NORTH AMERICA AROMATIC SOLVENTS IN HYDROCARBON SOLVENTS MARKET, BY TYPE, 2018-2040 (USD THOUSAND)
TABLE 6 NORTH AMERICA XYLENE IN HYDROCARBON SOLVENTS MARKET, BY TYPE, 2018-2040 (USD THOUSAND)
TABLE 7 NORTH AMERICA ALIPHATIC SOLVENTS IN HYDROCARBON SOLVENTS MARKET, BY REGION, 2018-2040 (USD THOUSAND)
TABLE 8 NORTH AMERICA ALIPHATIC SOLVENTS IN HYDROCARBON SOLVENTS MARKET, BY TYPE, 2018-2040 (USD THOUSAND)
TABLE 9 NORTH AMERICA MINERAL OILS IN HYDROCARBON SOLVENTS MARKET, BY REGION, 2018-2040 (USD THOUSAND)
TABLE 10 NORTH AMERICA CYCLOALIPHATIC SOLVENTS IN HYDROCARBON SOLVENTS MARKET, BY REGION, 2018-2040 (USD THOUSAND)
TABLE 11 NORTH AMERICA CYCLOALIPHATIC SOLVENTS IN HYDROCARBON SOLVENTS MARKET, BY TYPE, 2018-2040 (USD THOUSAND)
TABLE 12 NORTH AMERICA OTHERS IN HYDROCARBON SOLVENTS MARKET, BY REGION, 2018-2040 (USD THOUSAND)
TABLE 13 NORTH AMERICA HYDROCARBON SOLVENTS MARKET, BY APPLICATION, 2018-2040 (USD THOUSAND)
TABLE 14 NORTH AMERICA PAINT AND COATINGS IN HYDROCARBON SOLVENTS MARKET, BY REGION, 2018-2040 (USD THOUSAND)
TABLE 15 NORTH AMERICA PAINTS AND COATINGS IN HYDROCARBON SOLVENTS MARKET, BY TYPE, 2018-2040 (USD THOUSAND)
TABLE 16 NORTH AMERICA ADHESIVES IN HYDROCARBON SOLVENTS MARKET, BY REGION, 2018-2040 (USD THOUSAND)
TABLE 17 NORTH AMERICA ADHESIVES IN HYDROCARBON SOLVENTS MARKET, BY TYPE, 2018-2040 (USD THOUSAND)
TABLE 18 NORTH AMERICA PHARMACEUTICAL IN HYDROCARBON SOLVENTS MARKET, BY REGION, 2018-2040 (USD THOUSAND)
TABLE 19 NORTH AMERICA PHARMACEUTICAL IN HYDROCARBON SOLVENTS MARKET, BY TYPE, 2018-2040 (USD THOUSAND)
TABLE 20 NORTH AMERICA CLEANING AND DEGREASING IN HYDROCARBON SOLVENTS MARKET, BY REGION, 2018-2040 (USD THOUSAND)
TABLE 21 NORTH AMERICA CLEANING AND DEGREASING IN HYDROCARBON SOLVENTS MARKET, BY TYPE, 2018-2040 (USD THOUSAND)
TABLE 22 NORTH AMERICA PRINTING INKS IN HYDROCARBON SOLVENTS MARKET, BY REGION, 2018-2040 (USD THOUSAND)
TABLE 23 NORTH AMERICA PRINTING INKS IN HYDROCARBON SOLVENTS MARKET, BY TYPE, 2018-2040 (USD THOUSAND)
TABLE 24 NORTH AMERICA AGRICULTURE IN HYDROCARBON SOLVENTS MARKET, BY REGION, 2018-2040 (USD THOUSAND)
TABLE 25 NORTH AMERICA AGRICULTURE IN HYDROCARBON SOLVENTS MARKET, BY TYPE, 2018-2040 (USD THOUSAND)
TABLE 26 NORTH AMERICA RUBBER AND POLYMERS IN HYDROCARBON SOLVENTS MARKET, BY REGION, 2018-2040 (USD THOUSAND)
TABLE 27 NORTH AMERICA RUBBER AND POLYMERS IN HYDROCARBON SOLVENTS MARKET, BY TYPE, 2018-2040 (USD THOUSAND)
TABLE 28 NORTH AMERICA CHEMICALS IN HYDROCARBON SOLVENTS MARKET, BY REGION, 2018-2040 (USD THOUSAND)
TABLE 29 NORTH AMERICA CHEMICALS IN HYDROCARBON SOLVENTS MARKET, BY TYPE, 2018-2040 (USD THOUSAND)
TABLE 30 NORTH AMERICA AEROSOLS IN HYDROCARBON SOLVENTS MARKET, BY REGION, 2018-2040 (USD THOUSAND)
TABLE 31 NORTH AMERICA AEROSOLS IN HYDROCARBON SOLVENTS MARKET, BY TYPE, 2018-2040 (USD THOUSAND)
TABLE 32 NORTH AMERICA COSMETICS IN HYDROCARBON SOLVENTS MARKET, BY REGION, 2018-2040 (USD THOUSAND)
TABLE 33 NORTH AMERICA COSMETICS IN HYDROCARBON SOLVENTS MARKET, BY TYPE, 2018-2040 (USD THOUSAND)
TABLE 34 NORTH AMERICA DRILLING FLUIDS IN HYDROCARBON SOLVENTS MARKET, BY REGION, 2018-2040 (USD THOUSAND)
TABLE 35 NORTH AMERICA DRILLING FLUIDS IN HYDROCARBON SOLVENTS MARKET, BY TYPE, 2018-2040 (USD THOUSAND)
TABLE 36 NORTH AMERICA FLUXES FOR BITUMEN IN HYDROCARBON SOLVENTS MARKET, BY REGION, 2018-2040 (USD THOUSAND)
TABLE 37 NORTH AMERICA FLUXES FOR BITUMEN IN HYDROCARBON SOLVENTS MARKET, BY TYPE, 2018-2040 (USD THOUSAND)
TABLE 38 NORTH AMERICA METAL EXTRACTION IN HYDROCARBON SOLVENTS MARKET, BY REGION, 2018-2040 (USD THOUSAND)
TABLE 39 NORTH AMERICA METAL EXTRACTION IN HYDROCARBON SOLVENTS MARKET, BY TYPE, 2018-2040 (USD THOUSAND)
TABLE 40 NORTH AMERICA METAL WORKING LUBRICANT IN HYDROCARBON SOLVENTS MARKET, BY REGION, 2018-2040 (USD THOUSAND)
TABLE 41 NORTH AMERICA METAL WORKING LUBRICANT IN HYDROCARBON SOLVENTS MARKET, BY TYPE, 2018-2040 (USD THOUSAND)
TABLE 42 NORTH AMERICA SEALANTS IN HYDROCARBON SOLVENTS MARKET, BY REGION, 2018-2040 (USD THOUSAND)
TABLE 43 NORTH AMERICA SEALANTS IN HYDROCARBON SOLVENTS MARKET, BY TYPE, 2018-2040 (USD THOUSAND)
TABLE 44 NORTH AMERICA EXPLOSIVES IN HYDROCARBON SOLVENTS MARKET, BY REGION, 2018-2040 (USD THOUSAND)
TABLE 45 NORTH AMERICA EXPLOSIVES IN HYDROCARBON SOLVENTS MARKET, BY TYPE, 2018-2040 (USD THOUSAND)
TABLE 46 NORTH AMERICA OTHERS IN HYDROCARBON SOLVENTS MARKET, BY REGION, 2018-2040 (USD THOUSAND)
TABLE 47 NORTH AMERICA OTHERS IN HYDROCARBON SOLVENTS MARKET, BY TYPE, 2018-2040 (USD THOUSAND)
TABLE 48 NORTH AMERICA HYDROCARBON SOLVENTS MARKET, BY COUNTRY, 2018-2040 (USD THOUSAND)
TABLE 49 NORTH AMERICA HYDROCARBON SOLVENTS MARKET, BY COUNTRY, 2018-2040 (TONS)
TABLE 50 NORTH AMERICA HYDROCARBON SOLVENTS MARKET, BY TYPE, 2018-2040 (USD THOUSAND)
TABLE 51 NORTH AMERICA HYDROCARBON SOLVENTS MARKET, BY TYPE, 2018-2040 (TONS)
TABLE 52 NORTH AMERICA AROMATIC SOLVENTS IN HYDROCARBON SOLVENTS MARKET, BY TYPE, 2018-2040 (USD THOUSAND)
TABLE 53 NORTH AMERICA XYLENE IN HYDROCARBON SOLVENTS MARKET, BY TYPE, 2018-2040 (USD THOUSAND)
TABLE 54 NORTH AMERICA ALIPHATIC SOLVENTS IN HYDROCARBON SOLVENTS MARKET, BY TYPE, 2018-2040 (USD THOUSAND)
TABLE 55 NORTH AMERICA CYCLOALIPHATIC SOLVENTS IN HYDROCARBON SOLVENTS MARKET, BY TYPE, 2018-2040 (USD THOUSAND)
TABLE 56 NORTH AMERICA HYDROCARBON SOLVENTS MARKET, BY APPLICATION, 2018-2040 (USD THOUSAND)
TABLE 57 NORTH AMERICA PAINTS AND COATINGS IN HYDROCARBON SOLVENTS MARKET, BY TYPE, 2018-2040 (USD THOUSAND)
TABLE 58 NORTH AMERICA ADHESIVES IN HYDROCARBON SOLVENTS MARKET, BY TYPE, 2018-2040 (USD THOUSAND)
TABLE 59 NORTH AMERICA PHARMACEUTICAL IN HYDROCARBON SOLVENTS MARKET, BY TYPE, 2018-2040 (USD THOUSAND)
TABLE 60 NORTH AMERICA CLEANING AND DEGREASING IN HYDROCARBON SOLVENTS MARKET, BY TYPE, 2018-2040 (USD THOUSAND)
TABLE 61 NORTH AMERICA PRINTING INKS IN HYDROCARBON SOLVENTS MARKET, BY TYPE, 2018-2040 (USD THOUSAND)
TABLE 62 NORTH AMERICA AGRICULTURE IN HYDROCARBON SOLVENTS MARKET, BY TYPE, 2018-2040 (USD THOUSAND)
TABLE 63 NORTH AMERICA RUBBER AND POLYMERS IN HYDROCARBON SOLVENTS MARKET, BY TYPE, 2018-2040 (USD THOUSAND)
TABLE 64 NORTH AMERICA CHEMICALS IN HYDROCARBON SOLVENTS MARKET, BY TYPE, 2018-2040 (USD THOUSAND)
TABLE 65 NORTH AMERICA AEROSOLS IN HYDROCARBON SOLVENTS MARKET, BY TYPE, 2018-2040 (USD THOUSAND)
TABLE 66 NORTH AMERICA COSMETICS IN HYDROCARBON SOLVENTS MARKET, BY TYPE, 2018-2040 (USD THOUSAND)
TABLE 67 NORTH AMERICA DRILLING FLUIDS IN HYDROCARBON SOLVENTS MARKET, BY TYPE, 2018-2040 (USD THOUSAND)
TABLE 68 NORTH AMERICA FLUXES FOR BITUMEN IN HYDROCARBON SOLVENTS MARKET, BY TYPE, 2018-2040 (USD THOUSAND)
TABLE 69 NORTH AMERICA METAL EXTRACTION IN HYDROCARBON SOLVENTS MARKET, BY TYPE, 2018-2040 (USD THOUSAND)
TABLE 70 NORTH AMERICA METAL WORKING LUBRICANT IN HYDROCARBON SOLVENTS MARKET, BY TYPE, 2018-2040 (USD THOUSAND)
TABLE 71 NORTH AMERICA SEALANTS IN HYDROCARBON SOLVENTS MARKET, BY TYPE, 2018-2040 (USD THOUSAND)
TABLE 72 NORTH AMERICA EXPLOSIVES IN HYDROCARBON SOLVENTS MARKET, BY TYPE, 2018-2040 (USD THOUSAND)
TABLE 73 NORTH AMERICA OTHERS IN HYDROCARBON SOLVENTS MARKET, BY TYPE, 2018-2040 (USD THOUSAND)
TABLE 74 U.S. HYDROCARBON SOLVENTS MARKET, BY TYPE, 2018-2040 (USD THOUSAND)
TABLE 75 U.S. HYDROCARBON SOLVENTS MARKET, BY TYPE, 2018-2040 (TONS)
TABLE 76 U.S. AROMATIC SOLVENTS IN HYDROCARBON SOLVENTS MARKET, BY TYPE, 2018-2040 (USD THOUSAND)
TABLE 77 U.S. XYLENE IN HYDROCARBON SOLVENTS MARKET, BY TYPE, 2018-2040 (USD THOUSAND)
TABLE 78 U.S. ALIPHATIC SOLVENTS IN HYDROCARBON SOLVENTS MARKET, BY TYPE, 2018-2040 (USD THOUSAND)
TABLE 79 U.S. CYCLOALIPHATIC SOLVENTS IN HYDROCARBON SOLVENTS MARKET, BY TYPE, 2018-2040 (USD THOUSAND)
TABLE 80 U.S. HYDROCARBON SOLVENTS MARKET, BY APPLICATION, 2018-2040 (USD THOUSAND)
TABLE 81 U.S. PAINTS AND COATINGS IN HYDROCARBON SOLVENTS MARKET, BY TYPE, 2018-2040 (USD THOUSAND)
TABLE 82 U.S. ADHESIVES IN HYDROCARBON SOLVENTS MARKET, BY TYPE, 2018-2040 (USD THOUSAND)
TABLE 83 U.S. PHARMACEUTICAL IN HYDROCARBON SOLVENTS MARKET, BY TYPE, 2018-2040 (USD THOUSAND)
TABLE 84 U.S. CLEANING AND DEGREASING IN HYDROCARBON SOLVENTS MARKET, BY TYPE, 2018-2040 (USD THOUSAND)
TABLE 85 U.S. PRINTING INKS IN HYDROCARBON SOLVENTS MARKET, BY TYPE, 2018-2040 (USD THOUSAND)
TABLE 86 U.S. AGRICULTURE IN HYDROCARBON SOLVENTS MARKET, BY TYPE, 2018-2040 (USD THOUSAND)
TABLE 87 U.S. RUBBER AND POLYMERS IN HYDROCARBON SOLVENTS MARKET, BY TYPE, 2018-2040 (USD THOUSAND)
TABLE 88 U.S. CHEMICALS IN HYDROCARBON SOLVENTS MARKET, BY TYPE, 2018-2040 (USD THOUSAND)
TABLE 89 U.S. AEROSOLS IN HYDROCARBON SOLVENTS MARKET, BY TYPE, 2018-2040 (USD THOUSAND)
TABLE 90 U.S. COSMETICS IN HYDROCARBON SOLVENTS MARKET, BY TYPE, 2018-2040 (USD THOUSAND)
TABLE 91 U.S. DRILLING FLUIDS IN HYDROCARBON SOLVENTS MARKET, BY TYPE, 2018-2040 (USD THOUSAND)
TABLE 92 U.S. FLUXES FOR BITUMEN IN HYDROCARBON SOLVENTS MARKET, BY TYPE, 2018-2040 (USD THOUSAND)
TABLE 93 U.S. METAL EXTRACTION IN HYDROCARBON SOLVENTS MARKET, BY TYPE, 2018-2040 (USD THOUSAND)
TABLE 94 U.S. METAL WORKING LUBRICANT IN HYDROCARBON SOLVENTS MARKET, BY TYPE, 2018-2040 (USD THOUSAND)
TABLE 95 U.S. SEALANTS IN HYDROCARBON SOLVENTS MARKET, BY TYPE, 2018-2040 (USD THOUSAND)
TABLE 96 U.S. EXPLOSIVES IN HYDROCARBON SOLVENTS MARKET, BY TYPE, 2018-2040 (USD THOUSAND)
TABLE 97 U.S. OTHERS IN HYDROCARBON SOLVENTS MARKET, BY TYPE, 2018-2040 (USD THOUSAND)
TABLE 98 CANADA HYDROCARBON SOLVENTS MARKET, BY TYPE, 2018-2040 (USD THOUSAND)
TABLE 99 CANADA HYDROCARBON SOLVENTS MARKET, BY TYPE, 2018-2040 (TONS)
TABLE 100 CANADA AROMATIC SOLVENTS IN HYDROCARBON SOLVENTS MARKET, BY TYPE, 2018-2040 (USD THOUSAND)
TABLE 101 CANADA XYLENE IN HYDROCARBON SOLVENTS MARKET, BY TYPE, 2018-2040 (USD THOUSAND)
TABLE 102 CANADA ALIPHATIC SOLVENTS IN HYDROCARBON SOLVENTS MARKET, BY TYPE, 2018-2040 (USD THOUSAND)
TABLE 103 CANADA CYCLOALIPHATIC SOLVENTS IN HYDROCARBON SOLVENTS MARKET, BY TYPE, 2018-2040 (USD THOUSAND)
TABLE 104 CANADA HYDROCARBON SOLVENTS MARKET, BY APPLICATION, 2018-2040 (USD THOUSAND)
TABLE 105 CANADA PAINTS AND COATINGS IN HYDROCARBON SOLVENTS MARKET, BY TYPE, 2018-2040 (USD THOUSAND)
TABLE 106 CANADA ADHESIVES IN HYDROCARBON SOLVENTS MARKET, BY TYPE, 2018-2040 (USD THOUSAND)
TABLE 107 CANADA PHARMACEUTICAL IN HYDROCARBON SOLVENTS MARKET, BY TYPE, 2018-2040 (USD THOUSAND)
TABLE 108 CANADA CLEANING AND DEGREASING IN HYDROCARBON SOLVENTS MARKET, BY TYPE, 2018-2040 (USD THOUSAND)
TABLE 109 CANADA PRINTING INKS IN HYDROCARBON SOLVENTS MARKET, BY TYPE, 2018-2040 (USD THOUSAND)
TABLE 110 CANADA AGRICULTURE IN HYDROCARBON SOLVENTS MARKET, BY TYPE, 2018-2040 (USD THOUSAND)
TABLE 111 CANADA RUBBER AND POLYMERS IN HYDROCARBON SOLVENTS MARKET, BY TYPE, 2018-2040 (USD THOUSAND)
TABLE 112 CANADA CHEMICALS IN HYDROCARBON SOLVENTS MARKET, BY TYPE, 2018-2040 (USD THOUSAND)
TABLE 113 CANADA AEROSOLS IN HYDROCARBON SOLVENTS MARKET, BY TYPE, 2018-2040 (USD THOUSAND)
TABLE 114 CANADA COSMETICS IN HYDROCARBON SOLVENTS MARKET, BY TYPE, 2018-2040 (USD THOUSAND)
TABLE 115 CANADA DRILLING FLUIDS IN HYDROCARBON SOLVENTS MARKET, BY TYPE, 2018-2040 (USD THOUSAND)
TABLE 116 CANADA FLUXES FOR BITUMEN IN HYDROCARBON SOLVENTS MARKET, BY TYPE, 2018-2040 (USD THOUSAND)
TABLE 117 CANADA METAL EXTRACTION IN HYDROCARBON SOLVENTS MARKET, BY TYPE, 2018-2040 (USD THOUSAND)
TABLE 118 CANADA METAL WORKING LUBRICANT IN HYDROCARBON SOLVENTS MARKET, BY TYPE, 2018-2040 (USD THOUSAND)
TABLE 119 CANADA SEALANTS IN HYDROCARBON SOLVENTS MARKET, BY TYPE, 2018-2040 (USD THOUSAND)
TABLE 120 CANADA EXPLOSIVES IN HYDROCARBON SOLVENTS MARKET, BY TYPE, 2018-2040 (USD THOUSAND)
TABLE 121 CANADA OTHERS IN HYDROCARBON SOLVENTS MARKET, BY TYPE, 2018-2040 (USD THOUSAND)
TABLE 122 MEXICO HYDROCARBON SOLVENTS MARKET, BY TYPE, 2018-2040 (USD THOUSAND)
TABLE 123 MEXICO HYDROCARBON SOLVENTS MARKET, BY TYPE, 2018-2040 (TONS)
TABLE 124 MEXICO AROMATIC SOLVENTS IN HYDROCARBON SOLVENTS MARKET, BY TYPE, 2018-2040 (USD THOUSAND)
TABLE 125 MEXICO XYLENE IN HYDROCARBON SOLVENTS MARKET, BY TYPE, 2018-2040 (USD THOUSAND)
TABLE 126 MEXICO ALIPHATIC SOLVENTS IN HYDROCARBON SOLVENTS MARKET, BY TYPE, 2018-2040 (USD THOUSAND)
TABLE 127 MEXICO CYCLOALIPHATIC SOLVENTS IN HYDROCARBON SOLVENTS MARKET, BY TYPE, 2018-2040 (USD THOUSAND)
TABLE 128 MEXICO HYDROCARBON SOLVENTS MARKET, BY APPLICATION, 2018-2040 (USD THOUSAND)
TABLE 129 MEXICO PAINTS AND COATINGS IN HYDROCARBON SOLVENTS MARKET, BY TYPE, 2018-2040 (USD THOUSAND)
TABLE 130 MEXICO ADHESIVES IN HYDROCARBON SOLVENTS MARKET, BY TYPE, 2018-2040 (USD THOUSAND)
TABLE 131 MEXICO PHARMACEUTICAL IN HYDROCARBON SOLVENTS MARKET, BY TYPE, 2018-2040 (USD THOUSAND)
TABLE 132 MEXICO CLEANING AND DEGREASING IN HYDROCARBON SOLVENTS MARKET, BY TYPE, 2018-2040 (USD THOUSAND)
TABLE 133 MEXICO PRINTING INKS IN HYDROCARBON SOLVENTS MARKET, BY TYPE, 2018-2040 (USD THOUSAND)
TABLE 134 MEXICO AGRICULTURE IN HYDROCARBON SOLVENTS MARKET, BY TYPE, 2018-2040 (USD THOUSAND)
TABLE 135 MEXICO RUBBER AND POLYMERS IN HYDROCARBON SOLVENTS MARKET, BY TYPE, 2018-2040 (USD THOUSAND)
TABLE 136 MEXICO CHEMICALS IN HYDROCARBON SOLVENTS MARKET, BY TYPE, 2018-2040 (USD THOUSAND)
TABLE 137 MEXICO AEROSOLS IN HYDROCARBON SOLVENTS MARKET, BY TYPE, 2018-2040 (USD THOUSAND)
TABLE 138 MEXICO COSMETICS IN HYDROCARBON SOLVENTS MARKET, BY TYPE, 2018-2040 (USD THOUSAND)
TABLE 139 MEXICO DRILLING FLUIDS IN HYDROCARBON SOLVENTS MARKET, BY TYPE, 2018-2040 (USD THOUSAND)
TABLE 140 MEXICO FLUXES FOR BITUMEN IN HYDROCARBON SOLVENTS MARKET, BY TYPE, 2018-2040 (USD THOUSAND)
TABLE 141 MEXICO METAL EXTRACTION IN HYDROCARBON SOLVENTS MARKET, BY TYPE, 2018-2040 (USD THOUSAND)
TABLE 142 MEXICO METAL WORKING LUBRICANT IN HYDROCARBON SOLVENTS MARKET, BY TYPE, 2018-2040 (USD THOUSAND)
TABLE 143 MEXICO SEALANTS IN HYDROCARBON SOLVENTS MARKET, BY TYPE, 2018-2040 (USD THOUSAND)
TABLE 144 MEXICO EXPLOSIVES IN HYDROCARBON SOLVENTS MARKET, BY TYPE, 2018-2040 (USD THOUSAND)
TABLE 145 MEXICO OTHERS IN HYDROCARBON SOLVENTS MARKET, BY TYPE, 2018-2040 (USD THOUSAND)
List of Figure
FIGURE 1 NORTH AMERICA HYDROCARBON SOLVENTS MARKET
FIGURE 2 NORTH AMERICA HYDROCARBON SOLVENTS MARKET: DATA TRIANGULATION
FIGURE 3 NORTH AMERICA HYDROCARBON SOLVENTS MARKET: DROC ANALYSIS
FIGURE 4 NORTH AMERICA HYDROCARBON SOLVENTS MARKET: NORTH AMERICA VS REGIONAL MARKET ANALYSIS
FIGURE 5 NORTH AMERICA HYDROCARBON SOLVENTS MARKET: COMPANY RESEARCH ANALYSIS
FIGURE 6 NORTH AMERICA HYDROCARBON SOLVENTS MARKET: MULTIVARIATE MODELLING
FIGURE 7 NORTH AMERICA HYDROCARBON SOLVENTS MARKET: INTERVIEW DEMOGRAPHICS
FIGURE 8 NORTH AMERICA HYDROCARBON SOLVENTS MARKET: DBMR MARKET POSITION GRID
FIGURE 9 NORTH AMERICA HYDROCARBON SOLVENTS MARKET: VENDOR SHARE ANALYSIS
FIGURE 10 NORTH AMERICA HYDROCARBON SOLVENTS MARKET: MARKET APPLICATION COVERAGE GRID
FIGURE 11 NORTH AMERICA HYDROCARBON SOLVENTS MARKET: SEGMENTATION
FIGURE 12 FIVE SEGMENTS COMPRISE THE NORTH AMERICA HYDROCARBON SOLVENTS MARKET, BY TYPE (2024)
FIGURE 13 STRATEGIC DECISIONS
FIGURE 14 EXECUTIVE SUMMARY
FIGURE 15 GROWING DEMAND FOR HYDROCARBON SOLVENTS FROM END-USE INDUSTRIES IS EXPECTED TO DRIVE THE NORTH AMERICA HYDROCARBON SOLVENTS MARKET IN THE FORECAST PERIOD (2025-2040)
FIGURE 16 THE AROMATIC SOLVENTS SEGMENT IS EXPECTED TO ACCOUNT FOR THE LARGEST SHARE OF THE NORTH AMERICA HYDROCARBON SOLVENTS MARKET IN 2025 AND 2040
FIGURE 17 PESTEL ANALYSIS
FIGURE 18 PORTER’S FIVE FORCES
FIGURE 19 NORTH AMERICA HYDROCARBON SOLVENTS MARKET, 2024-2040, AVERAGE SELLING PRICE (USD/KG)
FIGURE 20 IMPORT EXPORT SCENARIO (USD THOUSAND)
FIGURE 21 PRODUCTION CONSUMPTION ANALYSIS
FIGURE 22 VENDOR SELECTION CRITERIA
FIGURE 23 DRIVERS, RESTRAINTS, OPPORTUNITIES, AND CHALLENGES FOR NORTH AMERICA HYDROCARBON SOLVENTS MARKET
FIGURE 24 NORTH AMERICA HYDROCARBON SOLVENTS MARKET: BY TYPE, 2024
FIGURE 25 NORTH AMERICA HYDROCARBON SOLVENTS MARKET: BY APPLICATION, 2024
FIGURE 26 NORTH AMERICA HYDROCARBON SOLVENTS MARKET: SNAPSHOT (2024)
FIGURE 27 NORTH AMERICA HYDROCARBON SOLVENTS MARKET: COMPANY SHARE 2024 (%)
North America Hydrocarbon Solvents Market, Supply Chain Analysis and Ecosystem Framework
To support market growth and help clients navigate the impact of geopolitical shifts, DBMR has integrated in-depth supply chain analysis into its North America Hydrocarbon Solvents Market research reports. This addition empowers clients to respond effectively to global changes affecting their industries. The supply chain analysis section includes detailed insights such as North America Hydrocarbon Solvents Market consumption and production by country, price trend analysis, the impact of tariffs and geopolitical developments, and import and export trends by country and HSN code. It also highlights major suppliers with data on production capacity and company profiles, as well as key importers and exporters. In addition to research, DBMR offers specialized supply chain consulting services backed by over a decade of experience, providing solutions like supplier discovery, supplier risk assessment, price trend analysis, impact evaluation of inflation and trade route changes, and comprehensive market trend analysis.
Data collection and base year analysis are done using data collection modules with large sample sizes. The stage includes obtaining market information or related data through various sources and strategies. It includes examining and planning all the data acquired from the past in advance. It likewise envelops the examination of information inconsistencies seen across different information sources. The market data is analysed and estimated using market statistical and coherent models. Also, market share analysis and key trend analysis are the major success factors in the market report. To know more, please request an analyst call or drop down your inquiry.
The key research methodology used by DBMR research team is data triangulation which involves data mining, analysis of the impact of data variables on the market and primary (industry expert) validation. Data models include Vendor Positioning Grid, Market Time Line Analysis, Market Overview and Guide, Company Positioning Grid, Patent Analysis, Pricing Analysis, Company Market Share Analysis, Standards of Measurement, Global versus Regional and Vendor Share Analysis. To know more about the research methodology, drop in an inquiry to speak to our industry experts.
Data Bridge Market Research is a leader in advanced formative research. We take pride in servicing our existing and new customers with data and analysis that match and suits their goal. The report can be customized to include price trend analysis of target brands understanding the market for additional countries (ask for the list of countries), clinical trial results data, literature review, refurbished market and product base analysis. Market analysis of target competitors can be analyzed from technology-based analysis to market portfolio strategies. We can add as many competitors that you require data about in the format and data style you are looking for. Our team of analysts can also provide you data in crude raw excel files pivot tables (Fact book) or can assist you in creating presentations from the data sets available in the report.


