
 Market Analysis and Insights: North America Power Tools Market
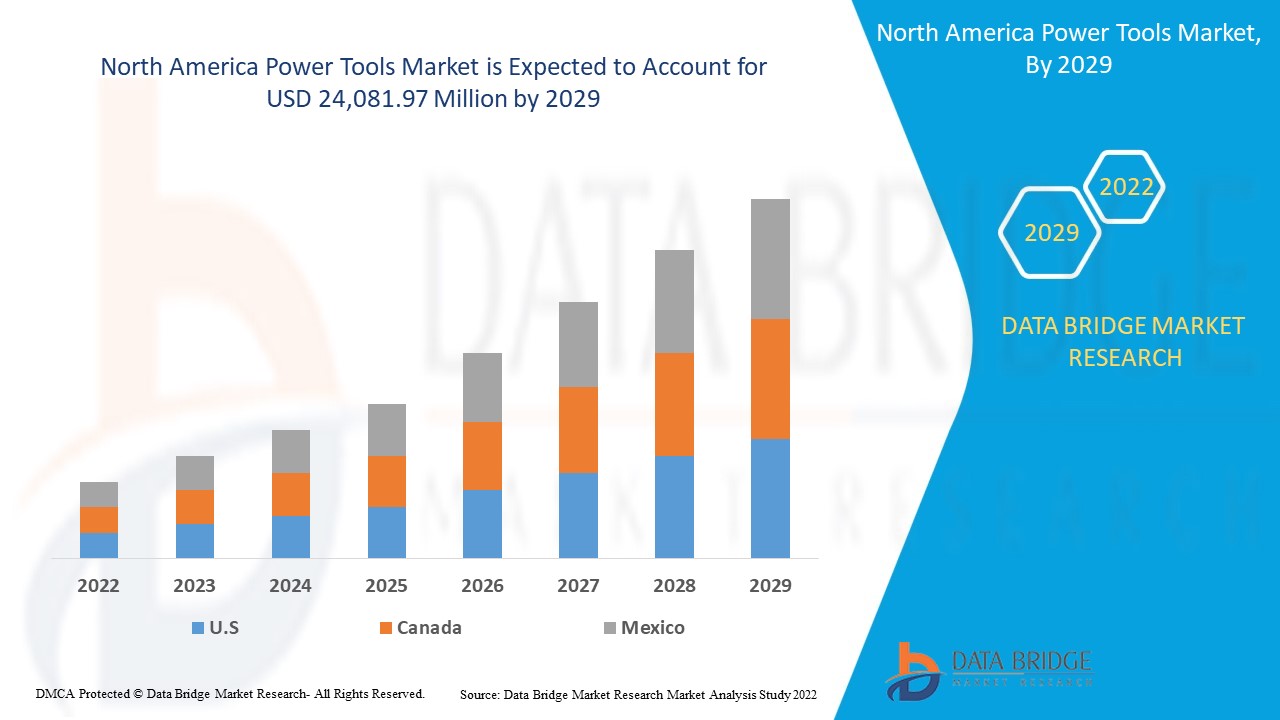
Power tools market is expected to gain market growth in the forecast period of 2022 to 2029. Data Bridge Market Research analyses that the market is growing with a CAGR of 6.0% in the forecast period of 2022 to 2029 and expected to reach USD 24,081.97 million by 2029. Increasing accuracy and time saving is driving the growth for market.
Power tools are referred to those types of tools which require additional power sources to run their mechanism; they consist of motor to power their operation. These motors can be driven through electric power, compressed air, or through internal combustion using fuel. These power tools are used for various operations such as drilling, demolition, cutting and sawing, material removal, polishing and others. These operations require various types of tools such as drills, hammer, jigsaw, and sanders. Power tools are put into use for both industry and residential purposes to ease the work of the users. They provide better accuracy, ease of working and higher productivity. The work gets simpler and faster when working with power tools.
Hand tools require lot of manual work and consume lot of work, also resulting in non-uniformity; on the other hand, power tools are one-time investment and offer easier work, time saving and precision work quality. These advantages of power tools over conventional tools is helping to grow market at higher value. Increase in the growth of cordless power tools and integration of brushless motors in power tools acts as a driving factor for the market. However, the high maintenance of power tools hinders the market growth.
This power tools market report provides details of market share, new developments, and product pipeline analysis, impact of domestic and localised market players, analyses opportunities in terms of emerging revenue pockets, changes in market regulations, product approvals, strategic decisions, product launches, geographic expansions, and technological innovations in the market. To understand the analysis and the market scenario contact us for an Analyst Brief, our team will help you create a revenue impact solution to achieve your desired goal.
 North America Power Tools Market Scope and Market Size
North America power tools market is segmented on the basis of type, mode of operation, application, material, end user, and sales channel. The growth among segments helps you analyse niche pockets of growth and strategies to approach the market and determine your core application areas and the difference in your target markets.
- On the basis of type, the market is segmented into sawing and cutting tools, drilling and fastening tools, demolition tools, nailers, routing tools, portable nibblers, air-powered tools, material removal tools, electric cords and plugs, chisels, accessories, others. In 2022, saw and cutting dominate the type segment and expected to grow at greater rate since cutting operations are more in metalwork and woodwork which are widely used across the world.
- On the basis of mode of operation, the market is segmented into electric, liquid fuel tool, hydraulic, pneumatic, powder-actuated tools. In 2022, electric might hold largest market shares in mode of operation segment since majority of the tools bought are electric based its more affordable in terms of operating cost and ease of operation.
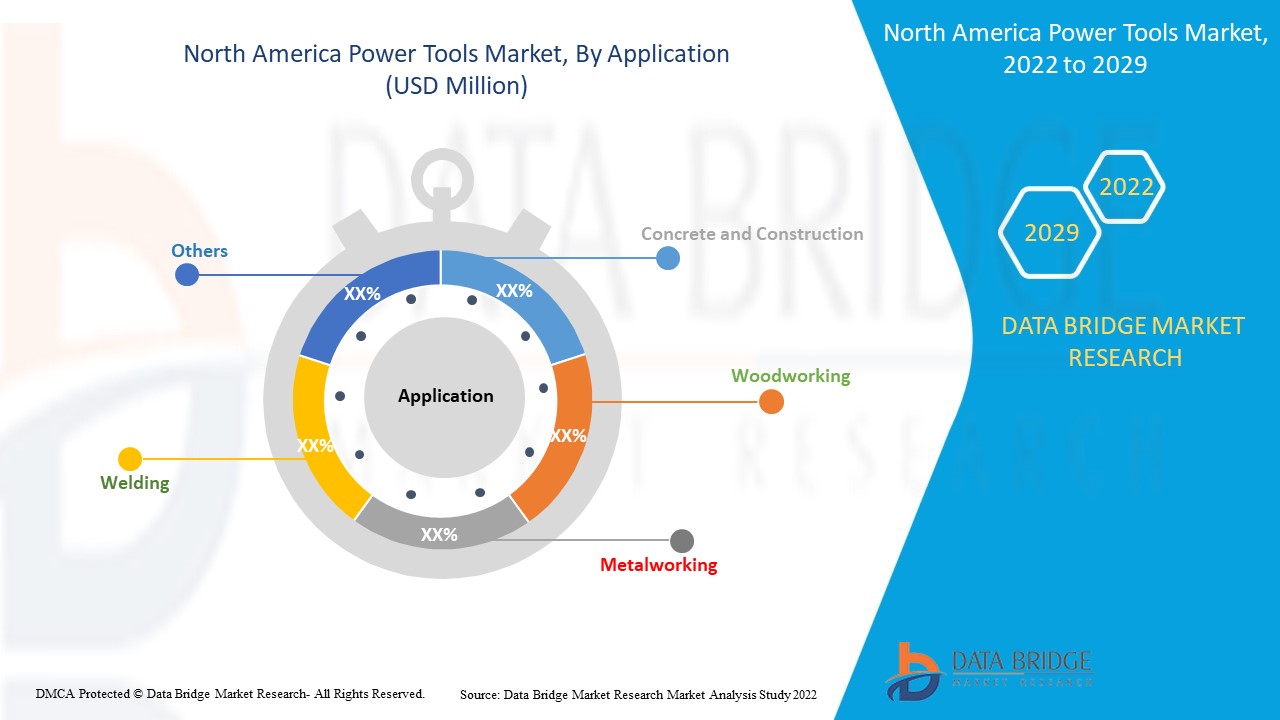
- On the basis of application, the market is segmented into concrete and construction, woodworking, metalworking, welding, others. In 2022, concrete and construction will hold largest market share in the application segment and expected to grow at higher rate as infrastructure is growing around the world and power tools are required for faster operations.
- On the basis of material, the market is segmented into concrete, wood/metal, brick/block, glass, others. In 2022, concrete might dominate material segment as it grows coherently with application segment with application segment.
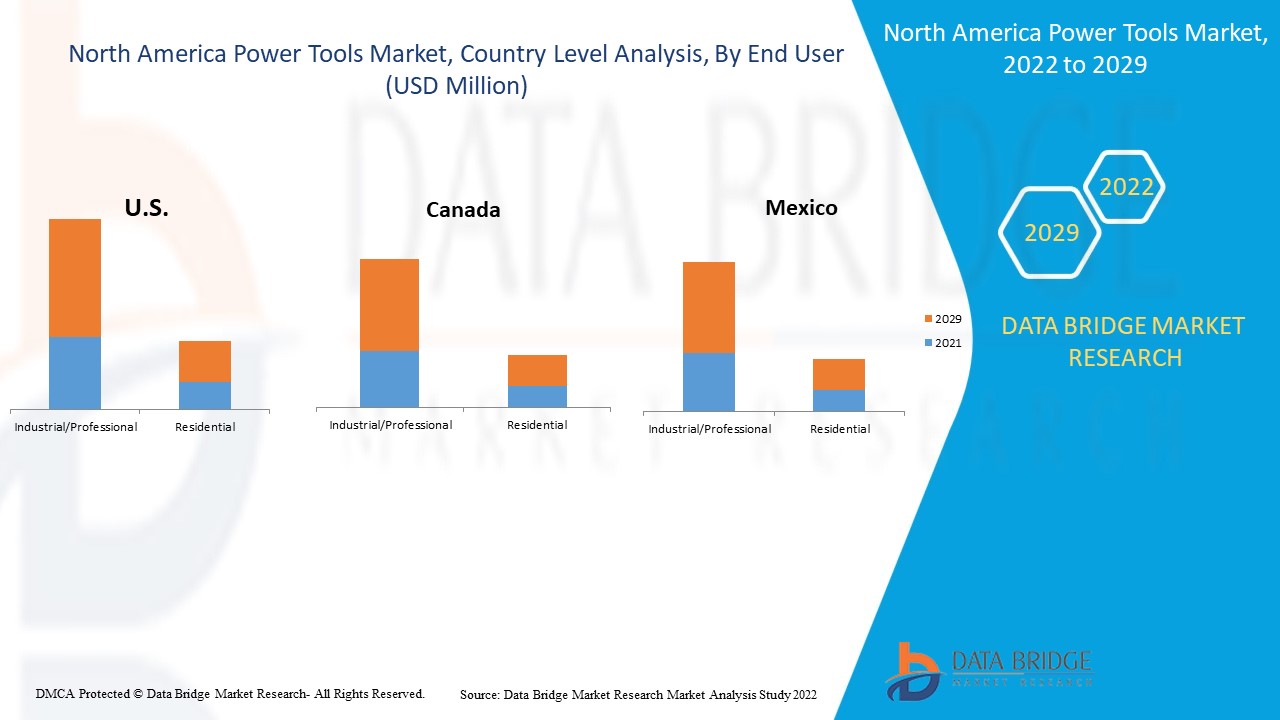
- On the basis of end user, the market is segmented into industrial/professional, residential. In 2022, industrial/professional will dominate end user segment and expected to grow at higher rate as industrial fields have large scale operations which needs to be completed in minimum time where power tools are of great significance.
- On the basis of sales channel, the market is segmented into indirect sales, direct sales. In 2022, sales channel segment will be dominated by indirect sales the as these tools are mostly purchased from distributors or vendors; however, with growing e-commerce sector and direct online sales by company’s direct sales are growing at higher rate.
 Power tools Market Country Level Analysis
Power tools market is analysed and market size information is provided by country, type, mode of operation, application, material, end user, and sales channel.
The countries covered in North America power tools market report are U.S., Canada and Mexico.
U.S. dominates the North America power tools market as country has global leader headquarters such as Stanley Black & Decker, Inc.; also companies such as Koki Holdings Co., Ltd., Panasonic Corporation are generating heavy revenue in the region.
The end user segment dominates the North America power tools market, with U.S. leading the market followed by Canada and Mexico. The end user segment is sub-segmented into industrial/professional and residential.
The country section of the report also provides individual market impacting factors and changes in regulation in the market domestically that impacts the current and future trends of the market. Data points such as new sales, replacement sales, country demographics, regulatory acts and import-export tariffs are some of the major pointers used to forecast the market scenario for individual countries. Also, presence and availability of global brands and their challenges faced due to large or scarce competition from local and domestic brands, impact of sales channels are considered while providing forecast analysis of the country data.
Increasing Need of Easy Concrete Structure Operations
Power tools market also provides you with detailed market analysis for every country growth in industry with sales, components sales, impact of technological development in Power tools and changes in regulatory scenarios with their support for the Power tools market. The data is available for historic period 2012 to 2019.
Competitive Landscape and Power Tools Market Share Analysis
Power tools market competitive landscape provides details by competitor. Details included are company overview, company financials, revenue generated, market potential, investment in research and development, new market initiatives, global presence, production sites and facilities, company strengths and weaknesses, product launch, product trials pipelines, product approvals, patents, product width and breadth, application dominance, technology lifeline curve. The above data points provided are only related to the companies’ focus related to North America power tools market.
The major players covered in the report are Atlas Copco AB, Stanley Black & Decker, Inc., Snap-on Incorporated, Robert Bosch GmbH, Koki Holdings Co., Ltd., Emerson Electric Co., Festool GmbH, KYOCERA Corporation, Ingersoll Rand, Makita Corporation, Hilti AG, Husqvarna AB, Panasonic Corporation of North America (A subsidiary of Panasonic Corporation), Techtronic Industries Co. Ltd, Apex Tool Group, LLC., 3M, Delta Power Equipment Corporation, and C. & E. Fein GmbH among others. DBMR analysts understand competitive strengths and provide competitive analysis for each competitor separately.
Many product developments are also initiated by the companies worldwide which are also accelerating the growth of power tools market.
For instance,
- In September 2019, CRAFTSMAN, a power tool division of Stanley Black & Decker, Inc. launched V20* Cordless System; this new cordless system comprises of power tools such as V20* Cordless Wet Tile Saw with 17-inch cut capacity
- In February 2019, Cleco, a power tool division of Apex Tool Group, LLC launched CellCore assembly tool line this new cordless tool line offers durability and reliability with larger user interface. The new design also reduces the fatigue of the operator leading
Partnership, joint ventures and other strategies enhances the company market share with increased coverage and presence. It also provides the benefit for organisation to improve their offering for Power tools through expanded range of size.
SKU-

- Interactive Data Analysis Dashboard
- Company Analysis Dashboard for high growth potential opportunities
- Research Analyst Access for customization & queries
- Competitor Analysis with Interactive dashboard
- Latest News, Updates & Trend analysis
- Harness the Power of Benchmark Analysis for Comprehensive Competitor Tracking
Table of Content
1 INTRODUCTION
1.1 OBJECTIVES OF THE STUDY
1.2 MARKET DEFINITION
1.3 OVERVIEW OF NORTH AMERICA POWER TOOLS MARKET
1.4 CURRENCY AND PRICING
1.5 LIMITATIONS
1.6 MARKETS COVERED
2 MARKET SEGMENTATION
2.1 MARKETS COVERED
2.2 GEOGRAPHICAL SCOPE
2.3 YEARS CONSIDERED FOR THE STUDY
2.4 DBMR TRIPOD DATA VALIDATION MODEL
2.5 PRIMARY INTERVIEWS WITH KEY OPINION LEADERS
2.6 DBMR MARKET POSITION GRID
2.7 VENDOR SHARE ANALYSIS
2.8 MULTIVARIATE MODELING
2.9 TYPE TIMELINE CURVE
2.1 MARKET APPLICATION COVERAGE GRID
2.11 SECONDARY SOURCES
2.12 ASSUMPTIONS
3 EXECUTIVE SUMMARY
4 PREMIUM INSIGHTS
4.1 PRODUCT ANALYSIS OF 20 COMPANIES IN EUROPE
4.2 PRODUCT ANALYSIS OF 20 COMPANIES IN NORTH AMERICA
5 MARKET OVERVIEW
5.1 DRIVERS
5.1.1 INCREASE IN GROWTH OF CORDLESS POWER TOOLS
5.1.2 INTEGRATION OF BRUSHLESS MOTORS IN POWER TOOLS
5.1.3 INCREASING GROWTH OF INFRASTRUCTURE PROJECTS
5.1.4 BETTER OFFERING THAN HAND TOOLS
5.1.5 EXPANSION OF MOTOR VEHICLE MAINTENANCE MARKET AS VEHICLE OWNERSHIP RATE INCREASES
5.2 RESTRAINTS
5.2.1 HIGH MAINTENANCE OF POWER TOOLS
5.2.2 FLUCTUATION IN PRICES OF RAW MATERIALS
5.2.3 LIMITATIONS INVOLVED IN LI-ION BATTERY USAGE FOR CORDLESS POWER TOOLS
5.3 OPPORTUNITIES
5.3.1 GROWTH IN WIND ENERGY INDUSTRY AIDING THE POWER TOOLS
5.3.2 SMART CONNECTIVITY IN POWER TOOLS
5.3.3 TECHNOLOGICAL INNOVATIONS IN INDUSTRY 4.0
5.4 CHALLENGES
5.4.1 DESIGNING ERGONOMIC AND LIGHTWEIGHT POWER TOOLS
5.4.2 REGULATORY COMPLIANCE AND POWER TOOL SAFETY
6 COVID-19 IMPACT ON NORTH AMERICA POWER TOOLS MARKET
6.1 ANALYSIS ON IMPACT OF COVID-19 ON THE MARKET
6.2 AFTERMATH OF COVID-19 AND GOVERNMENT INITIATIVES TO BOOST THE MARKET
6.3 STRATEGIC DECISIONS FOR MANUFACTURERS AFTER COVID-19 TO GAIN COMPETITIVE MARKET SHARE
6.4 IMPACT ON DEMAND
6.5 IMPACT ON PRICE
6.6 IMPACT ON SUPPLY CHAIN
6.7 CONCLUSION
7 NORTH AMERICA POWER TOOLS MARKET, BY TYPE
7.1 OVERVIEW
7.2 SAWING AND CUTTING TOOLS
7.2.1 CIRCULAR SAWS
7.2.2 JIGSAWS
7.2.3 MULTI-CUTTER SAWS
7.2.4 CHOP SAWS
7.2.5 BAND SAWS
7.2.6 RECIPROCATING SAWS
7.2.7 SHEARS AND NIBBLERS
7.3 DRILLING AND FASTENING TOOLS
7.3.1 DRILLS
7.3.2 SCREWDRIVERS AND NUTRUNNERS
7.3.3 IMPACT WRENCHES
7.3.4 IMPACT DRIVERS
7.4 DEMOLITION TOOLS
7.4.1 DEMOLITION HAMMER
7.4.2 HAMMER DRILL
7.4.3 BREAKER
7.4.4 ROTARY HAMMER
7.4.5 OTHERS
7.5 NAILERS
7.6 ROUTING TOOLS
7.6.1 ROUTERS/PLANER
7.6.2 JOINERS
7.7 PORTABLE NIBBLERS
7.8 AIR-POWERED TOOLS
7.8.1 AIR HOSES
7.8.2 AIR HAMMERS
7.8.3 AIR SCALERS
7.8.4 OTHERS
7.9 MATERIAL REMOVAL TOOLS
7.9.1 GRINDERS
7.9.1.1 DIE AND STRAIGHT GRINDER
7.9.1.2 ANGLE GRINDER
7.9.1.3 ROTARY FILES
7.9.1.4 BENCH GRINDER
7.9.1.5 PENCIL GRINDERS
7.9.2 SANDERS
7.9.3 POLISHERS/BUFFERS
7.1 ELECTRIC CORDS AND PLUGS
7.11 CHISELS
7.12 ACCESSORIES
7.13 OTHERS
8 NORTH AMERICA POWER TOOLS MARKET, BY MODE OF OPERATION
8.1 OVERVIEW
8.2 ELECTRIC
8.2.1 CORDED TOOL
8.2.2 CORDLESS TOOL
8.3 LIQUID FUEL TOOL
8.4 HYDRAULIC
8.5 PNEUMATIC
8.6 POWDER-ACTUATED TOOLS
9 NORTH AMERICA POWER TOOLS MARKET, BY APPLICATION
9.1 OVERVIEW
9.2 CONCRETE AND CONSTRUCTION
9.3 WOODWORKING
9.4 METALWORKING
9.5 WELDING
9.6 OTHERS
10 NORTH AMERICA POWER TOOLS MARKET, BY MATERIAL
10.1 OVERVIEW
10.2 CONCRETE
10.3 WOOD/METAL
10.4 BRICK/BLOCK
10.5 GLASS
10.6 OTHERS
11 NORTH AMERICA POWER TOOLS MARKET, BY END USER
11.1 OVERVIEW
11.2 INDUSTRIAL/PROFESSIONAL
11.2.1 BY TYPE
11.2.1.1 SAWING AND CUTTING TOOLS
11.2.1.2 DRILLING AND FASTENING TOOLS
11.2.1.3 DEMOLITION TOOLS
11.2.1.4 NAILERS
11.2.1.5 ROUTING TOOLS
11.2.1.6 PORTABLE NIBBLERS
11.2.1.7 AIR-POWERED TOOLS
11.2.1.8 MATERIAL REMOVAL TOOLS
11.2.1.9 ELECTRIC CORDS AND PLUGS
11.2.1.10 CHISELS
11.2.1.11 OTHERS
11.2.2 BY MODE OF OPERATION
11.2.2.1 ELECTRIC
11.2.2.2 LIQUID FUEL TOOL
11.2.2.3 HYDRAULIC
11.2.2.4 PNEUMATIC
11.2.2.5 POWDER-ACTUATED TOOLS
11.3 RESIDENTIAL
11.3.1 ELECTRIC
11.3.2 LIQUID FUEL TOOL
11.3.3 HYDRAULIC
11.3.4 PNEUMATIC
11.3.5 POWDER-ACTUATED TOOLS
12 NORTH AMERICA POWER TOOLS MARKET, BY SALES CHANNEL
12.1 OVERVIEW
12.2 INDIRECT SALES
12.3 DIRECT SALES
13 NORTH AMERICA POWER TOOLS MARKET, BY REGION
13.1 NORTH AMERICA
13.1.1 U.S.
13.1.2 CANADA
13.1.3 MEXICO
14 NORTH AMERICA POWER TOOLS MARKET: COMPANY LANDSCAPE
14.1 COMPANY SHARE ANALYSIS: EUROPE
15 SWOT ANALYSIS
16 COMPANY PROFILE
16.1 3M
16.1.1 COMPANY SNAPSHOT
16.1.2 REVENUE ANALYSIS
16.1.3 PRODUCT PORTFOLIO
16.1.4 RECENT DEVELOPMENT
16.2 APEX TOOL GROUP, LLC
16.2.1 COMPANY SNAPSHOT
16.2.2 PRODUCT PORTFOLIO
16.2.3 RECENT DEVELOPMENTS
16.3 ATLAS COPCO AB
16.3.1 COMPANY SNAPSHOT
16.3.2 REVENUE ANALYSIS
16.3.3 PRODUCT PORTFOLIO
16.3.4 RECENT DEVELOPMENTS
16.4 C. & E. FEIN GMBH
16.4.1 COMPANY SNAPSHOT
16.4.2 PRODUCT PORTFOLIO
16.4.3 RECENT DEVELOPMENT
16.5 DELTA POWER EQUIPMENT CORPORATION
16.5.1 COMPANY SNAPSHOT
16.5.2 PRODUCT PORTFOLIO
16.5.3 RECENT DEVELOPMENT
16.6 EMERSON ELECTRIC CO.
16.6.1 COMPANY SNAPSHOT
16.6.2 REVENUE ANALYSIS
16.6.3 PRODUCT PORTFOLIO
16.6.4 RECENT DEVELOPMENTS
16.7 FERM INTERNATIONAL B.V.
16.7.1 COMPANY SNAPSHOT
16.7.2 PRODUCT PORTFOLIO
16.7.3 RECENT DEVELOPMENT
16.8 FESTOOL GMBH
16.8.1 COMPANY SNAPSHOT
16.8.2 PRODUCT PORTFOLIO
16.8.3 RECENT DEVELOPMENTS
16.9 HILTI AG
16.9.1 COMPANY SNAPSHOT
16.9.2 PRODUCT PORTFOLIO
16.9.3 RECENT DEVELOPMENTS
16.1 HUSQVARNA GROUP
16.10.1 COMPANY SNAPSHOT
16.10.2 REVENUE ANALYSIS
16.10.3 PRODUCT PORTFOLIO
16.10.4 RECENT DEVELOPMENTS
16.11 INGERSOLL RAND
16.11.1 COMPANY SNAPSHOT
16.11.2 REVENUE ANALYSIS
16.11.3 PRODUCT PORTFOLIO
16.11.4 RECENT DEVELOPMENT
16.12 INTERSKOL
16.12.1 COMPANY SNAPSHOT
16.12.2 PRODUCT PORTFOLIO
16.12.3 RECENT DEVELOPMENTS
16.13 KOKI HOLDINGS CO., LTD.
16.13.1 COMPANY SNAPSHOT
16.13.2 PRODUCT PORTFOLIO
16.13.3 RECENT DEVELOPMENTS
16.14 KYOCERA CORPORATION
16.14.1 COMPANY SNAPSHOT
16.14.2 REVENUE ANALYSIS
16.14.3 PRODUCT PORTFOLIO
16.14.4 RECENT DEVELOPMENTS
16.15 MAKITA CORPORATION
16.15.1 COMPANY SNAPSHOT
16.15.2 REVENUE ANALYSIS
16.15.3 PRODUCT PORTFOLIO
16.15.4 RECENT DEVELOPMENTS
16.16 PANASONIC CORPORATION OF NORTH AMERICA
16.16.1 COMPANY SNAPSHOT
16.16.2 PRODUCT PORTFOLIO
16.16.3 RECENT DEVELOPMENT
16.17 ROBERT BOSCH GMBH
16.17.1 COMPANY SNAPSHOT
16.17.2 REVENUE ANALYSIS
16.17.3 PRODUCT PORTFOLIO
16.17.4 RECENT DEVELOPMENTS
16.18 SNAP-ON INCORPORATED
16.18.1 COMPANY SNAPSHOT
16.18.2 REVENUE ANALYSIS
16.18.3 PRODUCT PORTFOLIO
16.18.4 RECENT DEVELOPMENTS
16.19 STANLEY BLACK & DECKER, INC.
16.19.1 COMPANY SNAPSHOT
16.19.2 REVENUE ANALYSIS
16.19.3 PRODUCT PORTFOLIO
16.19.4 RECENT DEVELOPMENTS
16.2 TECHTRONIC INDUSTRIES CO. LTD.
16.20.1 COMPANY SNAPSHOT
16.20.2 REVENUE ANALYSIS
16.20.3 PRODUCT PORTFOLIO
16.20.4 RECENT DEVELOPMENTS
17 QUESTIONNAIRE
18 RELATED REPORTS
List of Table
TABLE 1 TECHTRONIC INDUSTRIES CO. LTD.
TABLE 2 STANLEY BLACK & DECKER, INC.
TABLE 3 HILTI AG
TABLE 4 3M
TABLE 5 ATLAS COPCO AB
TABLE 6 C. & E. FEIN GMBH
TABLE 7 FERM INTERNATIONAL B.V.
TABLE 8 FESTOOL GMBH
TABLE 9 INTERSKOL
TABLE 10 MAKITA CORPORATION
TABLE 11 ROBERT BOSCH GMBH
TABLE 12 EMERSON ELECTRIC CO.
TABLE 13 HUSQVARNA GROUP
TABLE 14 INGERSOLL RAND
TABLE 15 KYOCERA CORPORATION
TABLE 16 PANASONIC CORPORATION OF NORTH AMERICA (A SUBSIDIARY OF PANASONIC CORPORATION)
TABLE 17 SNAP-ON INCORPORATED
TABLE 18 TECHTRONIC INDUSTRIES CO. LTD.
TABLE 19 STANLEY BLACK & DECKER, INC.
TABLE 20 HILTI AG
TABLE 21 3M
TABLE 22 ATLAS COPCO AB
TABLE 23 C. & E. FEIN GMBH
TABLE 24 MAKITA CORPORATION
TABLE 25 ROBERT BOSCH GMBH
TABLE 26 EMERSON ELECTRIC CO.
TABLE 27 HUSQVARNA GROUP
TABLE 28 INGERSOLL RAND
TABLE 29 KYOCERA CORPORATION
TABLE 30 PANASONIC CORPORATION OF NORTH AMERICA (A SUBSIDIARY OF PANASONIC CORPORATION)
TABLE 31 SNAP-ON INCORPORATED
TABLE 32 NORTH AMERICA POWER TOOLS MARKET, BY TYPE, 2015-2029 (USD MILLION)
TABLE 33 NORTH AMERICA SAWING AND CUTTING TOOLS IN POWER TOOLS MARKET, BY REGION, 2015-2029 (USD MILLION)
TABLE 34 NORTH AMERICA SAWING AND CUTTING TOOLS IN POWER TOOLS MARKET, BY TYPE, 2015-2029 (USD MILLION)
TABLE 35 NORTH AMERICA DRILLING AND FASTENING TOOLS IN POWER TOOLS MARKET, BY REGION, 2015-2029 (USD MILLION)
TABLE 36 NORTH AMERICA DRILLING AND FASTENING TOOLS IN POWER TOOLS MARKET, BY TYPE, 2015-2029 (USD MILLION)
TABLE 37 NORTH AMERICA DEMOLITION TOOLS IN POWER TOOLS MARKET, BY REGION, 2015-2029 (USD MILLION)
TABLE 38 NORTH AMERICA DEMOLITION TOOLS IN POWER TOOLS MARKET, BY TYPE, 2015-2029 (USD MILLION)
TABLE 39 NORTH AMERICA NAILERS IN POWER TOOLS MARKET, BY REGION, 2015-2029 (USD MILLION)
TABLE 40 NORTH AMERICA ROUTING TOOLS IN POWER TOOLS MARKET, BY REGION, 2015-2029 (USD MILLION)
TABLE 41 NORTH AMERICA ROUTING TOOLS IN POWER TOOLS MARKET, BY TYPE, 2015-2029 (USD MILLION)
TABLE 42 NORTH AMERICA PORTABLE NIBBLERS IN POWER TOOLS MARKET, BY REGION, 2015-2029 (USD MILLION)
TABLE 43 NORTH AMERICA AIR-POWERED TOOLS IN POWER TOOLS MARKET, BY REGION, 2015-2029 (USD MILLION)
TABLE 44 NORTH AMERICA AIR-POWERED TOOLS IN POWER TOOLS MARKET, BY TYPE, 2015-2029 (USD MILLION)
TABLE 45 NORTH AMERICA MATERIAL REMOVAL TOOLS IN POWER TOOLS MARKET, BY REGION, 2015-2029 (USD MILLION)
TABLE 46 NORTH AMERICA MATERIAL REMOVAL TOOLS IN POWER TOOLS MARKET, BY TYPE, 2015-2029 (USD MILLION)
TABLE 47 NORTH AMERICA GRINDERS IN POWER TOOLS MARKET, BY TYPE, 2015-2029 (USD MILLION)
TABLE 48 NORTH AMERICA ELECTRIC CORDS AND PLUGS IN POWER TOOLS MARKET, BY REGION, 2015-2029 (USD MILLION)
TABLE 49 NORTH AMERICA CHISELS IN POWER TOOLS MARKET, BY REGION, 2015-2029 (USD MILLION)
TABLE 50 NORTH AMERICA ACCESSORIES IN POWER TOOLS MARKET, BY REGION, 2015-2029 (USD MILLION)
TABLE 51 NORTH AMERICA OTHERS IN POWER TOOLS MARKET, BY REGION, 2015-2029 (USD MILLION)
TABLE 52 NORTH AMERICA POWER TOOLS MARKET, BY MODE OF OPERATION, 2015-2029 (USD MILLION)
TABLE 53 NORTH AMERICA ELECTRIC IN POWER TOOLS MARKET, BY REGION, 2015-2029 (USD MILLION)
TABLE 54 NORTH AMERICA ELECTRIC IN POWER TOOLS MARKET, BY TYPE, 2015-2029 (USD MILLION)
TABLE 55 NORTH AMERICA LIQUID FUEL TOOL IN POWER TOOLS MARKET, BY REGION, 2015-2029 (USD MILLION)
TABLE 56 NORTH AMERICA HYDRAULIC IN POWER TOOLS MARKET, BY REGION, 2015-2029 (USD MILLION)
TABLE 57 NORTH AMERICA PNEUMATIC IN POWER TOOLS MARKET, BY REGION, 2015-2029 (USD MILLION)
TABLE 58 NORTH AMERICA POWDER-ACTUATED TOOLS IN POWER TOOLS MARKET, BY REGION, 2015-2029 (USD MILLION)
TABLE 59 NORTH AMERICA POWER TOOLS MARKET, BY APPLICATION, 2015-2029 (USD MILLION)
TABLE 60 NORTH AMERICA CONCRETE AND CONSTRUCTION IN POWER TOOLS MARKET, BY REGION, 2015-2029 (USD MILLION)
TABLE 61 NORTH AMERICA WOODWORKING IN POWER TOOLS MARKET, BY REGION, 2015-2029 (USD MILLION)
TABLE 62 NORTH AMERICA METALWORKING IN POWER TOOLS MARKET, BY REGION, 2015-2029 (USD MILLION)
TABLE 63 NORTH AMERICA WELDING IN POWER TOOLS MARKET, BY REGION, 2015-2029 (USD MILLION)
TABLE 64 NORTH AMERICA OTHERS IN POWER TOOLS MARKET, BY REGION, 2015-2029 (USD MILLION)
TABLE 65 NORTH AMERICA POWER TOOLS MARKET, BY MATERIAL, 2015-2029 (USD MILLION)
TABLE 66 NORTH AMERICA CONCRETE IN POWER TOOLS MARKET, BY REGION, 2015-2029 (USD MILLION)
TABLE 67 NORTH AMERICA WOOD/METAL IN POWER TOOLS MARKET, BY REGION, 2015-2029 (USD MILLION)
TABLE 68 NORTH AMERICA BRICK/BLOCK IN POWER TOOLS MARKET, BY REGION, 2015-2029 (USD MILLION)
TABLE 69 NORTH AMERICA GLASS IN POWER TOOLS MARKET, BY REGION, 2015-2029 (USD MILLION)
TABLE 70 NORTH AMERICA OTHERS IN POWER TOOLS MARKET, BY REGION, 2015-2029, (USD MILLION)
TABLE 71 NORTH AMERICA POWER TOOLS MARKET, BY END USER, 2015-2029 (USD MILLION)
TABLE 72 NORTH AMERICA INDUSTRIAL/PROFESSIONAL IN POWER TOOLS MARKET, BY REGION, 2015-2029 (USD MILLION)
TABLE 73 NORTH AMERICA INDUSTRIAL/PROFESSIONAL IN POWER TOOLS MARKET, BY TYPE, 2015-2029 (USD MILLION)
TABLE 74 NORTH AMERICA INDUSTRIAL/PROFESSIONAL IN POWER TOOLS MARKET, BY MODE OF OPERATION, 2015-2029 (USD MILLION)
TABLE 75 NORTH AMERICA RESIDENTIAL IN POWER TOOLS MARKET, BY REGION, 2015-2029 (USD MILLION)
TABLE 76 NORTH AMERICA RESIDENTIAL IN POWER TOOLS MARKET, BY MODE OF OPERATION, 2015-2029 (USD MILLION)
TABLE 77 NORTH AMERICA POWER TOOLS MARKET, BY SALES CHANNEL, 2015-2029 (USD MILLION)
TABLE 78 NORTH AMERICA INDIRECT SALES IN POWER TOOLS MARKET, BY REGION, 2015-2029 (USD MILLION)
TABLE 79 NORTH AMERICA DIRECT SALES IN POWER TOOLS MARKET, BY REGION, 2015-2029 (USD MILLION)
TABLE 80 NORTH AMERICA POWER TOOLS MARKET, BY REGION, 2015-2029 (USD MILLION)
TABLE 81 NORTH AMERICA POWER TOOLS MARKET, BY COUNTRY, 2015-2029 (USD MILLION)
TABLE 82 NORTH AMERICA POWER TOOLS MARKET, BY TYPE, 2015-2029 (USD MILLION)
TABLE 83 NORTH AMERICA SAWING AND CUTTING TOOLS IN POWER TOOLS MARKET, BY TYPE, 2015-2029 (USD MILLION)
TABLE 84 NORTH AMERICA DRILLING AND FASTENING TOOLS IN POWER TOOLS MARKET, BY TYPE, 2015-2029 (USD MILLION)
TABLE 85 NORTH AMERICA DEMOLITION TOOLS IN POWER TOOLS MARKET, BY TYPE, 2015-2029 (USD MILLION)
TABLE 86 NORTH AMERICA ROUTING TOOLS IN POWER TOOLS MARKET, BY TYPE, 2015-2029 (USD MILLION)
TABLE 87 NORTH AMERICA AIR-POWERED TOOLS IN POWER TOOLS MARKET, BY TYPE, 2015-2029 (USD MILLION)
TABLE 88 NORTH AMERICA MATERIAL REMOVAL TOOLS IN POWER TOOLS MARKET, BY TYPE, 2015-2029 (USD MILLION)
TABLE 89 NORTH AMERICA GRINDERS IN POWER TOOLS MARKET, BY TYPE, 2015-2029 (USD MILLION)
TABLE 90 NORTH AMERICA POWER TOOLS MARKET, BY MODE OF OPERATION, 2015-2029 (USD MILLION)
TABLE 91 NORTH AMERICA ELECTRIC IN POWER TOOLS MARKET, BY MODE OF OPERATION, 2015-2029 (USD MILLION)
TABLE 92 NORTH AMERICA POWER TOOLS MARKET, BY APPLICATION, 2015-2029 (USD MILLION)
TABLE 93 NORTH AMERICA POWER TOOLS MARKET, BY MATERIAL, 2015-2029 (USD MILLION)
TABLE 94 NORTH AMERICA POWER TOOLS MARKET, BY END USER, 2015-2029 (USD MILLION)
TABLE 95 NORTH AMERICA INDUSTRIAL/PROFESSIONAL IN POWER TOOLS MARKET, BY TYPE, 2015-2029 (USD MILLION)
TABLE 96 NORTH AMERICA INDUSTRIAL/PROFESSIONAL IN POWER TOOLS MARKET, BY MODE OF OPERATION, 2015-2029 (USD MILLION)
TABLE 97 NORTH AMERICA RESIDENTIAL IN POWER TOOLS MARKET, BY MODE OF OPERATION, 2015-2029 (USD MILLION)
TABLE 98 NORTH AMERICA POWER TOOLS MARKET, BY SALES CHANNEL, 2015-2029 (USD MILLION)
TABLE 99 U.S. POWER TOOLS MARKET, BY TYPE, 2015-2029 (USD MILLION)
TABLE 100 U.S. SAWING AND CUTTING TOOLS IN POWER TOOLS MARKET, BY TYPE, 2015-2029 (USD MILLION)
TABLE 101 U.S. DRILLING AND FASTENING TOOLS IN POWER TOOLS MARKET, BY TYPE, 2015-2029 (USD MILLION)
TABLE 102 U.S. DEMOLITION TOOLS IN POWER TOOLS MARKET, BY TYPE, 2015-2029 (USD MILLION)
TABLE 103 U.S. ROUTING TOOLS IN POWER TOOLS MARKET, BY TYPE, 2015-2029 (USD MILLION)
TABLE 104 U.S. AIR-POWERED TOOLS IN POWER TOOLS MARKET, BY TYPE, 2015-2029 (USD MILLION)
TABLE 105 U.S. MATERIAL REMOVAL TOOLS IN POWER TOOLS MARKET, BY TYPE, 2015-2029 (USD MILLION)
TABLE 106 U.S. GRINDERS IN POWER TOOLS MARKET, BY TYPE, 2015-2029 (USD MILLION)
TABLE 107 U.S. POWER TOOLS MARKET, BY MODE OF OPERATION, 2015-2029 (USD MILLION)
TABLE 108 U.S. ELECTRIC IN POWER TOOLS MARKET, BY MODE OF OPERATION, 2015-2029 (USD MILLION)
TABLE 109 U.S. POWER TOOLS MARKET, BY APPLICATION, 2015-2029 (USD MILLION)
TABLE 110 U.S. POWER TOOLS MARKET, BY MATERIAL, 2015-2029 (USD MILLION)
TABLE 111 U.S. POWER TOOLS MARKET, BY END USER, 2015-2029 (USD MILLION)
TABLE 112 U.S. INDUSTRIAL/PROFESSIONAL IN POWER TOOLS MARKET, BY TYPE, 2015-2029 (USD MILLION)
TABLE 113 U.S. INDUSTRIAL/PROFESSIONAL IN POWER TOOLS MARKET, BY MODE OF OPERATION, 2015-2029 (USD MILLION)
TABLE 114 U.S. RESIDENTIAL IN POWER TOOLS MARKET, BY MODE OF OPERATION, 2015-2029 (USD MILLION)
TABLE 115 U.S. POWER TOOLS MARKET, BY SALES CHANNEL, 2015-2029 (USD MILLION)
TABLE 116 CANADA POWER TOOLS MARKET, BY TYPE, 2015-2029 (USD MILLION)
TABLE 117 CANADA SAWING AND CUTTING TOOLS IN POWER TOOLS MARKET, BY TYPE, 2015-2029 (USD MILLION)
TABLE 118 CANADA DRILLING AND FASTENING TOOLS IN POWER TOOLS MARKET, BY TYPE, 2015-2029 (USD MILLION)
TABLE 119 CANADA DEMOLITION TOOLS IN POWER TOOLS MARKET, BY TYPE, 2015-2029 (USD MILLION)
TABLE 120 CANADA ROUTING TOOLS IN POWER TOOLS MARKET, BY TYPE, 2015-2029 (USD MILLION)
TABLE 121 CANADA AIR-POWERED TOOLS IN POWER TOOLS MARKET, BY TYPE, 2015-2029 (USD MILLION)
TABLE 122 CANADA MATERIAL REMOVAL TOOLS IN POWER TOOLS MARKET, BY TYPE, 2015-2029 (USD MILLION)
TABLE 123 CANADA GRINDERS IN POWER TOOLS MARKET, BY TYPE, 2015-2029 (USD MILLION)
TABLE 124 CANADA POWER TOOLS MARKET, BY MODE OF OPERATION, 2015-2029 (USD MILLION)
TABLE 125 CANADA ELECTRIC IN POWER TOOLS MARKET, BY MODE OF OPERATION, 2015-2029 (USD MILLION)
TABLE 126 CANADA POWER TOOLS MARKET, BY APPLICATION, 2015-2029 (USD MILLION)
TABLE 127 CANADA POWER TOOLS MARKET, BY MATERIAL, 2015-2029 (USD MILLION)
TABLE 128 CANADA POWER TOOLS MARKET, BY END USER, 2015-2029 (USD MILLION)
TABLE 129 CANADA INDUSTRIAL/PROFESSIONAL IN POWER TOOLS MARKET, BY TYPE, 2015-2029 (USD MILLION)
TABLE 130 CANADA INDUSTRIAL/PROFESSIONAL IN POWER TOOLS MARKET, BY MODE OF OPERATION, 2015-2029 (USD MILLION)
TABLE 131 CANADA RESIDENTIAL IN POWER TOOLS MARKET, BY MODE OF OPERATION, 2015-2029 (USD MILLION)
TABLE 132 CANADA POWER TOOLS MARKET, BY SALES CHANNEL, 2015-2029 (USD MILLION)
TABLE 133 MEXICO POWER TOOLS MARKET, BY TYPE, 2015-2029 (USD MILLION)
TABLE 134 MEXICO SAWING AND CUTTING TOOLS IN POWER TOOLS MARKET, BY TYPE, 2015-2029 (USD MILLION)
TABLE 135 MEXICO DRILLING AND FASTENING TOOLS IN POWER TOOLS MARKET, BY TYPE, 2015-2029 (USD MILLION)
TABLE 136 MEXICO DEMOLITION TOOLS IN POWER TOOLS MARKET, BY TYPE, 2015-2029 (USD MILLION)
TABLE 137 MEXICO ROUTING TOOLS IN POWER TOOLS MARKET, BY TYPE, 2015-2029 (USD MILLION)
TABLE 138 MEXICO AIR-POWERED TOOLS IN POWER TOOLS MARKET, BY TYPE, 2015-2029 (USD MILLION)
TABLE 139 MEXICO MATERIAL REMOVAL TOOLS IN POWER TOOLS MARKET, BY TYPE, 2015-2029 (USD MILLION)
TABLE 140 MEXICO GRINDERS IN POWER TOOLS MARKET, BY TYPE, 2015-2029 (USD MILLION)
TABLE 141 MEXICO POWER TOOLS MARKET, BY MODE OF OPERATION, 2015-2029 (USD MILLION)
TABLE 142 MEXICO ELECTRIC IN POWER TOOLS MARKET, BY MODE OF OPERATION, 2015-2029 (USD MILLION)
TABLE 143 MEXICO POWER TOOLS MARKET, BY APPLICATION, 2015-2029 (USD MILLION)
TABLE 144 MEXICO POWER TOOLS MARKET, BY MATERIAL, 2015-2029 (USD MILLION)
TABLE 145 MEXICO POWER TOOLS MARKET, BY END USER, 2015-2029 (USD MILLION)
TABLE 146 MEXICO INDUSTRIAL/PROFESSIONAL IN POWER TOOLS MARKET, BY TYPE, 2015-2029 (USD MILLION)
TABLE 147 MEXICO INDUSTRIAL/PROFESSIONAL IN POWER TOOLS MARKET, BY MODE OF OPERATION, 2015-2029 (USD MILLION)
TABLE 148 MEXICO RESIDENTIAL IN POWER TOOLS MARKET, BY MODE OF OPERATION, 2015-2029 (USD MILLION)
TABLE 149 MEXICO POWER TOOLS MARKET, BY SALES CHANNEL, 2015-2029 (USD MILLION)
List of Figure
FIGURE 1 NORTH AMERICA POWER TOOLS MARKET: SEGMENTATION
FIGURE 2 NORTH AMERICA POWER TOOLS MARKET: DATA TRIANGULATION
FIGURE 3 NORTH AMERICA POWER TOOLS MARKET: DROC ANALYSIS
FIGURE 4 NORTH AMERICA POWER TOOLS MARKET: REGIONAL VS COUNTRY MARKET ANALYSIS
FIGURE 5 NORTH AMERICA POWER TOOLS MARKET: COMPANY RESEARCH ANALYSIS
FIGURE 6 NORTH AMERICA POWER TOOLS MARKET: INTERVIEW DEMOGRAPHICS
FIGURE 7 NORTH AMERICA POWER TOOLS MARKET: DBMR MARKET POSITION GRID
FIGURE 8 NORTH AMERICA POWER TOOLS MARKET: VENDOR SHARE ANALYSIS
FIGURE 9 NORTH AMERICA POWER TOOLS MARKET: MARKET APPLICATION COVERAGE GRID
FIGURE 10 NORTH AMERICA POWER TOOLS MARKET: SEGMENTATION
FIGURE 11 INCREASE IN THE GROWTH OF CORDLESS POWER TOOLS IS EXPECTED TO DRIVE NORTH AMERICA POWER TOOLS MARKET IN THE FORECAST PERIOD OF 2022 TO 2029
FIGURE 12 SAWING AND CUTTING TOOLS SEGMENT IS EXPECTED TO ACCOUNT FOR THE LARGEST SHARE OF NORTH AMERICA POWER TOOLS MARKET IN 2022 & 2029
FIGURE 13 DRIVERS, RESTRAINTS, OPPORTUNITIES, AND CHALLENGES OF NORTH AMERICA POWER TOOLS MARKET
FIGURE 14 NORTH AMERICA POWER TOOLS MARKET: BY TYPE, 2022
FIGURE 15 NORTH AMERICA POWER TOOLS MARKET: BY MODE OF OPERATION, 2021
FIGURE 16 NORTH AMERICA POWER TOOLS MARKET: BY APPLICATION, 2021
FIGURE 17 NORTH AMERICA POWER TOOLS MARKET: BY MATERIAL, 2021
FIGURE 18 NORTH AMERICA POWER TOOLS MARKET: BY END USER, 2021
FIGURE 19 NORTH AMERICA POWER TOOLS MARKET: BY SALES CHANNEL, 2021
FIGURE 20 NORTH AMERICA POWER TOOLS MARKET: SNAPSHOT (2021)
FIGURE 21 NORTH AMERICA POWER TOOLS MARKET: BY COUNTRY (2021)
FIGURE 22 NORTH AMERICA POWER TOOLS MARKET: BY COUNTRY (2022 & 2029)
FIGURE 23 NORTH AMERICA POWER TOOLS MARKET: BY COUNTRY (2021 & 2029)
FIGURE 24 NORTH AMERICA POWER TOOLS MARKET: BY TYPE (2022-2029)
FIGURE 25 NORTH AMERICA POWER TOOLS MARKET: SNAPSHOT (2021)
FIGURE 26 NORTH AMERICA POWER TOOLS MARKET: BY COUNTRY (2021)
FIGURE 27 NORTH AMERICA POWER TOOLS MARKET: BY COUNTRY (2022 & 2029)
FIGURE 28 NORTH AMERICA POWER TOOLS MARKET: BY COUNTRY (2021 & 2029)
FIGURE 29 NORTH AMERICA POWER TOOLS MARKET: BY TYPE (2022-2029)
FIGURE 30 EUROPE POWER TOOLS MARKET: COMPANY SHARE 2021 (%)
North America Power Tools Market, Supply Chain Analysis and Ecosystem Framework
To support market growth and help clients navigate the impact of geopolitical shifts, DBMR has integrated in-depth supply chain analysis into its North America Power Tools Market research reports. This addition empowers clients to respond effectively to global changes affecting their industries. The supply chain analysis section includes detailed insights such as North America Power Tools Market consumption and production by country, price trend analysis, the impact of tariffs and geopolitical developments, and import and export trends by country and HSN code. It also highlights major suppliers with data on production capacity and company profiles, as well as key importers and exporters. In addition to research, DBMR offers specialized supply chain consulting services backed by over a decade of experience, providing solutions like supplier discovery, supplier risk assessment, price trend analysis, impact evaluation of inflation and trade route changes, and comprehensive market trend analysis.
Data collection and base year analysis are done using data collection modules with large sample sizes. The stage includes obtaining market information or related data through various sources and strategies. It includes examining and planning all the data acquired from the past in advance. It likewise envelops the examination of information inconsistencies seen across different information sources. The market data is analysed and estimated using market statistical and coherent models. Also, market share analysis and key trend analysis are the major success factors in the market report. To know more, please request an analyst call or drop down your inquiry.
The key research methodology used by DBMR research team is data triangulation which involves data mining, analysis of the impact of data variables on the market and primary (industry expert) validation. Data models include Vendor Positioning Grid, Market Time Line Analysis, Market Overview and Guide, Company Positioning Grid, Patent Analysis, Pricing Analysis, Company Market Share Analysis, Standards of Measurement, Global versus Regional and Vendor Share Analysis. To know more about the research methodology, drop in an inquiry to speak to our industry experts.
Data Bridge Market Research is a leader in advanced formative research. We take pride in servicing our existing and new customers with data and analysis that match and suits their goal. The report can be customized to include price trend analysis of target brands understanding the market for additional countries (ask for the list of countries), clinical trial results data, literature review, refurbished market and product base analysis. Market analysis of target competitors can be analyzed from technology-based analysis to market portfolio strategies. We can add as many competitors that you require data about in the format and data style you are looking for. Our team of analysts can also provide you data in crude raw excel files pivot tables (Fact book) or can assist you in creating presentations from the data sets available in the report.


