
North America Refractories Market
Market Size in USD Billion
 USD
8.70 Billion
USD
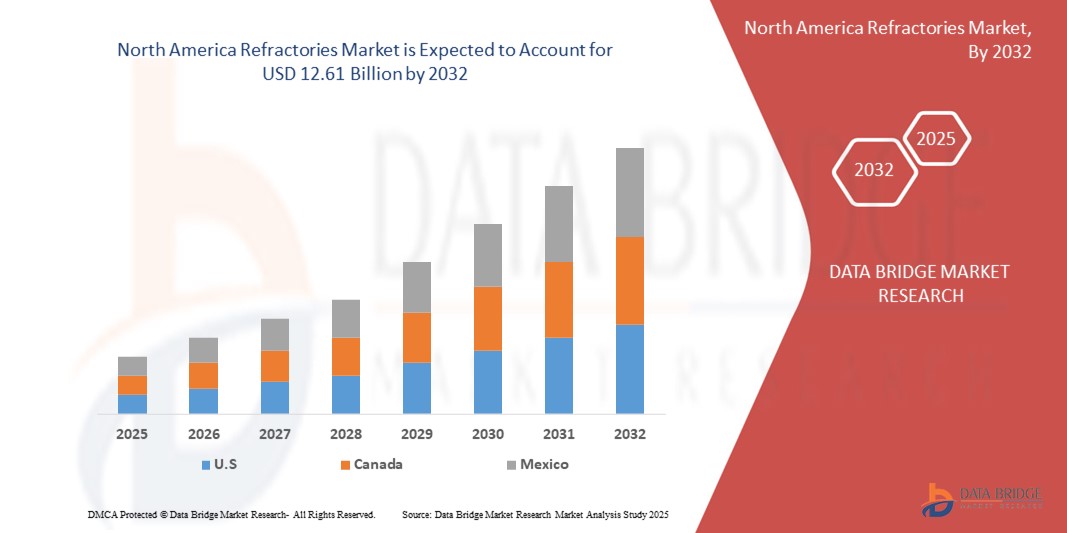
12.61 Billion
2024
2032
USD
8.70 Billion
USD
12.61 Billion
2024
2032
| 2025 - 2032 | |
| USD 8.70 Billion | |
| USD 12.61 Billion | |
| % | |
|
Refractories Market Size
- The North America refractories market size was valued at USD 8.74 billion in 2024 and is expected to reach USD 12.61 billion by 2032, at a CAGR of 4.70% during the forecast period
- This growth is driven by factors such as the increasing adoption of automation across manufacturing industries, rising demand for quality inspection and defect detection, and technological advancements in machine learning and image processing
Refractories Market Analysis
- Refractories are essential materials used in high-temperature industrial processes to line furnaces, kilns, incinerators, and reactors, providing thermal insulation and resistance to chemical attack, particularly in industries like steel, cement, glass, and petrochemicals
- The demand for refractories in North America is primarily driven by the region’s established steel and cement manufacturing industries, along with increasing investments in infrastructure and energy sectors requiring high-performance refractory solutions
- The U.S. leads the North American refractories market, accounting for roughly 70% of the regional market share. This leadership is due to the country’s large industrial base, modernization of manufacturing facilities, and adoption of advanced refractory materials for improved efficiency and sustainability
- Canada is emerging as a fast-growing market with around 20% regional share, driven by growing industrial production, government support for resource extraction and energy projects, and increased use of refractories in the aluminum and chemical sectors
- The iron and steel manufacturing segment is expected to dominate the North America refractories market with the largest share of approximately 50% in 2025, driven by the industry's reliance on high-performance refractory materials to withstand extreme temperatures during smelting, casting, and heat treatment processes
Report Scope and Refractories Market Segmentation
|
Attributes |
Refractories Key Market Insights |
|
Segments Covered |
|
|
Countries Covered |
North America
|
|
Key Market Players |
|
|
Market Opportunities |
|
|
Value Added Data Infosets |
In addition to the insights on market scenarios such as market value, growth rate, segmentation, geographical coverage, and major players, the market reports curated by the Data Bridge Market Research also include import export analysis, production capacity overview, production consumption analysis, price trend analysis, climate change scenario, supply chain analysis, value chain analysis, raw material/consumables overview, vendor selection criteria, PESTLE Analysis, Porter Analysis, and regulatory framework. |
Refractories Market Trends
“Shift Toward Advanced, Energy-Efficient Refractory Solutions in Industrial Manufacturing”
- One prominent trend in the North America refractories market is the increasing shift toward advanced, energy-efficient refractory materials that enhance thermal performance while reducing energy consumption and emissions in high-temperature industrial processes
- These innovative materials are designed to withstand extreme operating environments while improving the longevity and efficiency of equipment in industries such as steel, cement, and petrochemicals
- For instance, manufacturers are developing low thermal conductivity and lightweight refractories that reduce heat loss and support sustainable industrial operations. companies are also incorporating recycled materials and eco-friendly binders to meet tightening environmental regulations
- These advancements are reshaping the refractories industry in North America, as end-users increasingly demand solutions that align with decarbonization goals, reduce maintenance costs, and improve the operational efficiency of furnaces, kilns, and reactors
Refractories Market Dynamics
Driver
“Growing Demand for High-Performance Materials in Industrial Manufacturing”
- The increasing need for durable, high-performance materials in industrial manufacturing is significantly contributing to the rising demand for advanced refractory products across North America
- As manufacturing sectors such as steel, cement, glass, and petrochemicals push for greater energy efficiency and production reliability, refractories play a vital role in enabling operations under extreme thermal and chemical conditions
- Refractories are essential in lining furnaces, kilns, incinerators, and reactors, and their performance directly impacts operational lifespan and cost-effectiveness of these high-temperature processes
For instance,
- In November 2023, RHI Magnesita announced an expansion of its U.S. operations with a focus on producing next-generation refractory materials tailored for energy-intensive industries, citing growing demand for materials that extend service life and reduce maintenance downtime
- As industries increasingly prioritize operational resilience and cost control, the demand for innovative and long-lasting refractory solutions continues to grow across North America’s industrial landscape
Opportunity
“Rising Demand for Sustainable and Energy-Efficient Refractory Solutions”
- The growing emphasis on sustainability and energy efficiency presents a key opportunity for innovation in the North America refractories market. Manufacturers are increasingly focusing on developing refractories that minimize heat loss, reduce emissions, and align with environmental regulations
- Energy-intensive sectors such as steel and cement are under pressure to reduce their carbon footprint, driving demand for advanced refractory materials that enhance thermal insulation and operational efficiency
- Refractories with longer lifespans, improved recyclability, and lower environmental impact are gaining traction among industries aiming to meet decarbonization goals
For instance,
- In August 2024, Saint-Gobain launched a new line of eco-designed refractory products in North America featuring enhanced energy efficiency and reduced carbon emissions. These products are designed to support sustainable manufacturing practices in high-temperature applications such as rotary kilns and blast furnaces
- As environmental regulations tighten and corporate sustainability goals become more ambitious, the demand for next-generation, environmentally responsible refractories is expected to grow significantly, opening new avenues for product innovation and market expansion
Restraint/Challenge
“Volatility in Raw Material Prices and Supply Chain Disruptions”
- A key challenge in the North America refractories market is the volatility in prices of critical raw materials such as bauxite, magnesia, alumina, and graphite, which are essential for manufacturing refractory products
- Fluctuations in global supply chains, trade restrictions, and geopolitical tensions have led to inconsistent availability and price surges, impacting production costs and supply reliability for manufacturers in the region
- Many of these raw materials are imported from regions such as China and South America, making North American producers vulnerable to international market instability and transportation disruptions
For instance,
- In September 2024, the World Refractories Association reported a 25% year-on-year increase in magnesia prices due to supply constraints from key export countries, particularly China, combined with increased freight costs. This price hike affected several North American refractory manufacturers, forcing them to either raise product prices or absorb higher input costs
- Such unpredictability in raw material sourcing presents a substantial barrier to consistent product pricing and long-term contract fulfillment, posing risks to profitability and limiting growth, especially for mid-sized and specialized refractory producers
Refractories Market Scope
The market is segmented on the basis of alkalinity, product type, form type, fusion temperature, application, and technology.
|
Segmentation |
Sub-Segmentation |
|
By Alkalinity |
|
|
By Form Type |
|
|
By Product Type |
|
|
By Fusion Temperature |
|
|
By Applications |
|
|
By Technology |
|
In 2025, the iron and steel manufacturing segment is projected to dominate the market with the largest share in the application segment
In 2025, the iron and steel manufacturing segment is projected to dominate the North America refractories market with the largest share of approximately 50%, driven by the sector’s heavy reliance on high-performance refractory materials for critical processes such as smelting, casting, and heat treatment. Refractories play a vital role in maintaining operational efficiency and extending equipment life in blast furnaces, ladles, and converters. The growth of domestic steel production in the U.S., spurred by infrastructure investments and the reshoring of manufacturing, along with demand from automotive, construction, and energy sectors, is significantly boosting refractory consumption.
The acidic and neutral refractories is expected to account for the largest share during the forecast period in alkalinity segments
In 2025, the acidic and neutral refractories segment is projected to dominate the North America refractories market, accounting for approximately 70.1% of the market share. This dominance is attributed to the widespread application of materials such as silica, alumina, and chromite in industries like steel, glass, and cement, where resistance to acidic environments is crucial. The versatility and cost-effectiveness of these refractories, coupled with advancements in manufacturing technologies enhancing their performance and energy efficiency, have solidified their leading position in the market.
Refractories Market Regional Analysis
“U.S. Holds the Largest Share in the North America Refractories Market”
- The U.S. leads the North America refractories market with approximately 70% of the regional market share, driven by its well-established industrial base and advanced manufacturing infrastructure
- The country’s strong steel, cement, and glass industries, along with increased modernization efforts, support high demand for refractory materials essential for high-temperature industrial processes
- Growing investments in automation, energy-efficient manufacturing, and environmental compliance further accelerate the adoption of advanced refractory solutions in the U.S.
- Robust R&D activities, presence of key refractory manufacturers, and government initiatives promoting sustainable industrial practices contribute to maintaining the U.S.’s dominant position in the North America refractories market
“Canada is Projected to Register the Highest CAGR in the North America Refractories Market”
- Canada is expected to witness the highest compound annual growth rate (CAGR) in the North America refractories market, driven by increased investments in industrial automation and modernization of manufacturing facilities
- Government initiatives aimed at enhancing manufacturing infrastructure and promoting sustainable industrial practices are accelerating the adoption of advanced refractory materials and technologies across various sectors
- The demand for high-quality refractory solutions is rising particularly in the mining, cement, and steel industries, which are key contributors to Canada’s industrial output
- Strong collaboration between public and private sectors in research and development, along with growing focus on energy efficiency and emissions reduction, supports rapid market expansion in Canada’s refractory industry
Refractories Market Share
The market competitive landscape provides details by competitor. Details included are company overview, company financials, revenue generated, market potential, investment in research and development, new market initiatives, global presence, production sites and facilities, production capacities, company strengths and weaknesses, product launch, product width and breadth, application dominance. The above data points provided are only related to the companies' focus related to market.
The Major Market Leaders Operating in the Market Are:
- Saint-Gobain (France)
- ALMATIS (Germany)
- Alteo Group (France)
- ALLIED MINERAL PRODUCTS (U.S.)
- Puyang Refractories Group Co.,Ltd. (China)
- HWI (China)
- AluChem (U.S.)
- RHI Magnesita GmbH (Austria)
- Morgan Advanced Materials (U.K.)
- SHINAGAWA REFRACTORIES CO., LTD. (Japan)
- Krosaki Harima Corporation (Japan)
- CoorsTek Inc. (U.S.)
- Vesuvius (U.K.)
- Refratechnik. (Germany)
- Imerys (U.S.)
- IFGL Refractories Limited. (India)
- TYK CORPORATION (Japan)
Latest Developments in North America Refractories Market
- In May 2024, the adoption of energy-efficient Electric Arc Furnaces (EAFs) in the U.S. has accelerated, driving demand for high-quality refractory materials capable of withstanding extreme conditions. EAFs offer lower energy consumption and reduced emissions, making them a preferred choice for sustainable steel production. The shift toward EAF technology aligns with global efforts to decarbonize the steel industry, with major manufacturers investing in advanced refractory solutions to enhance efficiency and durability in high-temperature environments
- In April 2024, RHI Magnesita, an Austria-based company, announced its plan to acquire Resco Group, a U.S.-based alumina producer, for up to $430 million. This acquisition is expected to expand product offerings and enhance supply chain efficiency across North America. Resco Group specializes in shaped and unshaped refractories, serving industries such as petrochemicals, cement, aluminum, and steelmaking. The deal aligns with RHI Magnesita’s strategic growth trajectory, aiming to increase local production and strengthen market presence. The transaction is anticipated to close in the second half of 2024
- In March 2024, approximately 20% of major refractory manufacturers in North America integrated smart monitoring systems to enhance real-time data tracking on temperature and wear. These systems leverage IoT sensors and AI-driven analytics to optimize predictive maintenance, reducing downtime and operational costs. The adoption of advanced monitoring technologies has led to a 25% boost in efficiency, improving material longevity and process stability in high-temperature industries such as steelmaking, cement production, and glass manufacturing
- In February 2024, the adoption of self-healing refractory materials grew by 15%, particularly in the steel and energy sectors. These advanced materials enhance lining lifespan and significantly reduce maintenance costs by utilizing in-situ healing mechanisms that repair cracks and wear over time. The technology integrates high-entropy ceramics and medium-entropy oxides, improving thermal resistance and structural integrity in high-temperature industrial applications. As demand for cost-effective and durable refractory solutions rises, manufacturers continue to refine self-healing capabilities for broader industry adoption
- In January 2024, North American refractory manufacturers and distributors expanded their e-commerce distribution channels, enhancing online accessibility for customers. This shift includes detailed product information, efficient delivery systems, and streamlined procurement processes via digital platforms. The adoption of advanced e-commerce strategies aims to improve customer engagement, reduce transactional friction, and optimize supply chain efficiency. As more manufacturers embrace digital transformation, the refractory industry is expected to see increased market reach and operational improvements in the coming year
SKU-

- Interactive Data Analysis Dashboard
- Company Analysis Dashboard for high growth potential opportunities
- Research Analyst Access for customization & queries
- Competitor Analysis with Interactive dashboard
- Latest News, Updates & Trend analysis
- Harness the Power of Benchmark Analysis for Comprehensive Competitor Tracking
North America Refractories Market, Supply Chain Analysis and Ecosystem Framework
To support market growth and help clients navigate the impact of geopolitical shifts, DBMR has integrated in-depth supply chain analysis into its North America Refractories Market research reports. This addition empowers clients to respond effectively to global changes affecting their industries. The supply chain analysis section includes detailed insights such as North America Refractories Market consumption and production by country, price trend analysis, the impact of tariffs and geopolitical developments, and import and export trends by country and HSN code. It also highlights major suppliers with data on production capacity and company profiles, as well as key importers and exporters. In addition to research, DBMR offers specialized supply chain consulting services backed by over a decade of experience, providing solutions like supplier discovery, supplier risk assessment, price trend analysis, impact evaluation of inflation and trade route changes, and comprehensive market trend analysis.
Data collection and base year analysis are done using data collection modules with large sample sizes. The stage includes obtaining market information or related data through various sources and strategies. It includes examining and planning all the data acquired from the past in advance. It likewise envelops the examination of information inconsistencies seen across different information sources. The market data is analysed and estimated using market statistical and coherent models. Also, market share analysis and key trend analysis are the major success factors in the market report. To know more, please request an analyst call or drop down your inquiry.
The key research methodology used by DBMR research team is data triangulation which involves data mining, analysis of the impact of data variables on the market and primary (industry expert) validation. Data models include Vendor Positioning Grid, Market Time Line Analysis, Market Overview and Guide, Company Positioning Grid, Patent Analysis, Pricing Analysis, Company Market Share Analysis, Standards of Measurement, Global versus Regional and Vendor Share Analysis. To know more about the research methodology, drop in an inquiry to speak to our industry experts.
Data Bridge Market Research is a leader in advanced formative research. We take pride in servicing our existing and new customers with data and analysis that match and suits their goal. The report can be customized to include price trend analysis of target brands understanding the market for additional countries (ask for the list of countries), clinical trial results data, literature review, refurbished market and product base analysis. Market analysis of target competitors can be analyzed from technology-based analysis to market portfolio strategies. We can add as many competitors that you require data about in the format and data style you are looking for. Our team of analysts can also provide you data in crude raw excel files pivot tables (Fact book) or can assist you in creating presentations from the data sets available in the report.


