
North America Smart Hospital Market Analysis and Insights
Smart medical devices are important medical tools that are used by physicians to monitor the vital physiological parameters of various diseases. These smart devices are intended for enhancing patient care quality by monitoring real-time data and communicating the same to the physician through a connected device.
The increasing adoption of smartphones and demand for smartphone-compatible medical devices and wearable devices are driving the market growth. Advanced methodologies present in the field are also propelling the market growth.
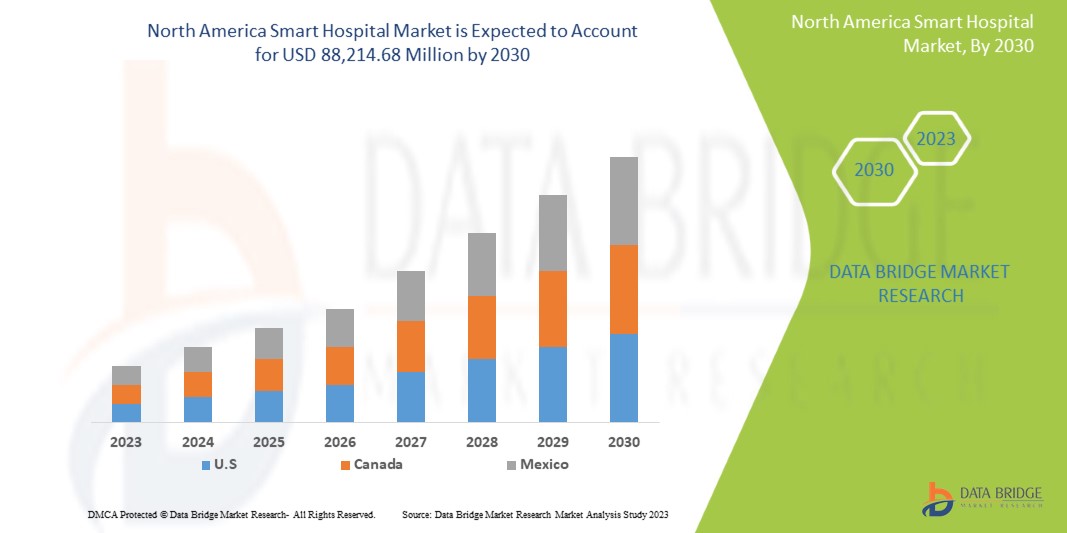
Data Bridge Market Research analyzes that the North America smart hospital market is expected to reach a value of USD 88,214.68 million by 2030, at a CAGR of 20.9% during the forecast period. Component accounts for the largest segment in the market due to the rising demand for smart devices and increasing healthcare expenditure, which has accelerated the demand for smart medical devices.
|
Report Metric |
Details |
|
Forecast Period |
2023 to 2030 |
|
Base Year |
2022 |
|
Historic Years |
2021 (Customisable to 2020-2015) |
|
Quantitative Units |
Revenue in USD Million, and Pricing in USD |
|
Segments Covered |
By Component (Hardware, Systems and Software, and Services), Connectivity (Wired and Wireless), Technology (Artificial Intelligence, Internet of Things, Augmented Reality, Big Data, Cloud Computing, and Others), Application (Remote Medicine Management, Medical Connected Imaging, Medical Assistance, Outpatient Vigilance, Electronic Health Record & Clinical Workflow, Pharmacy Automation, Robot-Assisted Surgery, Virtual Nursing Assistant, Workflow Assistance, Administrative Workflow Assistance, Fraud Detection, Image Analysis, Cybersecurity, Dosage Error Reduction, Clinical Trial Participant Identifier, Preliminary Diagnosis, Connected Machines, Non-Invasive Diagnosis, Precision Medicine, Research, and Others), Distribution Channel (Direct Tender, Retail Sales, and Third Party Distributor) |
|
Countries Covered |
U.S., Canada, and Mexico |
|
Market Players Covered |
F. Hoffman-La Roche Ltd, Qualcomm Technologies, Inc., General Electric Company, Koninklijke Philips N.V., McKesson Corporation, Siemens, Intel Corporation, Microsoft, Honeywell International, Medtronic, DXC Technology Company, SAMSUNG ELECTRONICS AMERICA, Oracle, Apple, Inc., CitiusTech Inc, Allscripts Healthcare, LLC, AirStrip Technologies, Inc., AVISA Smart Hospital, Itransition, TERSO SOLUTIONS, INC., Cloudphysician Healthcare Pvt. Ltd., physiQ, ThoughtWire, AdhereTech, Diabetizer GmbH, Itrex Group, and Qdocs among others. |
Market Definition
The smart hospital takes a holistic approach to infrastructure modernization by integrating digital and physical assets into a unified framework that connects the institution's disparate clinical and business workflows and resources. As a result, smart hospital gains broad access to data across the healthcare ecosystem, from hospital to clinic to provider and beyond, as well as faster clinical workflows, smoother patient journeys, and the ability to adopt new life-saving innovations in the market.
This market is growing in the forecast year due to several reasons such as the rising players in the market and the availability of advanced products; along with this, manufacturers are engaged in R&D activities for launching novel technology-based smart devices in the market.
North America Smart Hospital Market Dynamics
This section deals with understanding the market drivers, advantages, opportunities, restraints, and challenges. All of this is discussed in detail below:
DRIVERS
- Increase in the Prevalence of Chronic Diseases
With the rising economic growth, people are more interested in long-term health and wellness. The encumbrance of chronic disease is briskly increasing across the globe. In most western countries, the major reason behind the increasing number of chronic diseases is the continuous increase in the aged population. The increasing rates of diseases are directly proportional to the growth of better healthcare which is developing in every country. With growing infectious diseases, the mortality rate is increasing rapidly.
Because of the sedentary lifestyle of people, the prevalence of lifestyle-associated disorders such as hypertension and diabetes is rising nowadays. Thus, the rising prevalence of chronic diseases with the growing integration of healthcare data with portable devices is expected to demand proper health management, leading to the anticipated increase in the demand for e-health services, which will propel the market growth in the forecast period.
- Escalation in Innovation and Technologies
Acceleration in technology development in the healthcare sector has tremendously increased in the last few years. Advancement in technology in hospital and pharmacy automation supports the meticulous and safe handling of patients during the management of a disease.
Moreover, innovation and upgradation in pharmacy and hospital automation assist in the precise and rapid result of disease diagnosis. Along with that, innovation in pharmacy and hospital automation also provides the cost-effectiveness of technology-based therapeutic tools during disease treatment.
The innovation and advancement in technology have upgraded the surgical robotics systems in all prospects including advanced features such as better resolution, increased area coverage, flexibility, advanced software, accessories, and spatial arrangements among more.
The advancement in technologies brings many advantages to the patient’s treatment program with improvements in clinical efficiency and increased patient safety. Thus, technological advancement and development are anticipated to bolster market growth.
OPPORTUNITY
-
Growing Healthcare Expenditure
Production of automated medical devices lowers product uncertainty and increases performance efficiency. In today's healthcare scenario with advanced equipment and integration of cameras, sensors, and computer technologies, highly efficient error detection is achieved and, in many cases, automatic correction.
Over the last decade, healthcare expenditure has been rising up dramatically for better patient healthcare service. The fundamental purpose behind growing expenditure is to provide appropriate, affordable, and high-quality automated pharmacy and hospital services.
RESTRAINT/CHALLENGE
- Reluctance Among Healthcare Organizations to Adopt Automation Systems
Many healthcare professionals and even patients often do not feel comfortable adopting pharmacy automation systems even after knowing about their benefits. They remain hesitant to embrace or accept any IT-based management strategy.
Thus, the reluctance among healthcare organizations to implement pharmacy automation systems acts as a restraint to market growth.
Recent Developments
- In December 2022, Microsoft announced HoloLens 2 bringing new immersive collaboration tools to industry metaversion customers. HoloLens 2 enables the team to work safely and improve patient care, reducing time to care. With HoloLens 2, healthcare professionals can connect with remote specialists, retrieve patient data and go beyond X-rays to view MRI images in 3D at the point of care. This new tool has helped the company to increase the demand for its services.
- In November 2022, Qualcomm Technologies, Inc. announced the Qualcomm Innovators Development Kit, which enables developers to work with various Qualcomm Technologies software solutions to minimize time to market and increase customization. This Qualcomm Innovators development kit is initially available to select universities and research institutes for on-device machine learning applications and will expand in the future to other developer segments such as security, multimedia, embedded computing, and more.
North America Smart Hospital Market Scope
The North America smart hospital market is categorized into five notable segments based on component, connectivity, technology, application, and distribution channel. The growth among segments helps you analyze niche pockets of growth and strategies to approach the market and determine your core application areas and the difference in your target markets.
COMPONENT
- HARDWARE
- SYSTEMS AND SOFTWARE
- SERVICES
Based on component, the market is segmented into hardware, systems and software, and services.
CONNECTIVITY
- WIRED
- WIRELESS
Based on connectivity, the market is segmented into wired and wireless.
TECHNOLOGY
- ARTIFICIAL INTELLIGENCE
- INTERNET OF THINGS
- BIG DATA
- AUGMENTED REALITY (AR)
- CLOUD COMPUTING
- OTHERS
Based on technology, the market is segmented into artificial intelligence, internet of things, augmented reality, big data, cloud computing, and others.
APPLICATION
- REMOTE MEDICINE MANAGEMENT
- MEDICAL CONNECTED IMAGING
- MEDICAL ASSISTANCE
- OUTPATIENT VIGILANCE
- ELECTRONIC HEALTH RECORD & CLINICAL WORKFLOW
- PHARMACY AUTOMATION
- ROBOT-ASSISTED SURGERY
- VIRTUAL NURSING ASSISTANT
- WORKFLOW ASSISTANCE
- ADMINISTRATIVE WORKFLOW ASSISTANCE
- FRAUD DETECTION
- IMAGE ANALYSIS
- CYBERSECURITY
- DOSAGE ERROR REDUCTION
- CLINICAL TRIAL PARTICIPANT IDENTIFIER
- PRELIMINARY DIAGNOSIS
- CONNECTED MACHINES
- NON-INVASIVE DIAGNOSIS
- PRECISION MEDICINE
- RESEARCH
- OTHERS
Based on application, the market is segmented into remote medicine management, medical connected imaging, medical assistance, outpatient vigilance, electronic health record & clinical workflow, pharmacy automation, robot-assisted surgery, virtual nursing assistant, workflow assistance, administrative workflow assistance, fraud detection, image analysis, cybersecurity, dosage error reduction, clinical trial participant identifier, preliminary diagnosis, connected machines, non-invasive diagnosis, precision medicine, research, and others.
DISTRIBUTION CHANNEL
- DIRECT TENDER
- RETAIL SALES
- THIRD PARTY DISTRIBUTOR
Based on distribution channel, the market is segmented into direct tender, retail sales, and third party distributor.
North America Smart Hospital Market Regional Analysis/Insights
The North America smart hospital market is categorized into five notable segments based on component, connectivity, technology, application, and distribution channel.
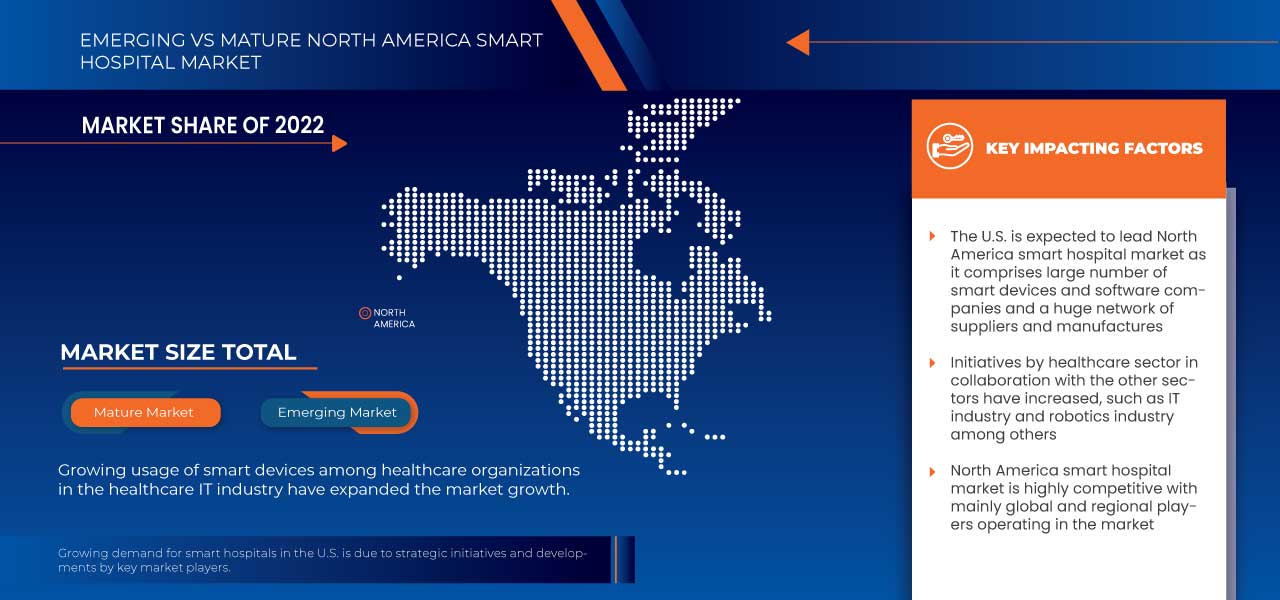
The countries covered in this market report are the U.S., Canada, and Mexico.
North America is dominating the North America market due to the presence of key market players in the largest consumer market with high GDP. The U.S. dominates the North America region due to the rise in technological advancement in the healthcare industry.
The country section of the report also provides individual market impacting factors and changes in regulation in the market domestically that impact the current and future trends of the market. Data points such as new sales, replacement sales, country demographics, regulatory acts, and import-export tariffs are some of the major pointers used to forecast the market scenario for individual countries. Also, the presence and availability of North America brands and their challenges faced due to large or scarce competition from local and domestic brands, and the impact of sales channels are considered while providing forecast analysis of the country data.
Competitive Landscape and North America Smart Hospital Market Share Analysis
The North America smart hospital market competitive landscape provides details by competitor. Details included are company overview, company financials, revenue generated, market potential, investment in R&D, new market initiatives, production sites and facilities, company strengths and weaknesses, product launch, product approvals, product width and breadth, application dominance, and product type lifeline curve. The above data points provided are only related to the company’s focus on the market.
Some of the major players operating in the market are F. Hoffman-La Roche Ltd, Qualcomm Technologies, Inc., General Electric Company, Koninklijke Philips N.V., McKesson Corporation, Siemens, Intel Corporation, Microsoft, Honeywell International, Medtronic, DXC Technology Company, SAMSUNG ELECTRONICS AMERICA, Oracle, Apple, Inc., CitiusTech Inc, Allscripts Healthcare, LLC, AirStrip Technologies, Inc., AVISA Smart Hospital, Itransition, TERSO SOLUTIONS, INC., Cloudphysician Healthcare Pvt. Ltd., physiQ, ThoughtWire, AdhereTech, Diabetizer GmbH, Itrex Group, and Qdocs among others.
SKU-

- Interactive Data Analysis Dashboard
- Company Analysis Dashboard for high growth potential opportunities
- Research Analyst Access for customization & queries
- Competitor Analysis with Interactive dashboard
- Latest News, Updates & Trend analysis
- Harness the Power of Benchmark Analysis for Comprehensive Competitor Tracking
Table of Content
1 INTRODUCTION
1.1 OBJECTIVES OF THE STUDY
1.2 MARKET DEFINITION
1.3 OVERVIEW OF NORTH AMERICA SMART HOSPITAL MARKET
1.4 LIMITATIONS
1.5 MARKETS COVERED
2 MARKET SEGMENTATION
2.1 MARKETS COVERED
2.2 GEOGRAPHICAL SCOPE
2.3 YEARS CONSIDERED FOR THE STUDY
2.4 CURRENCY AND PRICING
2.5 DBMR TRIPOD DATA VALIDATION MODEL
2.6 MULTIVARIATE MODELLING
2.7 PRODUCT TYPE LIFELINE CURVE
2.8 PRIMARY INTERVIEWS WITH KEY OPINION LEADERS
2.9 DBMR MARKET POSITION GRID
2.1 MARKET APPLICATION COVERAGE GRID
2.11 VENDOR SHARE ANALYSIS
2.12 SECONDARY SOURCES
2.13 ASSUMPTIONS
3 EXECUTIVE SUMMARY
4 PREMIUM INSIGHTS
4.1 PESTEL ANALYSIS
4.2 PORTER'S 5 FORCES MODEL
5 NORTH AMERICA SMART HOSPITAL MARKET
6 NORTH AMERICA SMART HOSPITAL MARKET
7 MARKET OVERVIEW
7.1 DRIVERS
7.1.1 INCREASE IN THE PREVALENCE OF CHRONIC DISEASES
7.1.2 ESCALATION IN INNOVATION AND TECHNOLOGIES
7.1.3 INCREASE IN THE DEMAND FOR TELEHEALTH
7.1.4 INCREASING GOVERNMENT INITIATIVES SUPPORTING THE USE OF SMART SERVICES AND SOLUTIONS IN HOSPITALS
7.2 RESTRAINTS
7.2.1 RELUCTANCE AMONG THE HEALTHCARE ORGANIZATIONS TO ADOPT AUTOMATION SYSTEMS
7.2.2 STRICT REGULATORY FRAMEWORK
7.3 OPPORTUNITIES
7.3.1 GROWING HEALTHCARE EXPENDITURE
7.3.2 PREVALENCE OF IMPROVED HEALTHCARE INFRASTRUCTURE
7.3.3 INCREASE IN USAGE OF SOFTWARE TO GET QUICK ONLINE RESULTS AND CONSULTANCY
7.3.4 STRATEGIC INITIATIVES AND DEVELOPMENTS BY KEY PLAYERS
7.4 CHALLENGES
7.4.1 SHORTAGE OF IT SKILLED MEDICAL PROFESSIONALS TO HANDLE SOFTWARE
7.4.2 PATIENTS DATA SECURITY IN E-HEALTH
8 NORTH AMERICA SMART HOSPITAL MARKET, BY COMPONENT
8.1 OVERVIEW
8.2 HARDWARE
8.2.1 MEDICAL DEVICES
8.2.1.1 WEARABLE EXTERNAL DEVICES
8.2.1.1.1 SMART GLUCOSE METERS
8.2.1.1.2 WEARABLE INSULIN PUMPS
8.2.1.1.3 WEARABLE VITAL MONITORING DEVICES
8.2.1.1.3.1 HEART RATE
8.2.1.1.3.2 OXYGEN MONITORING
8.2.1.1.3.3 BLOOD PRESSURE
8.2.1.1.3.4 OTHERS
8.2.1.1.4 OTHERS
8.2.2 MOBILE DEVICES
8.2.2.1 Implanted medical devices
8.2.2.1.1 ORGAN SYSTEMS
8.2.2.1.1.1 HEART IMPLANTS
8.2.2.1.1.2 ARTIFICIAL PANCREAS SYSTEMS
8.2.2.1.1.3 SMART STENTS
8.2.2.1.1.4 COCHLEAR IMPLANTS
8.2.2.1.1.5 ARTIFICIAL RETINA IMPLANTS
8.2.2.2 PROSTHETIC LIMBS SYSTEMS
8.2.2.2.1 NEUROLOGICAL SOLUTIONS
8.2.2.2.1.1 DEEP BRAIN STIMULATION SOLUTIONS
8.2.2.2.1.2 BRAIN COMPUTER INTERFACES (BCI)
8.2.2.2.1.3 SEIZURE MONITORS
8.2.2.2.1.4 OTHERS
8.2.2.3 DIGITAL PILLS
8.2.2.4 OTHERS
8.2.3 STATIONARY MEDICAL DEVICES
8.2.4 SUPPORTIVE DEVICES
8.2.5 SEMICONDUCTOR COMPONENTS
8.2.5.1 SENSORS
8.2.5.2 CAMERAS
8.2.5.3 PROCESSORS
8.2.5.4 CONNECTIVITY ICS
8.2.6 SMART PILLS
8.2.6.1 CAPSULE ENDOSCOPY
8.2.6.2 PATIENT MONITORING
8.2.6.3 DRUG DELIVERY
8.2.7 SMART SYRINGES
8.2.7.1 ACTIVE SAFETY SYRINGES
8.2.7.2 PASSIVE SAFETY SYRINGES
8.2.7.3 AUTO DISABLE SYRINGES
8.2.8 RFID SMART CABINETS
8.2.9 OTHERS
8.3 SYSTEMS AND SOFTWARE
8.3.1 REMOTE CARE SYSTEMS
8.3.1.1 TELE MONITORING AND TELE DIAGNOSIS SYSTEMS
8.3.1.2 TELEHEALTH EQUIPMENT SYSTEMS
8.3.1.3 AUTOMATED DOSING SYSTEMS
8.3.2 IDENTIFICATION SYSTEMS
8.3.2.1 RFID SYSTEMS
8.3.2.2 CLOSED CIRCUIT SECURITY SYSTEMS
8.3.2.3 BIOMETRIC SCANNERS
8.3.2.4 TAGS
8.3.2.5 BRASLETS
8.3.2.6 LABLES
8.3.2.7 BADGES
8.3.2.8 OTHER IDENTIFICATION SYSTEMS
8.3.3 MOBILE CLIENT DEVICES
8.3.4 TELEMEDICINE
8.3.5 INTERCONNECTED CLINICAL INFORMATION SYSTEMS
8.3.5.1 LABORATORY INFORMATION SYSTEMS (LIS)
8.3.5.2 HOSPITAL INFORMATION SYSTEMS (HIS)
8.3.5.3 RESEARCH INFORMATION SYSTEMS
8.3.5.4 PICTURE ARCHIVING AND COMMUNICATION SYSTEMS (PACS)
8.3.5.5 PHARMACY INFORMATION SYSTEMS (PIS)
8.3.5.6 RADIOLOGY INFORMATION SYSTEMS (RIS)
8.3.5.7 PATHOLOGY INFORMATION SYSTEMS
8.3.5.8 BLOOD BANK SYSTEMS
8.3.6 MOBILE CLIENT DEVICES
8.3.7 TELEMEDICINE
8.3.8 DATA
8.3.8.1 ELECTRONIC MEDICAL RECORDS (EMR)
8.3.8.2 PATIENT DATA
8.3.8.3 TRACKING LOGS
8.3.8.4 RESEARCH DATA
8.3.9 M HEALTH
8.3.10 OTHERS
8.4 SERVICES
8.4.1 BY TYPE
8.4.1.1 PROFESSIONAL SERVICES
8.4.1.1.1 CONSULTING AND INTEGRATION SERVICES
8.4.1.1.2 SUPPORT AND MAINTENANCE SERVICES
8.4.1.1.3 OTHERS
8.4.1.2 DEPLOYMENT AND INTEGRATION SERVICES
8.4.1.2.1 REAL TIME LOCATION SERVICES
8.4.1.2.2 ASSET TRACKING ROI CALCULATOR
8.4.1.2.3 ROOM AUTOMATION
8.4.1.2.4 ENERGY EFFICIENCY AND RESILIENCE
8.4.1.2.5 OTHERS
8.4.1.3 MANAGED SERVICES
8.4.1.4 OTHERS
8.4.2 BY SPECIALTY
8.4.2.1 GENERAL
8.4.2.2 SPECIALTY
8.4.2.3 SUPER SPECIALTY
9 NORTH AMERICA SMART HOSPITAL MARKET, BY CONNECTIVITY
9.1 OVERVIEW
9.2 WIRED
9.3 WIRELESS
9.3.1 WI-FI
9.3.2 BLUETOOTH
9.3.3 RADIO-FREQUENCY IDENTIFICATION (RFID)
9.3.4 NEAR FIELD COMMUNICATION (NFC)
9.3.5 OTHERS
10 NORTH AMERICA SMART HOSPITAL MARKET, BY TECHNOLOGY
10.1 OVERVIEW
10.2 ARTIFICIAL INTELLIGENCE
10.2.1 ARTIFICIAL INTELLIGENCE, BY OFFERING
10.2.1.1 HARDWARE
10.2.1.2 SYSTEM AND SOFTWARE
10.2.1.3 SERVICES
10.2.1.4 ARTIFICIAL INTELLIGENCE, BY TECHNOLOGY
10.2.2 MACHINE LEARNING
10.2.3 QUERYING METHOD
10.2.4 NATURAL LANGUAGE PROCESSING
10.2.5 OTHERS
10.3 ARTIFICIAL INTELLIGENCE, BY APPLICATION
10.3.1 ROBOT ASSISTED SURGERY
10.3.2 IMAGE ANALYSIS
10.3.3 WORKFLOW ASSISTANCE
10.3.4 VIRTUAL NURSING ASSISTANCE
10.3.5 CYBERSECURITY
10.3.6 FRAUD DETECTION
10.3.7 DOSAGE DEDUCTION ERROR
10.3.8 PRELIMINARY DIAGNOSIS
10.3.9 CLINICAL TRIAL PARTICIPANT IDENTIFIER
10.4 INTERNET OF THINGS
10.4.1 INTERNET OF THINGS, BY OFFERING
10.4.1.1 HARDWARE
10.4.1.2 SYSTEM AND SOFTWARE
10.4.1.3 SERVICES
10.5 INTERNET OF THINGS, BY APPLICATION
10.5.1 PATIENT MONITORING
10.5.2 NON-INVASIVE DIAGNOSIS
10.5.3 PRECISION MEDICINE
10.5.4 OTHERS
10.6 BIG DATA
10.6.1 BIG DATA, BY OFFERING
10.6.1.1 HARDWARE
10.6.1.2 SYSTEM AND SOFTWARE
10.6.1.3 SERVICES
10.7 BIG DATA, BY TECHNOLOGY
10.7.1 MACHINE LEARNING
10.7.2 DATA MINING
10.7.3 DATA FUSION AND INTEGRATION
10.7.4 NATURAL LANGUAGE PROCESSING
10.7.5 A/B TESTING
10.7.6 OTHERS
10.8 BIG DATA, BY TYPE
10.8.1 DISCOVERY ANALYSIS
10.8.2 DESCRIPTIVE ANALYSIS
10.8.3 PRESCRIPTIVE ANALYSIS
10.8.4 PREDICTIVE ANALYSIS
10.9 BIG DATA, BY APPLICATION
10.9.1 ENABLING REAL TIME ALERTS
10.9.2 IMPROVING POPULATION HEALTH
10.9.3 CONTRIBUTING TO CANCER TREATMENT
10.9.4 FACILITATING MEDICAL RESEARCH
10.9.5 PREVENTING CYBER ATTACKS AND FRAUDS
10.9.6 MANAGING MENTAL HEALTH
10.9.7 MITIGATING HOSPITALIZATION RISKS
10.9.8 OTHERS
10.1 AUGMENTED REALITY (AR)
10.10.1 AUGMENTED REALITY (AR), BY OFFERING
10.10.1.1 HARDWARE
10.10.1.2 SYSTEM AND SOFTWARE
10.10.1.3 SERVICES
10.11 AUGMENTED REALITY (AR), BY TECHNOLOGY
10.11.1 EXTENDED REALITY (XR)
10.11.2 MIXED REALITY (MR)
10.11.3 VIRTUAL REALITY (VR)
10.11.4 OTHERS
10.12 AUGMENTED REALITY, BY APPLICATION
10.12.1 DIAGNOSTIC PROCEDURES
10.12.2 COMPLEX SURGERIES
10.12.3 PAIN MANAGEMENT
10.12.4 MEDICAL TRAINING AND EDUCATION
10.12.5 MENTAL HEALTH THERAPY
10.12.6 OTHERS
10.13 CLOUD COMPUTING
10.13.1 CLOUD COMPUTING, BY OFFERING
10.13.1.1 HARDWARE
10.13.1.2 SYSTEM AND SOFTWARE
10.13.1.3 SERVICES
10.14 CLOUD COMPUTING, BY DEPLOYMENT
10.14.1 SOFTWARE AS A SERVICE (SAAS)
10.14.2 PLATFORM AS A SERVICE (PAAS)
10.14.3 INFRASTRUCTURE AS A SERVICE (IAAS)
10.15 CLOUD COMPUTING, BY APPLICATION
10.15.1 EMAIL
10.15.2 CLOUD FAXING
10.15.3 EHRS AND EMRS
10.15.4 OTHERS
10.16 OTHERS
11 NORTH AMERICA SMART HOSPITAL MARKET, BY APPLICATION
11.1 OVERVIEW
11.2 REMOTE MEDICINE MANAGEMENT
11.3 MEDICAL CONNECTED IMAGING
11.4 MEDICAL ASSISTANCE
11.5 OUTPATIENT VIGILANCE
11.6 ELECTRONIC HEALTH RECORD & CLINICAL WORKFLOW
11.7 PHARMACY AUTOMATION
11.8 ROBOT ASSISTED SURGERY
11.9 IMAGE ANALYSIS
11.1 WORKFLOW ASSISTANCE
11.11 VIRTUAL NURSING ASSISTANT
11.12 CYBERSECURITY
11.13 FRAUD DETECTION
11.14 DOSAGE ERROR REDUCTION
11.15 PRELIMINARY DIAGNOSIS
11.16 CLINICAL TRIAL PARTICIPANT IDENTIFIER
11.17 NON-INVASIVE DIAGNOSIS
11.18 PRECISION MEDICINE
11.19 RESEARCH
11.2 OTHERS
12 NORTH AMERICA SMART HOSPITAL MARKET, BY DISTRIBUTION CHANNEL
12.1 OVERVIEW
12.2 DIRECT TENDER
12.3 THIRD PARTY DISTRIBUTOR
12.4 RETAIL SALES
13 NORTH AMERICA SMART HOSPITAL MARKET , BY REGION
13.1 NORTH AMERICA
13.1.1 U.S.
13.1.2 CANADA
13.1.3 MEXICO
14 NORTH AMERICA SMART HOSPITAL MARKET: COMPANY LANDSCAPE
14.1 COMPANY SHARE ANALYSIS: NORTH AMERICA
15 SWOT ANALYSIS
16 COMPANY PROFILE
16.1 QUALCOMM TECHNOLOGIES, INC.
16.1.1 COMPANY SNAPSHOT
16.1.2 REVENUE ANALYSIS
16.1.3 COMPANY SHARE ANALYSIS
16.1.4 PRODUCT PORTFOLIO
16.1.5 RECENT DEVELOPMENT
16.2 GENERAL ELECTRIC COMPANY
16.2.1 COMPANY SNAPSHOT
16.2.2 REVENUE ANALYSIS
16.2.3 COMPANY SHARE ANALYSIS
16.2.4 PRODUCT PORTFOLIO
16.2.5 RECENT DEVELOPMENT
16.3 KONINKLIJKE PHILIPS N.V.
16.3.1 COMPANY SNAPSHOT
16.3.2 REVENUE ANALYSIS
16.3.3 COMPANY SHARE ANALYSIS
16.3.4 PRODUCT PORTFOLIO
16.3.5 RECENT DEVELOPMENTS
16.4 MCKESSON CORPORATION
16.4.1 COMPANY SNAPSHOT
16.4.2 REVENUE ANALYSIS
16.4.3 COMPANY SHARE ANALYSIS
16.4.4 PRODUCT PORTFOLIO
16.4.5 RECENT DEVELOPMENT
16.5 SIEMENS AG (2022)
16.5.1 COMPANY SNAPSHOT
16.5.2 REVENUE ANALYSIS
16.5.3 COMPANY SHARE ANALYSIS
16.5.4 PRODUCT PORTFOLIO
16.5.5 RECENT DEVELOPMENTS
16.6 APPLE INC. (2022)
16.6.1 COMPANY SNAPSHOT
16.6.2 REVENUE ANALYSIS
16.6.3 PRODUCT PORTFOLIO
16.6.4 RECENT DEVELOPMENTS
16.7 ADHERETECH
16.7.1 COMPANY SNAPSHOT
16.7.2 PRODUCT PORTFOLIO
16.7.3 RECENT DEVELOPMENT
16.8 AIRSTRIP TECHNOLOGIES, INC.
16.8.1 COMPANY SNAPSHOT
16.8.2 PRODUCT PORTFOLIO
16.8.3 RECENT DEVELOPMENTS
16.9 ALLSCRIPTS HEALTHCARE, LLC
16.9.1 COMPANY SNAPSHOT
16.9.2 REVENUE ANALYSIS
16.9.3 PRODUCT PORTFOLIO
16.9.4 RECENT DEVELOPMENT
16.1 AVISA SMART HOSPITAL
16.10.1 COMPANY SNAPSHOT
16.10.2 PRODUCT PORTFOLIO
16.10.3 RECENT DEVELOPMENTS
16.11 CITRUSTECH INC.
16.11.1 COMPANY SNAPSHOT
16.11.2 PRODUCT PORTFOLIO
16.11.3 RECENT DEVELOPMENT
16.12 CLOUDPHYSICIAN HEALTHCARE PVT. LTD.
16.12.1 COMPANY SNAPSHOT
16.12.2 PRODUCT PORTFOLIO
16.12.3 RECENT DEVELOPMENT
16.13 DIABETIZER GMBH
16.13.1 COMPANY SNAPSHOT
16.13.2 PRODUCT PORTFOLIO
16.13.3 RECENT DEVELOPMENTS
16.14 DXC TECHNOLOGY COMPANY
16.14.1 COMPANY SNAPSHOT
16.14.2 REVENUE ANALYSIS
16.14.3 PRODUCT PORTFOLIO
16.14.4 RECENT DEVELOPMENT
16.15 HONEYWELL INTERNATIONAL INC. (2022)
16.15.1 COMPANY SNAPSHOT
16.15.2 REVENUE ANALYSIS
16.15.3 PRODUCT PORTFOLIO
16.15.4 RECENT DEVELOPMENTS
16.16 INTEL CORPORATION (2022)
16.16.1 COMPANY SNAPSHOT
16.16.2 REVENUE ANALYSIS
16.16.3 PRODUCT PORTFOLIO
16.16.4 RECENT DEVELOPMENTS
16.17 ITRANSITION
16.17.1 COMPANY SNAPSHOT
16.17.2 PRODUCT PORTFOLIO
16.17.3 RECENT DEVELOPMENTS
16.18 ITREX GROUP
16.18.1 COMPANY SNAPSHOT
16.18.2 PRODUCT PORTFOLIO
16.18.3 RECENT DEVELOPMENT
16.19 MEDTRONIC
16.19.1 COMPANY SNAPSHOT
16.19.2 REVENUE ANALYSIS
16.19.3 PRODUCT PORTFOLIO
16.19.4 RECENT DEVELOPMENT
16.2 MICROSOFT
16.20.1 COMPANY SNAPSHOT
16.20.2 REVENUE ANALYSIS
16.20.3 PRODUCT PORTFOLIO
16.20.4 RECENT DEVELOPMENTS
16.21 ORACLE
16.21.1 COMPANY SNAPSHOT
16.21.2 REVENUE ANALYSIS
16.21.3 PRODUCT PORTFOLIO
16.21.4 RECENT DEVELOPMENTS
16.22 PHYSIQ
16.22.1 COMPANY SNAPSHOT
16.22.2 PRODUCT PORTFOLIO
16.22.3 RECENT DEVELOPMENT
16.23 QDOCS
16.23.1 COMPANY SNAPSHOT
16.23.2 PRODUCT PORTFOLIO
16.23.3 RECENT DEVELOPMENT
16.24 SAMSUNG ELECTRONICS AMERICA (2022)
16.24.1 COMPANY SNAPSHOT
16.24.2 REVENUE ANALYSIS
16.24.3 PRODUCT PORTFOLIO
16.24.4 RECENT DEVELOPMENTS
16.25 TERSO SOLUTIONS, INC.
16.25.1 COMPANY SNAPSHOT
16.25.2 PRODUCT PORTFOLIO
16.25.3 RECENT DEVELOPMENTS
16.26 THOUGHTWIRE
16.26.1 COMPANY SNAPSHOT
16.26.2 PRODUCT PORTFOLIO
16.26.3 RECENT DEVELOPMENT
17 QUESTIONNAIRE
18 RELATED REPORTS
List of Table
TABLE 1 NORTH AMERICA SMART HOSPITAL MARKET, BY COMPONENT, 2021-2030 (USD MILLION)
TABLE 2 NORTH AMERICA HARDWARE IN SMART HOSPITAL MARKET, BY REGION, 2021-2030 (USD MILLION)
TABLE 3 NORTH AMERICA HARDWARE IN SMART HOSPITAL MARKET, BY COMPONENT, 2021-2030 (USD MILLION)
TABLE 4 NORTH AMERICA MEDICAL DEVICES IN SMART HOSPITAL MARKET, BY COMPONENT, 2021-2030 (USD MILLION)
TABLE 5 NORTH AMERICA WEARABLE EXTERNAL DEVICES IN SMART HOSPITAL MARKET, BY HARDWARE, 2021-2030 (USD MILLION)
TABLE 6 NORTH AMERICA WEARABLE VITAL MONITORING DEVICES IN SMART HOSPITAL MARKET, BY HARDWARE, 2021-2030 (USD MILLION)
TABLE 7 NORTH AMERICA IMPLANTED MEDICAL DEVICES IN SMART HOSPITAL MARKET, BY HARDWARE, 2021-2030 (USD MILLION)
TABLE 8 NORTH AMERICA ORGAN SYSTEMS IN SMART HOSPITAL MARKET, BY HARDWARE, 2021-2030 (USD MILLION)
TABLE 9 NORTH AMERICA NEUROLOGICAL SOLUTIONS IN SMART HOSPITAL MARKET, BY TYPE, 2021-2030 (USD MILLION)
TABLE 10 NORTH AMERICA SEMICONDUCTOR COMPONENTS IN SMART HOSPITAL MARKET, BY HARDWARE, 2021-2030 (USD MILLION)
TABLE 11 NORTH AMERICA SMART PILLS IN SMART HOSPITAL MARKET, BY TYPE, 2021-2030 (USD MILLION)
TABLE 12 NORTH AMERICA SMART SYRINGES IN SMART HOSPITAL MARKET, BY TYPE, 2021-2030 (USD MILLION)
TABLE 13 NORTH AMERICA SYSTEMS AND SOFTWARE IN SMART HOSPITAL MARKET, BY REGION, 2021-2030 (USD MILLION)
TABLE 14 NORTH AMERICA SYSTEMS AND SOFTWARE IN SMART HOSPITAL MARKET, BY COMPONENT, 2021-2030 (USD MILLION)
TABLE 15 NORTH AMERICA REMOTE CARE SYSTEMS IN SMART HOSPITAL MARKET, BY TYPE, 2021-2030 (USD MILLION)
TABLE 16 NORTH AMERICA IDENTIFICATION SYSTEMS IN SMART HOSPITAL MARKET, BY SYSTEM AND SOFTWARE, 2021-2030 (USD MILLION)
TABLE 17 NORTH AMERICA INTERCONNECTED CLINICAL INFORMATION SYSTEMS IN SMART HOSPITAL MARKET, BY SYSTEM AND SOFTWARE, 2021-2030 (USD MILLION)
TABLE 18 NORTH AMERICA DATA IN SMART HOSPITAL MARKET, BY SYSTEM AND SOFTWARE, 2021-2030 (USD MILLION)
TABLE 19 NORTH AMERICA SERVICES IN SMART HOSPITAL MARKET, BY REGION, 2021-2030 (USD MILLION)
TABLE 20 NORTH AMERICA SERVICES IN SMART HOSPITAL MARKET, BY TYPE, 2021-2030 (USD MILLION)
TABLE 21 NORTH AMERICA PROFESSIONAL SERVICES IN SMART HOSPITAL MARKET, BY TYPE, 2021-2030 (USD MILLION)
TABLE 22 NORTH AMERICA DEPLOYMENT AND INTEGRATION SERVICES IN SMART HOSPITAL MARKET, BY TYPE, 2021-2030 (USD MILLION)
TABLE 23 NORTH AMERICA SERVICES IN SMART HOSPITAL MARKET, BY SPECIALITY, 2021-2030 (USD MILLION)
TABLE 24 NORTH AMERICA SMART HOSPITAL MARKET, BY CONNECTIVITY, 2021-2030 (USD MILLION)
TABLE 25 NORTH AMERICA WIRED IN SMART HOSPITAL MARKET, BY REGION, 2021-2030 (USD MILLION)
TABLE 26 NORTH AMERICA WIRELESS IN SMART HOSPITAL MARKET, BY REGION, 2021-2030 (USD MILLION)
TABLE 27 NORTH AMERICA WIRELESS IN SMART HOSPITAL MARKET, BY CONNECTIVITY, 2021-2030 (USD MILLION)
TABLE 28 NORTH AMERICA SMART HOSPITAL MARKET, BY TECHNOLOGY, 2021-2030 (USD MILLION)
TABLE 29 NORTH AMERICA ARTIFICIAL INTELLIGENCE IN SMART HOSPITAL MARKET, BY REGION, 2021-2030 (USD MILLION)
TABLE 30 NORTH AMERICA ARTIFICIAL INTELLIGENCE IN SMART HOSPITAL MARKET, BY OFFERING, 2021-2030 (USD MILLION)
TABLE 31 NORTH AMERICA ARTIFICIAL INTELLIGENCE IN SMART HOSPITAL MARKET, BY TECHNOLOGY, 2021-2030 (USD MILLION)
TABLE 32 NORTH AMERICA ARTIFICIAL INTELLIGENCE IN SMART HOSPITAL MARKET, BY APPLICATION, 2021-2030 (USD MILLION)
TABLE 33 NORTH AMERICA INTERNET OF THINGS IN SMART HOSPITAL MARKET, BY REGION, 2021-2030 (USD MILLION)
TABLE 34 NORTH AMERICA INTERNET OF THINGS IN SMART HOSPITAL MARKET, BY OFFERING, 2021-2030 (USD MILLION)
TABLE 35 NORTH AMERICA INTERNET OF THINGS IN SMART HOSPITAL MARKET, BY APPLICATION, 2021-2030 (USD MILLION)
TABLE 36 NORTH AMERICA BIG DATA IN SMART HOSPITAL MARKET, BY REGION, 2021-2030 (USD MILLION)
TABLE 37 NORTH AMERICA BIG DATA IN SMART HOSPITAL MARKET, BY OFFERING, 2021-2030 (USD MILLION)
TABLE 38 NORTH AMERICA AUGMENTED REALITY (AR) IN SMART HOSPITAL MARKET, BY TECHNOLOGY, 2021-2030 (USD MILLION)
TABLE 39 NORTH AMERICA BIG DATA IN SMART HOSPITAL MARKET, BY TYPE, 2021-2030 (USD MILLION)
TABLE 40 NORTH AMERICA BIG DATA IN SMART HOSPITAL MARKET, BY APPLICATION, 2021-2030 (USD MILLION)
TABLE 41 NORTH AMERICA AUGMENTED REALITY (AR) IN SMART HOSPITAL MARKET, BY REGION, 2021-2030 (USD MILLION)
TABLE 42 NORTH AMERICA AUGMENTED REALITY (AR) IN SMART HOSPITAL MARKET, BY OFFERING, 2021-2030 (USD MILLION)
TABLE 43 NORTH AMERICA AUGMENTED REALITY (AR) IN SMART HOSPITAL MARKET, BY TECHNOLOGY, 2021-2030 (USD MILLION)
TABLE 44 NORTH AMERICA AUGMENTED REALITY (AR) IN SMART HOSPITAL MARKET, BY APPLICATION, 2021-2030 (USD MILLION)
TABLE 45 NORTH AMERICA CLOUD COMPUTING IN SMART HOSPITAL MARKET, BY REGION, 2021-2030 (USD MILLION)
TABLE 46 NORTH AMERICA CLOUD COMPUTING IN SMART HOSPITAL MARKET, BY OFFERING, 2021-2030 (USD MILLION)
TABLE 47 NORTH AMERICA CLOUD COMPUTING IN SMART HOSPITAL MARKET, BY DEPLOYMENT, 2021-2030 (USD MILLION)
TABLE 48 NORTH AMERICA CLOUD COMPUTING IN SMART HOSPITAL MARKET, BY APPLICATION, 2021-2030 (USD MILLION)
TABLE 49 NORTH AMERICA OTHERS IN SMART HOSPITAL MARKET, BY REGION, 2021-2030 (USD MILLION)
TABLE 50 NORTH AMERICA SMART HOSPITAL MARKET, BY APPLICATION, 2021-2030 (USD MILLION)
TABLE 51 NORTH AMERICA REMOTE MEDICINE MANAGEMENT IN SMART HOSPITAL MARKET, BY REGION, 2021-2030 (USD MILLION)
TABLE 52 NORTH AMERICA MEDICAL CONNECTED IMAGING IN SMART HOSPITAL MARKET, BY REGION, 2021-2030 (USD MILLION)
TABLE 53 NORTH AMERICA MEDICAL ASSISTANCE IN SMART HOSPITAL MARKET, BY REGION, 2021-2030 (USD MILLION)
TABLE 54 NORTH AMERICA OUTPATIENT VIGILANCE IN SMART HOSPITAL MARKET, BY REGION, 2021-2030 (USD MILLION)
TABLE 55 NORTH AMERICA ELECTRONIC HEALTH RECORD & CLINICAL WORKFLOW IN SMART HOSPITAL MARKET, BY REGION, 2021-2030 (USD MILLION)
TABLE 56 NORTH AMERICA PHARMACY AUTOMATION IN SMART HOSPITAL MARKET, BY REGION, 2021-2030 (USD MILLION)
TABLE 57 NORTH AMERICA ROBOT ASSISTED SURGERY IN SMART HOSPITAL MARKET, BY REGION, 2021-2030 (USD MILLION)
TABLE 58 NORTH AMERICA IMAGE ANALYSIS IN SMART HOSPITAL MARKET, BY REGION, 2021-2030 (USD MILLION)
TABLE 59 NORTH AMERICA WORKFLOW ASSISTANCE IN SMART HOSPITAL MARKET, BY REGION, 2021-2030 (USD MILLION)
TABLE 60 NORTH AMERICA VIRTUAL NURSING ASSISTANT IN SMART HOSPITAL MARKET, BY REGION, 2021-2030 (USD MILLION)
TABLE 61 NORTH AMERICA CYBERSECURITY IN SMART HOSPITAL MARKET, BY REGION, 2021-2030 (USD MILLION)
TABLE 62 NORTH AMERICA FRAUD DETECTION IN SMART HOSPITAL MARKET, BY REGION, 2021-2030 (USD MILLION)
TABLE 63 NORTH AMERICA DOSAGE ERROR REDUCTION IN SMART HOSPITAL MARKET, BY REGION, 2021-2030 (USD MILLION)
TABLE 64 NORTH AMERICA PRELIMINARY DIAGNOSIS IN SMART HOSPITAL MARKET, BY REGION, 2021-2030 (USD MILLION)
TABLE 65 NORTH AMERICA CLINICAL TRIAL PARTICIPANT IDENTIFIER IN SMART HOSPITAL MARKET, BY REGION, 2021-2030 (USD MILLION)
TABLE 66 NORTH AMERICA NON-INVASIVE DIAGNOSIS IN SMART HOSPITAL MARKET, BY REGION, 2021-2030 (USD MILLION)
TABLE 67 NORTH AMERICA PRECISION MEDICINE IN SMART HOSPITAL MARKET, BY REGION, 2021-2030 (USD MILLION)
TABLE 68 NORTH AMERICA RESEARCH IN SMART HOSPITAL MARKET, BY REGION, 2021-2030 (USD MILLION)
TABLE 69 NORTH AMERICA OTHERS IN SMART HOSPITAL MARKET, BY REGION, 2021-2030 (USD MILLION)
TABLE 70 NORTH AMERICA SMART HOSPITAL MARKET, BY DISTRIBUTION CHANNEL, 2021-2030 (USD MILLION)
TABLE 71 NORTH AMERICA DIRECT TENDER IN SMART HOSPITAL MARKET, BY REGION, 2021-2030 (USD MILLION)
TABLE 72 NORTH AMERICA THIRD PARTY DISTRIBUTOR IN SMART HOSPITAL MARKET, BY REGION, 2021-2030 (USD MILLION)
TABLE 73 NORTH AMERICA RETAIL SALES IN SMART HOSPITAL MARKET, BY REGION, 2021-2030 (USD MILLION)
TABLE 74 NORTH AMERICA SMART HOSPITAL MARKET, BY COUNTRY, 2021-2030 (USD MILLION)
TABLE 75 NORTH AMERICA SMART HOSPITAL MARKET, BY COMPONENT, 2021-2030 (USD MILLION)
TABLE 76 NORTH AMERICA HARDWARE IN SMART HOSPITAL MARKET, BY COMPONENT, 2021-2030 (USD MILLION)
TABLE 77 NORTH AMERICA MEDICAL DEVICES IN SMART HOSPITAL MARKET, BY COMPONENT, 2021-2030 (USD MILLION)
TABLE 78 NORTH AMERICA MEDICAL DEVICES IN SMART HOSPITAL MARKET, BY HARDWARE, 2021-2030, VOLUME (UNITS)
TABLE 79 NORTH AMERICA WEARABLE EXTERNAL MEDICAL DEVICES IN SMART HOSPITAL MARKET, BY HARDWARE, 2021-2030 (USD MILLION)
TABLE 80 NORTH AMERICA MEDICAL DEVICES IN SMART HOSPITAL MARKET, BY HARDWARE, 2021-2030 VOLUME (UNITS)
TABLE 81 NORTH AMERICA WEARABLE VITAL MONITORING DEVICES IN SMART HOSPITAL MARKET, BY HARDWARE, 2021-2030 (USD MILLION)
TABLE 82 NORTH AMERICA WEARABLE VITAL MONITORING DEVICES IN SMART HOSPITAL MARKET, BY HARDWARE, 2021-2030 VOLUME (UNITS)
TABLE 83 NORTH AMERICA IMPLANTED MEDICAL DEVICES IN SMART HOSPITAL MARKET, BY HARDWARE, 2021-2030 (USD MILLION)
TABLE 84 NORTH AMERICA IMPLANTED MEDICAL DEVICES IN SMART HOSPITAL MARKET, BY HARDWARE, 2021-2030 VOLUME (UNITS)
TABLE 85 NORTH AMERICA ORGAN SYSTEMS IN SMART HOSPITAL MARKET, BY HARDWARE, 2021-2030 (USD MILLION)
TABLE 86 NORTH AMERICA ORGAN SYSTEMS IN SMART HOSPITAL MARKET, BY HARDWARE, 2021-2030 VOLUME (UNITS)
TABLE 87 NORTH AMERICA NEUROLOGICAL SOLUTIONS IN SMART HOSPITAL MARKET, BY HARDWARE, 2021-2030 (USD MILLION)
TABLE 88 NORTH AMERICA NEUROLOGICAL SOLUTIONS IN SMART HOSPITAL MARKET, BY HARDWARE, 2021-2030 VOLUME (UNITS)
TABLE 89 NORTH AMERICA SEMI CONDUCTOR COMPONENTS IN SMART HOSPITAL MARKET, BY HARDWARE, 2021-2030 (USD MILLION)
TABLE 90 NORTH AMERICA SEMI CONDUCTOR COMPONENTS IN SMART HOSPITAL MARKET, BY HARDWARE, 2021-2030 VOLUME (UNITS)
TABLE 91 NORTH AMERICA SMART PILLS IN SMART HOSPITAL MARKET, BY HARDWARE, 2021-2030 (USD MILLION)
TABLE 92 NORTH AMERICA SMART PILLS IN SMART HOSPITAL MARKET, BY HARDWARE, 2021-2030 VOLUME (UNITS)
TABLE 93 NORTH AMERICA SMART SYRINGES IN SMART HOSPITAL MARKET, BY HARDWARE, 2021-2030 (USD MILLION)
TABLE 94 NORTH AMERICA SMART SYRINGES IN SMART HOSPITAL MARKET, BY HARDWARE, 2021-2030 VOLUME (UNITS)
TABLE 95 NORTH AMERICA SYSTEM AND SOFTWARE IN SMART HOSPITAL MARKET, BY COMPONENT, 2021-2030 (USD MILLION)
TABLE 96 NORTH AMERICA MOBILE CLIENT DEVICES IN SMART HOSPITAL MARKET, BY SYSTEM AND SOFTWARE, 2021-2030 VOLUME (UNITS)
TABLE 97 NORTH AMERICA REMOTE CARE SYSTEM IN SMART HOSPITAL MARKET, BY SYSTEM AND SOFTWARE, 2021-2030 (USD MILLION)
TABLE 98 NORTH AMERICA REMOTE CARE SYSTEM IN SMART HOSPITAL MARKET, BY SYSTEM AND SOFTWARE, 2021-2030 VOLUME (UNITS)
TABLE 99 NORTH AMERICA IDENTIFICATION SYSTEMS IN SMART HOSPITAL MARKET, BY SYSTEM AND SOFTWARE, 2021-2030 (USD MILLION)
TABLE 100 NORTH AMERICA IDENTIFICATION SYSTEMS IN SMART HOSPITAL MARKET, BY SYSTEM AND SOFTWARE, 2021-2030 VOLUME (UNITS)
TABLE 101 NORTH AMERICA INTERCONNECTED CLINICAL INFORMATION SYSTEMS IN SMART HOSPITAL MARKET, BY SYSTEM AND SOFTWARE, 2021-2030 (USD MILLION)
TABLE 102 NORTH AMERICA INTERCONNECTED CLINICAL INFORMATION SYSTEMS IN SMART HOSPITAL MARKET, BY SYSTEM AND SOFTWARE, 2021-2030 VOLUME (UNITS)
TABLE 103 NORTH AMERICA DATA IN SMART HOSPITAL MARKET, BY SYSTEM AND SOFTWARE, 2021-2030 (USD MILLION)
TABLE 104 NORTH AMERICA SERVICES IN SMART HOSPITAL MARKET, BY TYPE, 2021-2030 (USD MILLION)
TABLE 105 NORTH AMERICA PROFESSIONAL SERVICES IN SMART HOSPITAL MARKET, BY TYPE, 2021-2030 (USD MILLION)
TABLE 106 NORTH AMERICA DEPLOYMENT AND INTEGRATION SERVICES IN SMART HOSPITAL MARKET, BY TYPE, 2021-2030 (USD MILLION)
TABLE 107 NORTH AMERICA SERVICES IN SMART HOSPITAL MARKET, BY SPECIALITY, 2021-2030 (USD MILLION)
TABLE 108 NORTH AMERICA SMART HOSPITAL MARKET, BY CONNECTIVITY, 2021-2030 (USD MILLION)
TABLE 109 NORTH AMERICA WIRELESS IN SMART HOSPITAL MARKET, BY CONNECTIVITY, 2021-2030 (USD MILLION)
TABLE 110 NORTH AMERICA SMART HOSPITAL MARKET, BY TECHNOLOGY, 2021-2030 (USD MILLION)
TABLE 111 NORTH AMERICA ARTIFICIAL INTELLIGENCE IN SMART HOSPITAL MARKET, BY OFFERING, 2021-2030 (USD MILLION)
TABLE 112 NORTH AMERICA ARTIFICIAL INTELLIGENCE IN SMART HOSPITAL MARKET, BY TECHNOLOGY, 2021-2030 (USD MILLION)
TABLE 113 NORTH AMERICA ARTIFICIAL INTELLIGENCE IN SMART HOSPITAL MARKET, BY APPLICATION, 2021-2030 (USD MILLION)
TABLE 114 NORTH AMERICA INTERNET OF THINGS IN SMART HOSPITAL MARKET, BY OFFERING, 2021-2030 (USD MILLION)
TABLE 115 NORTH AMERICA INTERNET OF THINGS IN SMART HOSPITAL MARKET, BY APPLICATION, 2021-2030 (USD MILLION)
TABLE 116 NORTH AMERICA AUGMENTED REALITY (AR) IN SMART HOSPITAL MARKET, BY OFFERING, 2021-2030 (USD MILLION)
TABLE 117 NORTH AMERICA AUGMENTED REALITY (AR) IN SMART HOSPITAL MARKET, BY TECHNOLOGY, 2021-2030 (USD MILLION)
TABLE 118 NORTH AMERICA AUGMENTED REALITY (AR) IN SMART HOSPITAL MARKET, BY APPLICATION, 2021-2030 (USD MILLION)
TABLE 119 NORTH AMERICA BIG DATA IN SMART HOSPITAL MARKET, BY OFFERING, 2021-2030 (USD MILLION)
TABLE 120 NORTH AMERICA BIG DATA IN SMART HOSPITAL MARKET, BY TECHNOLOGY, 2021-2030 (USD MILLION)
TABLE 121 NORTH AMERICA BIG DATA IN SMART HOSPITAL MARKET, BY TYPE, 2021-2030 (USD MILLION)
TABLE 122 NORTH AMERICA BIG DATA IN SMART HOSPITAL MARKET, BY APPLICATION, 2021-2030 (USD MILLION)
TABLE 123 NORTH AMERICA CLOUD COMPUTING IN SMART HOSPITAL MARKET, BY OFFERING, 2021-2030 (USD MILLION)
TABLE 124 NORTH AMERICA CLOUD COMPUTING IN SMART HOSPITAL MARKET, BY DEPLOYMENT, 2021-2030 (USD MILLION)
TABLE 125 NORTH AMERICA CLOUD COMPUTING IN SMART HOSPITAL MARKET, BY APPLICATION, 2021-2030 (USD MILLION)
TABLE 126 NORTH AMERICA SMART HOSPITAL MARKET, BY APPLICATION, 2021-2030 (USD MILLION)
TABLE 127 NORTH AMERICA SMART HOSPITAL MARKET, BY DISTRIBUTION CHANNEL, 2021-2030 (USD MILLION)
TABLE 128 U.S. SMART HOSPITAL MARKET, BY COMPONENT, 2021-2030 (USD MILLION)
TABLE 129 U.S. HARDWARE IN SMART HOSPITAL MARKET, BY COMPONENT, 2021-2030 (USD MILLION)
TABLE 130 U.S. RFID SMART CABINETS IN SMART HOSPITAL MARKET, BY COMPONENT, 2021-2030 VOLUME (UNITS)
TABLE 131 U.S. RFID SMART CABINETS IN SMART HOSPITAL MARKET, BY COMPONENT, 2021-2030 ASP (USD)
TABLE 132 U.S. MEDICAL DEVICES IN SMART HOSPITAL MARKET, BY COMPONENT, 2021-2030 (USD MILLION)
TABLE 133 U.S. MEDICAL DEVICES IN SMART HOSPITAL MARKET, BY HARDWARE, 2021-2030, VOLUME (UNITS)
TABLE 134 U.S. MEDICAL DEVICES IN SMART HOSPITAL MARKET, BY HARDWARE, 2021-2030 ASP (USD)
TABLE 135 U.S. WEARABLE EXTERNAL MEDICAL DEVICES IN SMART HOSPITAL MARKET, BY HARDWARE, 2021-2030 (USD MILLION)
TABLE 136 U.S. MEDICAL DEVICES IN SMART HOSPITAL MARKET, BY HARDWARE, 2021-2030 VOLUME (UNITS)
TABLE 137 U.S. MEDICAL DEVICES IN SMART HOSPITAL MARKET, BY HARDWARE, 2021-2030 ASP (USD)
TABLE 138 U.S. WEARABLE VITAL MONITORING DEVICES IN SMART HOSPITAL MARKET, BY HARDWARE, 2021-2030 (USD MILLION)
TABLE 139 U.S. WEARABLE VITAL MONITORING DEVICES IN SMART HOSPITAL MARKET, BY HARDWARE, 2021-2030 VOLUME (UNITS)
TABLE 140 U.S. WEARABLE VITAL MONITORING DEVICES IN SMART HOSPITAL MARKET, BY HARDWARE, 2021-2030 ASP (USD)
TABLE 141 U.S. IMPLANTED MEDICAL DEVICES IN SMART HOSPITAL MARKET, BY HARDWARE, 2021-2030 (USD MILLION)
TABLE 142 U.S. IMPLANTED MEDICAL DEVICES IN SMART HOSPITAL MARKET, BY HARDWARE, 2021-2030 VOLUME (UNITS)
TABLE 143 U.S. IMPLANTED MEDICAL DEVICES IN SMART HOSPITAL MARKET, BY HARDWARE, 2021-2030 ASP (USD)
TABLE 144 U.S. ORGAN SYSTEMS IN SMART HOSPITAL MARKET, BY HARDWARE, 2021-2030 (USD MILLION)
TABLE 145 U.S. ORGAN SYSTEMS IN SMART HOSPITAL MARKET, BY HARDWARE, 2021-2030 VOLUME (UNITS)
TABLE 146 U.S. ORGAN SYSTEMS IN SMART HOSPITAL MARKET, BY HARDWARE, 2021-2030 ASP (USD)
TABLE 147 U.S. NEUROLOGICAL SOLUTIONS IN SMART HOSPITAL MARKET, BY HARDWARE, 2021-2030 (USD MILLION)
TABLE 148 U.S. NEUROLOGICAL SOLUTIONS IN SMART HOSPITAL MARKET, BY HARDWARE, 2021-2030 VOLUME (UNITS)
TABLE 149 U.S. NEUROLOGICAL SOLUTIONS IN SMART HOSPITAL MARKET, BY HARDWARE, 2021-2030 ASP (USD)
TABLE 150 U.S. SEMI CONDUCTOR COMPONENTS IN SMART HOSPITAL MARKET, BY HARDWARE, 2021-2030 (USD MILLION)
TABLE 151 U.S. SEMI CONDUCTOR COMPONENTS IN SMART HOSPITAL MARKET, BY HARDWARE, 2021-2030 VOLUME (UNITS)
TABLE 152 U.S. SEMI CONDUCTOR COMPONENTS IN SMART HOSPITAL MARKET, BY HARDWARE, 2021-2030 ASP (USD)
TABLE 153 U.S. SMART PILLS IN SMART HOSPITAL MARKET, BY HARDWARE, 2021-2030 (USD MILLION)
TABLE 154 U.S. SMART PILLS IN SMART HOSPITAL MARKET, BY HARDWARE, 2021-2030 VOLUME (UNITS)
TABLE 155 U.S. SMART PILLS, BY HARDWARE, 2021-2030 ASP (USD)
TABLE 156 U.S. SMART SYRINGES IN SMART HOSPITAL MARKET, BY HARDWARE, 2021-2030 (USD MILLION)
TABLE 157 U.S. SMART SYRINGES IN SMART HOSPITAL MARKET, BY HARDWARE, 2021-2030 VOLUME (UNITS)
TABLE 158 U.S. SMART SYRINGES IN SMART HOSPITAL MARKET, BY HARDWARE, 2021-2030 ASP (USD)
TABLE 159 U.S. SYSTEM AND SOFTWARE IN SMART HOSPITAL MARKET, BY COMPONENT, 2021-2030 (USD MILLION)
TABLE 160 U.S. MOBILE CLIENT DEVICES IN SMART HOSPITAL MARKET, BY SYSTEM AND SOFTWARE, 2021-2030 VOLUME (UNITS)
TABLE 161 U.S. MOBILE CLIENT DEVICES IN SMART HOSPITAL MARKET, BY SYSTEM AND SOFTWARE, 2021-2030 ASP (USD)
TABLE 162 U.S. REMOTE CARE SYSTEM IN SMART HOSPITAL MARKET, BY SYSTEM AND SOFTWARE, 2021-2030 (USD MILLION)
TABLE 163 U.S. REMOTE CARE SYSTEM IN SMART HOSPITAL MARKET, BY SYSTEM AND SOFTWARE, 2021-2030 VOLUME (UNITS)
TABLE 164 U.S. REMOTE CARE SYSTEM IN SMART HOSPITAL MARKET, BY SYSTEM AND SOFTWARE, 2021-2030 ASP (USD)
TABLE 165 U.S. IDENTIFICATION SYSTEMS IN SMART HOSPITAL MARKET, BY SYSTEM AND SOFTWARE, 2021-2030 (USD MILLION)
TABLE 166 U.S. IDENTIFICATION SYSTEMS IN SMART HOSPITAL MARKET, BY SYSTEM AND SOFTWARE, 2021-2030 VOLUME (UNITS)
TABLE 167 U.S. IDENTIFICATION SYSTEMS IN SMART HOSPITAL MARKET, BY SYSTEM AND SOFTWARE, 2021-2030 ASP (USD)
TABLE 168 U.S. INTERCONNECTED CLINICAL INFORMATION SYSTEMS IN SMART HOSPITAL MARKET, BY SYSTEM AND SOFTWARE, 2021-2030 (USD MILLION)
TABLE 169 U.S. INTERCONNECTED CLINICAL INFORMATION SYSTEMS IN SMART HOSPITAL MARKET, BY SYSTEM AND SOFTWARE, 2021-2030 VOLUME (UNITS)
TABLE 170 U.S. IDENTIFICATION SYSTEMS IN SMART HOSPITAL MARKET, BY SYSTEM AND SOFTWARE, 2021-2030 ASP (USD)
TABLE 171 U.S. DATA IN SMART HOSPITAL MARKET, BY SYSTEM AND SOFTWARE, 2021-2030 (USD MILLION)
TABLE 172 U.S. SERVICES IN SMART HOSPITAL MARKET, BY TYPE, 2021-2030 (USD MILLION)
TABLE 173 U.S. PROFESSIONAL SERVICES IN SMART HOSPITAL MARKET, BY TYPE, 2021-2030 (USD MILLION)
TABLE 174 U.S. DEPLOYMENT AND INTEGRATION SERVICES IN SMART HOSPITAL MARKET, BY TYPE, 2021-2030 (USD MILLION)
TABLE 175 U.S. SERVICES IN SMART HOSPITAL MARKET, BY SPECIALITY, 2021-2030 (USD MILLION)
TABLE 176 U.S. SMART HOSPITAL MARKET, BY CONNECTIVITY, 2021-2030 (USD MILLION)
TABLE 177 U.S. WIRELESS IN SMART HOSPITAL MARKET, BY CONNECTIVITY, 2021-2030 (USD MILLION)
TABLE 178 U.S. SMART HOSPITAL MARKET, BY TECHNOLOGY, 2021-2030 (USD MILLION)
TABLE 179 U.S. ARTIFICIAL INTELLIGENCE IN SMART HOSPITAL MARKET, BY OFFERING, 2021-2030 (USD MILLION)
TABLE 180 U.S. ARTIFICIAL INTELLIGENCE IN SMART HOSPITAL MARKET, BY TECHNOLOGY, 2021-2030 (USD MILLION)
TABLE 181 U.S. ARTIFICIAL INTELLIGENCE IN SMART HOSPITAL MARKET, BY APPLICATION, 2021-2030 (USD MILLION)
TABLE 182 U.S. INTERNET OF THINGS IN SMART HOSPITAL MARKET, BY OFFERING, 2021-2030 (USD MILLION)
TABLE 183 U.S. INTERNET OF THINGS IN SMART HOSPITAL MARKET, BY APPLICATION, 2021-2030 (USD MILLION)
TABLE 184 U.S. AUGMENTED REALITY (AR) IN SMART HOSPITAL MARKET, BY OFFERING, 2021-2030 (USD MILLION)
TABLE 185 U.S. AUGMENTED REALITY (AR) IN SMART HOSPITAL MARKET, BY TECHNOLOGY, 2021-2030 (USD MILLION)
TABLE 186 U.S. AUGMENTED REALITY (AR) IN SMART HOSPITAL MARKET, BY APPLICATION, 2021-2030 (USD MILLION)
TABLE 187 U.S. BIG DATA IN SMART HOSPITAL MARKET, BY OFFERING, 2021-2030 (USD MILLION)
TABLE 188 U.S. BIG DATA IN SMART HOSPITAL MARKET, BY TECHNOLOGY, 2021-2030 (USD MILLION)
TABLE 189 U.S. BIG DATA IN SMART HOSPITAL MARKET, BY TYPE, 2021-2030 (USD MILLION)
TABLE 190 U.S. BIG DATA IN SMART HOSPITAL MARKET, BY APPLICATION, 2021-2030 (USD MILLION)
TABLE 191 U.S. CLOUD COMPUTING IN SMART HOSPITAL MARKET, BY OFFERING, 2021-2030 (USD MILLION)
TABLE 192 U.S. CLOUD COMPUTING IN SMART HOSPITAL MARKET, BY DEPLOYMENT, 2021-2030 (USD MILLION)
TABLE 193 U.S. CLOUD COMPUTING IN SMART HOSPITAL MARKET, BY APPLICATION, 2021-2030 (USD MILLION)
TABLE 194 U.S. SMART HOSPITAL MARKET, BY APPLICATION, 2021-2030 (USD MILLION)
TABLE 195 U.S. SMART HOSPITAL MARKET, BY DISTRIBUTION CHANNEL, 2021-2030 (USD MILLION)
TABLE 196 CANADA SMART HOSPITAL MARKET, BY COMPONENT, 2021-2030 (USD MILLION)
TABLE 197 CANADA HARDWARE IN SMART HOSPITAL MARKET, BY COMPONENT, 2021-2030 (USD MILLION)
TABLE 198 CANADA RFID SMART CABINETS IN SMART HOSPITAL MARKET, BY COMPONENT, 2021-2030 VOLUME (UNITS)
TABLE 199 CANADA RFID SMART CABINETS IN SMART HOSPITAL MARKET, BY COMPONENT, 2021-2030 ASP (USD)
TABLE 200 CANADA MEDICAL DEVICES IN SMART HOSPITAL MARKET, BY COMPONENT, 2021-2030 (USD MILLION)
TABLE 201 CANADA MEDICAL DEVICES IN SMART HOSPITAL MARKET, BY HARDWARE, 2021-2030, VOLUME (UNITS)
TABLE 202 CANADA MEDICAL DEVICES IN SMART HOSPITAL MARKET, BY HARDWARE, 2021-2030 ASP (USD)
TABLE 203 CANADA WEARABLE EXTERNAL MEDICAL DEVICES IN SMART HOSPITAL MARKET, BY HARDWARE, 2021-2030 (USD MILLION)
TABLE 204 CANADA MEDICAL DEVICES IN SMART HOSPITAL MARKET, BY HARDWARE, 2021-2030 VOLUME (UNITS)
TABLE 205 CANADA MEDICAL DEVICES IN SMART HOSPITAL MARKET, BY HARDWARE, 2021-2030 ASP (USD)
TABLE 206 CANADA WEARABLE VITAL MONITORING DEVICES IN SMART HOSPITAL MARKET, BY HARDWARE, 2021-2030 (USD MILLION)
TABLE 207 CANADA WEARABLE VITAL MONITORING DEVICES IN SMART HOSPITAL MARKET, BY HARDWARE, 2021-2030 VOLUME (UNITS)
TABLE 208 CANADA WEARABLE VITAL MONITORING DEVICES IN SMART HOSPITAL MARKET, BY HARDWARE, 2021-2030 ASP (USD)
TABLE 209 CANADA IMPLANTED MEDICAL DEVICES IN SMART HOSPITAL MARKET, BY HARDWARE, 2021-2030 (USD MILLION)
TABLE 210 CANADA IMPLANTED MEDICAL DEVICES IN SMART HOSPITAL MARKET, BY HARDWARE, 2021-2030 VOLUME (UNITS)
TABLE 211 CANADA IMPLANTED MEDICAL DEVICES IN SMART HOSPITAL MARKET, BY HARDWARE, 2021-2030 ASP (USD)
TABLE 212 CANADA ORGAN SYSTEMS IN SMART HOSPITAL MARKET, BY HARDWARE, 2021-2030 (USD MILLION)
TABLE 213 CANADA ORGAN SYSTEMS IN SMART HOSPITAL MARKET, BY HARDWARE, 2021-2030 VOLUME (UNITS)
TABLE 214 CANADA ORGAN SYSTEMS IN SMART HOSPITAL MARKET, BY HARDWARE, 2021-2030 ASP (USD)
TABLE 215 CANADA NEUROLOGICAL SOLUTIONS IN SMART HOSPITAL MARKET, BY HARDWARE, 2021-2030 (USD MILLION)
TABLE 216 CANADA NEUROLOGICAL SOLUTIONS IN SMART HOSPITAL MARKET, BY HARDWARE, 2021-2030 VOLUME (UNITS)
TABLE 217 CANADA NEUROLOGICAL SOLUTIONS IN SMART HOSPITAL MARKET, BY HARDWARE, 2021-2030 ASP (USD)
TABLE 218 CANADA SEMI CONDUCTOR COMPONENTS IN SMART HOSPITAL MARKET, BY HARDWARE, 2021-2030 (USD MILLION)
TABLE 219 CANADA SEMI CONDUCTOR COMPONENTS IN SMART HOSPITAL MARKET, BY HARDWARE, 2021-2030 VOLUME (UNITS)
TABLE 220 CANADA SEMI CONDUCTOR COMPONENTS IN SMART HOSPITAL MARKET, BY HARDWARE, 2021-2030 ASP (USD)
TABLE 221 CANADA SMART PILLS IN SMART HOSPITAL MARKET, BY HARDWARE, 2021-2030 (USD MILLION)
TABLE 222 CANADA SMART PILLS IN SMART HOSPITAL MARKET, BY HARDWARE, 2021-2030 VOLUME (UNITS)
TABLE 223 CANADA SMART PILLS, BY HARDWARE, 2021-2030 ASP (USD)
TABLE 224 CANADA SMART SYRINGES IN SMART HOSPITAL MARKET, BY HARDWARE, 2021-2030 (USD MILLION)
TABLE 225 CANADA SMART SYRINGES IN SMART HOSPITAL MARKET, BY HARDWARE, 2021-2030 VOLUME (UNITS)
TABLE 226 CANADA SMART SYRINGES IN SMART HOSPITAL MARKET, BY HARDWARE, 2021-2030 ASP (USD)
TABLE 227 CANADA SYSTEM AND SOFTWARE IN SMART HOSPITAL MARKET, BY COMPONENT, 2021-2030 (USD MILLION)
TABLE 228 CANADA MOBILE CLIENT DEVICES IN SMART HOSPITAL MARKET, BY SYSTEM AND SOFTWARE, 2021-2030 VOLUME (UNITS)
TABLE 229 CANADA MOBILE CLIENT DEVICES IN SMART HOSPITAL MARKET, BY SYSTEM AND SOFTWARE, 2021-2030 ASP (USD)
TABLE 230 CANADA REMOTE CARE SYSTEM IN SMART HOSPITAL MARKET, BY SYSTEM AND SOFTWARE, 2021-2030 (USD MILLION)
TABLE 231 CANADA REMOTE CARE SYSTEM IN SMART HOSPITAL MARKET, BY SYSTEM AND SOFTWARE, 2021-2030 VOLUME (UNITS)
TABLE 232 CANADA REMOTE CARE SYSTEM IN SMART HOSPITAL MARKET, BY SYSTEM AND SOFTWARE, 2021-2030 ASP (USD)
TABLE 233 CANADA IDENTIFICATION SYSTEMS IN SMART HOSPITAL MARKET, BY SYSTEM AND SOFTWARE, 2021-2030 (USD MILLION)
TABLE 234 CANADA IDENTIFICATION SYSTEMS IN SMART HOSPITAL MARKET, BY SYSTEM AND SOFTWARE, 2021-2030 VOLUME (UNITS)
TABLE 235 CANADA IDENTIFICATION SYSTEMS IN SMART HOSPITAL MARKET, BY SYSTEM AND SOFTWARE, 2021-2030 ASP (USD)
TABLE 236 CANADA INTERCONNECTED CLINICAL INFORMATION SYSTEMS IN SMART HOSPITAL MARKET, BY SYSTEM AND SOFTWARE, 2021-2030 (USD MILLION)
TABLE 237 CANADA INTERCONNECTED CLINICAL INFORMATION SYSTEMS IN SMART HOSPITAL MARKET, BY SYSTEM AND SOFTWARE, 2021-2030 VOLUME (UNITS)
TABLE 238 CANADA IDENTIFICATION SYSTEMS IN SMART HOSPITAL MARKET, BY SYSTEM AND SOFTWARE, 2021-2030 ASP (USD)
TABLE 239 CANADA DATA IN SMART HOSPITAL MARKET, BY SYSTEM AND SOFTWARE, 2021-2030 (USD MILLION)
TABLE 240 CANADA SERVICES IN SMART HOSPITAL MARKET, BY TYPE, 2021-2030 (USD MILLION)
TABLE 241 CANADA PROFESSIONAL SERVICES IN SMART HOSPITAL MARKET, BY TYPE, 2021-2030 (USD MILLION)
TABLE 242 CANADA DEPLOYMENT AND INTEGRATION SERVICES IN SMART HOSPITAL MARKET, BY TYPE, 2021-2030 (USD MILLION)
TABLE 243 CANADA SERVICES IN SMART HOSPITAL MARKET, BY SPECIALITY, 2021-2030 (USD MILLION)
TABLE 244 CANADA SMART HOSPITAL MARKET, BY CONNECTIVITY, 2021-2030 (USD MILLION)
TABLE 245 CANADA WIRELESS IN SMART HOSPITAL MARKET, BY CONNECTIVITY, 2021-2030 (USD MILLION)
TABLE 246 CANADA SMART HOSPITAL MARKET, BY TECHNOLOGY, 2021-2030 (USD MILLION)
TABLE 247 CANADA ARTIFICIAL INTELLIGENCE IN SMART HOSPITAL MARKET, BY OFFERING, 2021-2030 (USD MILLION)
TABLE 248 CANADA ARTIFICIAL INTELLIGENCE IN SMART HOSPITAL MARKET, BY TECHNOLOGY, 2021-2030 (USD MILLION)
TABLE 249 CANADA ARTIFICIAL INTELLIGENCE IN SMART HOSPITAL MARKET, BY APPLICATION, 2021-2030 (USD MILLION)
TABLE 250 CANADA INTERNET OF THINGS IN SMART HOSPITAL MARKET, BY OFFERING, 2021-2030 (USD MILLION)
TABLE 251 CANADA INTERNET OF THINGS IN SMART HOSPITAL MARKET, BY APPLICATION, 2021-2030 (USD MILLION)
TABLE 252 CANADA AUGMENTED REALITY (AR) IN SMART HOSPITAL MARKET, BY OFFERING, 2021-2030 (USD MILLION)
TABLE 253 CANADA AUGMENTED REALITY (AR) IN SMART HOSPITAL MARKET, BY TECHNOLOGY, 2021-2030 (USD MILLION)
TABLE 254 CANADA AUGMENTED REALITY (AR) IN SMART HOSPITAL MARKET, BY APPLICATION, 2021-2030 (USD MILLION)
TABLE 255 CANADA BIG DATA IN SMART HOSPITAL MARKET, BY OFFERING, 2021-2030 (USD MILLION)
TABLE 256 CANADA BIG DATA IN SMART HOSPITAL MARKET, BY TECHNOLOGY, 2021-2030 (USD MILLION)
TABLE 257 CANADA BIG DATA IN SMART HOSPITAL MARKET, BY TYPE, 2021-2030 (USD MILLION)
TABLE 258 CANADA BIG DATA IN SMART HOSPITAL MARKET, BY APPLICATION, 2021-2030 (USD MILLION)
TABLE 259 CANADA CLOUD COMPUTING IN SMART HOSPITAL MARKET, BY OFFERING, 2021-2030 (USD MILLION)
TABLE 260 CANADA CLOUD COMPUTING IN SMART HOSPITAL MARKET, BY DEPLOYMENT, 2021-2030 (USD MILLION)
TABLE 261 CANADA CLOUD COMPUTING IN SMART HOSPITAL MARKET, BY APPLICATION, 2021-2030 (USD MILLION)
TABLE 262 CANADA SMART HOSPITAL MARKET, BY APPLICATION, 2021-2030 (USD MILLION)
TABLE 263 CANADA SMART HOSPITAL MARKET, BY DISTRIBUTION CHANNEL, 2021-2030 (USD MILLION)
TABLE 264 MEXICO SMART HOSPITAL MARKET, BY COMPONENT, 2021-2030 (USD MILLION)
TABLE 265 MEXICO HARDWARE IN SMART HOSPITAL MARKET, BY COMPONENT, 2021-2030 (USD MILLION)
TABLE 266 MEXICO RFID SMART CABINETS IN SMART HOSPITAL MARKET, BY COMPONENT, 2021-2030 VOLUME (UNITS)
TABLE 267 MEXICO RFID SMART CABINETS IN SMART HOSPITAL MARKET, BY COMPONENT, 2021-2030 ASP (USD)
TABLE 268 MEXICO MEDICAL DEVICES IN SMART HOSPITAL MARKET, BY COMPONENT, 2021-2030 (USD MILLION)
TABLE 269 MEXICO MEDICAL DEVICES IN SMART HOSPITAL MARKET, BY HARDWARE, 2021-2030, VOLUME (UNITS)
TABLE 270 MEXICO MEDICAL DEVICES IN SMART HOSPITAL MARKET, BY HARDWARE, 2021-2030 ASP (USD)
TABLE 271 MEXICO WEARABLE EXTERNAL MEDICAL DEVICES IN SMART HOSPITAL MARKET, BY HARDWARE, 2021-2030 (USD MILLION)
TABLE 272 MEXICO MEDICAL DEVICES IN SMART HOSPITAL MARKET, BY HARDWARE, 2021-2030 VOLUME (UNITS)
TABLE 273 MEXICO MEDICAL DEVICES IN SMART HOSPITAL MARKET, BY HARDWARE, 2021-2030 ASP (USD)
TABLE 274 MEXICO WEARABLE VITAL MONITORING DEVICES IN SMART HOSPITAL MARKET, BY HARDWARE, 2021-2030 (USD MILLION)
TABLE 275 MEXICO WEARABLE VITAL MONITORING DEVICES IN SMART HOSPITAL MARKET, BY HARDWARE, 2021-2030 VOLUME (UNITS)
TABLE 276 MEXICO WEARABLE VITAL MONITORING DEVICES IN SMART HOSPITAL MARKET, BY HARDWARE, 2021-2030 ASP (USD)
TABLE 277 MEXICO IMPLANTED MEDICAL DEVICES IN SMART HOSPITAL MARKET, BY HARDWARE, 2021-2030 (USD MILLION)
TABLE 278 MEXICO IMPLANTED MEDICAL DEVICES IN SMART HOSPITAL MARKET, BY HARDWARE, 2021-2030 VOLUME (UNITS)
TABLE 279 MEXICO IMPLANTED MEDICAL DEVICES IN SMART HOSPITAL MARKET, BY HARDWARE, 2021-2030 ASP (USD)
TABLE 280 MEXICO ORGAN SYSTEMS IN SMART HOSPITAL MARKET, BY HARDWARE, 2021-2030 (USD MILLION)
TABLE 281 MEXICO ORGAN SYSTEMS IN SMART HOSPITAL MARKET, BY HARDWARE, 2021-2030 VOLUME (UNITS)
TABLE 282 MEXICO ORGAN SYSTEMS IN SMART HOSPITAL MARKET, BY HARDWARE, 2021-2030 ASP (USD)
TABLE 283 MEXICO NEUROLOGICAL SOLUTIONS IN SMART HOSPITAL MARKET, BY HARDWARE, 2021-2030 (USD MILLION)
TABLE 284 MEXICO NEUROLOGICAL SOLUTIONS IN SMART HOSPITAL MARKET, BY HARDWARE, 2021-2030 VOLUME (UNITS)
TABLE 285 MEXICO NEUROLOGICAL SOLUTIONS IN SMART HOSPITAL MARKET, BY HARDWARE, 2021-2030 ASP (USD)
TABLE 286 MEXICO SEMI CONDUCTOR COMPONENTS IN SMART HOSPITAL MARKET, BY HARDWARE, 2021-2030 (USD MILLION)
TABLE 287 MEXICO SEMI CONDUCTOR COMPONENTS IN SMART HOSPITAL MARKET, BY HARDWARE, 2021-2030 VOLUME (UNITS)
TABLE 288 MEXICO SEMI CONDUCTOR COMPONENTS IN SMART HOSPITAL MARKET, BY HARDWARE, 2021-2030 ASP (USD)
TABLE 289 MEXICO SMART PILLS IN SMART HOSPITAL MARKET, BY HARDWARE, 2021-2030 (USD MILLION)
TABLE 290 MEXICO SMART PILLS IN SMART HOSPITAL MARKET, BY HARDWARE, 2021-2030 VOLUME (UNITS)
TABLE 291 MEXICO SMART PILLS, BY HARDWARE, 2021-2030 ASP (USD)
TABLE 292 MEXICO SMART SYRINGES IN SMART HOSPITAL MARKET, BY HARDWARE, 2021-2030 (USD MILLION)
TABLE 293 MEXICO SMART SYRINGES IN SMART HOSPITAL MARKET, BY HARDWARE, 2021-2030 VOLUME (UNITS)
TABLE 294 MEXICO SMART SYRINGES IN SMART HOSPITAL MARKET, BY HARDWARE, 2021-2030 ASP (USD)
TABLE 295 MEXICO SYSTEM AND SOFTWARE IN SMART HOSPITAL MARKET, BY COMPONENT, 2021-2030 (USD MILLION)
TABLE 296 MEXICO MOBILE CLIENT DEVICES IN SMART HOSPITAL MARKET, BY SYSTEM AND SOFTWARE, 2021-2030 VOLUME (UNITS)
TABLE 297 MEXICO MOBILE CLIENT DEVICES IN SMART HOSPITAL MARKET, BY SYSTEM AND SOFTWARE, 2021-2030 ASP (USD)
TABLE 298 MEXICO REMOTE CARE SYSTEM IN SMART HOSPITAL MARKET, BY SYSTEM AND SOFTWARE, 2021-2030 (USD MILLION)
TABLE 299 MEXICO REMOTE CARE SYSTEM IN SMART HOSPITAL MARKET, BY SYSTEM AND SOFTWARE, 2021-2030 VOLUME (UNITS)
TABLE 300 MEXICO REMOTE CARE SYSTEM IN SMART HOSPITAL MARKET, BY SYSTEM AND SOFTWARE, 2021-2030 ASP (USD)
TABLE 301 MEXICO IDENTIFICATION SYSTEMS IN SMART HOSPITAL MARKET, BY SYSTEM AND SOFTWARE, 2021-2030 (USD MILLION)
TABLE 302 MEXICO IDENTIFICATION SYSTEMS IN SMART HOSPITAL MARKET, BY SYSTEM AND SOFTWARE, 2021-2030 VOLUME (UNITS)
TABLE 303 MEXICO IDENTIFICATION SYSTEMS IN SMART HOSPITAL MARKET, BY SYSTEM AND SOFTWARE, 2021-2030 ASP (USD)
TABLE 304 MEXICO INTERCONNECTED CLINICAL INFORMATION SYSTEMS IN SMART HOSPITAL MARKET, BY SYSTEM AND SOFTWARE, 2021-2030 (USD MILLION)
TABLE 305 MEXICO INTERCONNECTED CLINICAL INFORMATION SYSTEMS IN SMART HOSPITAL MARKET, BY SYSTEM AND SOFTWARE, 2021-2030 VOLUME (UNITS)
TABLE 306 MEXICO IDENTIFICATION SYSTEMS IN SMART HOSPITAL MARKET, BY SYSTEM AND SOFTWARE, 2021-2030 ASP (USD)
TABLE 307 MEXICO DATA IN SMART HOSPITAL MARKET, BY SYSTEM AND SOFTWARE, 2021-2030 (USD MILLION)
TABLE 308 MEXICO SERVICES IN SMART HOSPITAL MARKET, BY TYPE, 2021-2030 (USD MILLION)
TABLE 309 MEXICO PROFESSIONAL SERVICES IN SMART HOSPITAL MARKET, BY TYPE, 2021-2030 (USD MILLION)
TABLE 310 MEXICO DEPLOYMENT AND INTEGRATION SERVICES IN SMART HOSPITAL MARKET, BY TYPE, 2021-2030 (USD MILLION)
TABLE 311 MEXICO SERVICES IN SMART HOSPITAL MARKET, BY SPECIALITY, 2021-2030 (USD MILLION)
TABLE 312 MEXICO SMART HOSPITAL MARKET, BY CONNECTIVITY, 2021-2030 (USD MILLION)
TABLE 313 MEXICO WIRELESS IN SMART HOSPITAL MARKET, BY CONNECTIVITY, 2021-2030 (USD MILLION)
TABLE 314 MEXICO SMART HOSPITAL MARKET, BY TECHNOLOGY, 2021-2030 (USD MILLION)
TABLE 315 MEXICO ARTIFICIAL INTELLIGENCE IN SMART HOSPITAL MARKET, BY OFFERING, 2021-2030 (USD MILLION)
TABLE 316 MEXICO ARTIFICIAL INTELLIGENCE IN SMART HOSPITAL MARKET, BY TECHNOLOGY, 2021-2030 (USD MILLION)
TABLE 317 MEXICO ARTIFICIAL INTELLIGENCE IN SMART HOSPITAL MARKET, BY APPLICATION, 2021-2030 (USD MILLION)
TABLE 318 MEXICO INTERNET OF THINGS IN SMART HOSPITAL MARKET, BY OFFERING, 2021-2030 (USD MILLION)
TABLE 319 MEXICO INTERNET OF THINGS IN SMART HOSPITAL MARKET, BY APPLICATION, 2021-2030 (USD MILLION)
TABLE 320 MEXICO AUGMENTED REALITY (AR) IN SMART HOSPITAL MARKET, BY OFFERING, 2021-2030 (USD MILLION)
TABLE 321 MEXICO AUGMENTED REALITY (AR) IN SMART HOSPITAL MARKET, BY TECHNOLOGY, 2021-2030 (USD MILLION)
TABLE 322 MEXICO AUGMENTED REALITY (AR) IN SMART HOSPITAL MARKET, BY APPLICATION, 2021-2030 (USD MILLION)
TABLE 323 MEXICO BIG DATA IN SMART HOSPITAL MARKET, BY OFFERING, 2021-2030 (USD MILLION)
TABLE 324 MEXICO BIG DATA IN SMART HOSPITAL MARKET, BY TECHNOLOGY, 2021-2030 (USD MILLION)
TABLE 325 MEXICO BIG DATA IN SMART HOSPITAL MARKET, BY TYPE, 2021-2030 (USD MILLION)
TABLE 326 MEXICO BIG DATA IN SMART HOSPITAL MARKET, BY APPLICATION, 2021-2030 (USD MILLION)
TABLE 327 MEXICO CLOUD COMPUTING IN SMART HOSPITAL MARKET, BY OFFERING, 2021-2030 (USD MILLION)
TABLE 328 MEXICO CLOUD COMPUTING IN SMART HOSPITAL MARKET, BY DEPLOYMENT, 2021-2030 (USD MILLION)
TABLE 329 MEXICO CLOUD COMPUTING IN SMART HOSPITAL MARKET, BY APPLICATION, 2021-2030 (USD MILLION)
TABLE 330 MEXICO SMART HOSPITAL MARKET, BY APPLICATION, 2021-2030 (USD MILLION)
TABLE 331 MEXICO SMART HOSPITAL MARKET, BY DISTRIBUTION CHANNEL, 2021-2030 (USD MILLION)
List of Figure
FIGURE 1 NORTH AMERICA SMART HOSPITAL MARKET: SEGMENTATION
FIGURE 2 NORTH AMERICA SMART HOSPITAL MARKET: DATA TRIANGULATION
FIGURE 3 NORTH AMERICA SMART HOSPITAL MARKET: DROC ANALYSIS
FIGURE 4 NORTH AMERICA SMART HOSPITAL MARKET: NORTH AMERICA VS REGIONAL MARKET ANALYSIS
FIGURE 5 NORTH AMERICA SMART HOSPITAL MARKET: COMPANY RESEARCH ANALYSIS
FIGURE 6 NORTH AMERICA SMART HOSPITAL MARKET: INTERVIEW DEMOGRAPHICS
FIGURE 7 NORTH AMERICA SMART HOSPITAL MARKET: DBMR MARKET POSITION GRID
FIGURE 8 NORTH AMERICA SMART HOSPITAL MARKET: MARKET APPLICATION COVERAGE GRID
FIGURE 9 NORTH AMERICA SMART HOSPITAL MARKET: VENDOR SHARE ANALYSIS
FIGURE 10 NORTH AMERICA SMART HOSPITAL MARKET: SEGMENTATION
FIGURE 11 INCREASING DEMAND FOR WIRELESS DEVICES AND RISING HEALTHCARE EXPENDITURE ARE EXPECTED TO DRIVE THE NORTH AMERICA SMART HOSPITAL MARKET IN THE FORECAST PERIOD OF 2023 TO 2030
FIGURE 12 THE HARDWARE SEGMENT IS EXPECTED TO ACCOUNT FOR THE LARGEST SHARE OF THE NORTH AMERICA SMART HOSPITAL MARKET IN 2023 & 2030
FIGURE 13 DRIVERS, RESTRAINTS, OPPORTUNITIES, AND CHALLENGES OF THE NORTH AMERICA SMART HOSPITAL MARKET
FIGURE 14 NORTH AMERICA SMART HOSPITAL MARKET: BY COMPONENT, 2022
FIGURE 15 NORTH AMERICA SMART HOSPITAL MARKET: BY COMPONENT, 2023-2030 (USD MILLION)
FIGURE 16 NORTH AMERICA SMART HOSPITAL MARKET: BY COMPONENT, CAGR (2023-2030)
FIGURE 17 NORTH AMERICA SMART HOSPITAL MARKET: BY COMPONENT, LIFELINE CURVE
FIGURE 18 NORTH AMERICA SMART HOSPITAL MARKET: BY CONNECTIVITY, 2022
FIGURE 19 NORTH AMERICA SMART HOSPITAL MARKET: BY CONNECTIVITY, 2023-2030 (USD MILLION)
FIGURE 20 NORTH AMERICA SMART HOSPITAL MARKET: BY CONNECTIVITY, CAGR (2023-2030)
FIGURE 21 NORTH AMERICA SMART HOSPITAL MARKET: BY CONNECTIVITY, LIFELINE CURVE
FIGURE 22 NORTH AMERICA SMART HOSPITAL MARKET: BY TECHNOLOGY, 2022
FIGURE 23 NORTH AMERICA SMART HOSPITAL MARKET: BY TECHNOLOGY, 2023-2030 (USD MILLION)
FIGURE 24 NORTH AMERICA SMART HOSPITAL MARKET: BY TECHNOLOGY, CAGR (2023-2030)
FIGURE 25 NORTH AMERICA SMART HOSPITAL MARKET: BY TECHNOLOGY, LIFELINE CURVE
FIGURE 26 NORTH AMERICA SMART HOSPITAL MARKET: BY APPLICATION, 2022
FIGURE 27 NORTH AMERICA SMART HOSPITAL MARKET: BY APPLICATION, 2023-2030 (USD MILLION)
FIGURE 28 NORTH AMERICA SMART HOSPITAL MARKET: BY APPLICATION, CAGR (2023-2030)
FIGURE 29 NORTH AMERICA SMART HOSPITAL MARKET: BY APPLICATION, LIFELINE CURVE
FIGURE 30 NORTH AMERICA SMART HOSPITAL MARKET: BY DISTRIBUTION CHANNEL, 2022
FIGURE 31 NORTH AMERICA SMART HOSPITAL MARKET: BY DISTRIBUTION CHANNEL, 2023-2030 (USD MILLION)
FIGURE 32 NORTH AMERICA SMART HOSPITAL MARKET: BY DISTRIBUTION CHANNEL, CAGR (2023-2030)
FIGURE 33 NORTH AMERICA SMART HOSPITAL MARKET: BY DISTRIBUTION CHANNEL, LIFELINE CURVE
FIGURE 34 NORTH AMERICA SMART HOSPITAL MARKET: SNAPSHOT (2022)
FIGURE 35 NORTH AMERICA SMART HOSPITAL MARKET: BY COUNTRY (2022)
FIGURE 36 NORTH AMERICA SMART HOSPITAL MARKET: BY COUNTRY (2023 & 2030)
FIGURE 37 NORTH AMERICA SMART HOSPITAL MARKET: BY COUNTRY (2022 & 2030)
FIGURE 38 NORTH AMERICA SMART HOSPITAL MARKET: BY COMPONENT (2023-2030)
FIGURE 39 NORTH AMERICA SMART HOSPITAL MARKET: COMPANY SHARE 2022 (%)
Data collection and base year analysis are done using data collection modules with large sample sizes. The stage includes obtaining market information or related data through various sources and strategies. It includes examining and planning all the data acquired from the past in advance. It likewise envelops the examination of information inconsistencies seen across different information sources. The market data is analysed and estimated using market statistical and coherent models. Also, market share analysis and key trend analysis are the major success factors in the market report. To know more, please request an analyst call or drop down your inquiry.
The key research methodology used by DBMR research team is data triangulation which involves data mining, analysis of the impact of data variables on the market and primary (industry expert) validation. Data models include Vendor Positioning Grid, Market Time Line Analysis, Market Overview and Guide, Company Positioning Grid, Patent Analysis, Pricing Analysis, Company Market Share Analysis, Standards of Measurement, Global versus Regional and Vendor Share Analysis. To know more about the research methodology, drop in an inquiry to speak to our industry experts.
Data Bridge Market Research is a leader in advanced formative research. We take pride in servicing our existing and new customers with data and analysis that match and suits their goal. The report can be customized to include price trend analysis of target brands understanding the market for additional countries (ask for the list of countries), clinical trial results data, literature review, refurbished market and product base analysis. Market analysis of target competitors can be analyzed from technology-based analysis to market portfolio strategies. We can add as many competitors that you require data about in the format and data style you are looking for. Our team of analysts can also provide you data in crude raw excel files pivot tables (Fact book) or can assist you in creating presentations from the data sets available in the report.


