
North America Stroke Market
Market Size in USD Billion
 USD
13.25 Billion
USD
23.96 Billion
2024
2032
USD
13.25 Billion
USD
23.96 Billion
2024
2032
| 2025 - 2032 | |
| USD 13.25 Billion | |
| USD 23.96 Billion | |
| % | |
|
Stroke Market Analysis
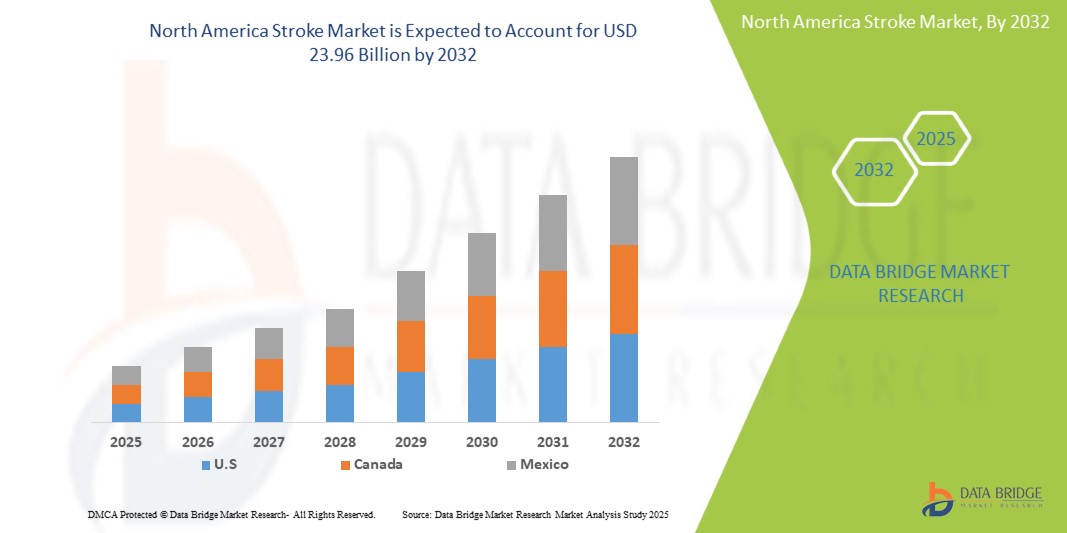
The North America stroke market is a rapidly growing sector within the healthcare industry, focused on products and services aimed at preventing, diagnosing, treating, and rehabilitating stroke patients. Key components in this market include pharmaceuticals (such as thrombolytics, antiplatelet agents, and anticoagulants), medical devices (like vascular stents and neuroprotective devices), and rehabilitation equipment (including physical therapy tools and speech therapy aids). Growth is driven by factors such as increasing awareness of stroke prevention, advancements in medical technology, and a rising geriatric population that is more susceptible to stroke. The increasing prevalence of non-communicable diseases, particularly hypertension and diabetes, further contributes to the demand for effective stroke care.
Stroke Market Size
The North America stroke market is expected to reach USD 23.96 billion by 2032 from USD 13.25 billion in 2024, growing at a CAGR of 8.0% in the forecast period of 2025 to 2032. In addition to the insights on market scenarios such as market value, growth rate, segmentation, geographical coverage, and major players, the market reports curated by the Data Bridge Market Research also include depth expert analysis, patient epidemiology, pipeline analysis, pricing analysis, and regulatory framework.
Stroke Market Trends
“Increasing adoption of advanced neuroimaging technologies and telemedicine solutions for stroke diagnosis and management”
One notable trend in the North America stroke market is the increasing adoption of advanced neuroimaging technologies and telemedicine solutions for stroke diagnosis and management. As awareness around the critical importance of rapid intervention in stroke treatment grows, there is a significant shift towards utilizing sophisticated imaging techniques, such as MRI and CT scans, which enable quicker and more accurate diagnosis of stroke types. In addition, telemedicine is becoming integral in providing timely consultations and remote monitoring, particularly in rural or underserved areas, allowing healthcare professionals to assess patients and initiate treatments promptly. This trend not only enhances patient outcomes but also drives innovation and investment within the stroke care continuum.
Report Scope and Stroke Market Segmentation
|
Attributes |
Stroke Key Market Insights |
|
Segments Covered |
|
|
Countries Covered |
U.S. , Canada, and Mexico |
|
Key Market Players |
Bristol-Myers Squibb Company (U.S.), Boehringer Ingelheim International GmbH (Germany), F. Hoffmann-La Roche Ltd (Switzerland), DAIICHI SANKYO COMPANY, LIMITED (Japan), Sanofi (France), Johnson & Johnson Services, Inc. (U.S.), Bayer AG (Germany), Sandoz AG (Switzerland), Pfizer Inc. (U.S.), Medtronic (Ireland), Abbott (U.S.), Viatris Inc. (U.S.), AstraZeneca (U.K.), Penumbra, Inc. (U.S.), GLENMARK PHARMACEUTICALS LTD (India), Fresenius SE & Co. KGaA (Germany), Teva Pharmaceuticals USA, Inc. (Israel), Lupin (India), and Amneal Pharmaceuticals LLC (U.S.) among others |
|
Market Opportunities |
|
|
Value Added Data Infosets |
In addition to the insights on market scenarios such as market value, growth rate, segmentation, geographical coverage, and major players, the market reports curated by the Data Bridge Market Research also include depth expert analysis, patient epidemiology, pipeline analysis, pricing analysis, and regulatory framework. |
Stroke Market Definition
The North America stroke market encompasses the various products, services, and technologies involved in the prevention, diagnosis, treatment, and rehabilitation of stroke patients worldwide. This includes a range of medical devices, pharmaceuticals, imaging equipment, and therapeutic solutions aimed at addressing the complexities of stroke care. The market is driven by the rising incidence of stroke due to aging populations, lifestyle factors, and increased awareness of stroke symptoms and treatment options. In addition, advancements in healthcare technologies and telemedicine are shaping the landscape, facilitating better patient management and improving outcomes in stroke care across diverse demographics and healthcare settings.
Stroke Market Dynamics
Drivers
- Rising Incidences of Stroke Drive Demand for Treatments
The rising incidence of stroke is a significant driver in the stroke market, influencing both the demand for treatment and healthcare infrastructure. Stroke, a leading cause of disability and death worldwide, is increasingly common due to various risk factors, including aging populations, sedentary lifestyles, high blood pressure, diabetes, smoking, and poor diet. As life expectancy increases and populations age, the prevalence of conditions that contribute to stroke, such as hypertension and atrial fibrillation, has also risen, resulting in more people suffering from strokes and requiring immediate medical attention and long-term rehabilitation.
For instance,
In May 2023, according to the article published in eClinicalMedicine, stroke the second leading cause of death and third leading cause of disability worldwide. Over the past 30 years, there has been an increase in the absolute number of incident (70%) and prevalent (85%) strokes, as well as deaths (43%) from stroke.
- Increasing Number of Patients with Hypertension and Coronary Heart Diseases
Hypertension, commonly known as high blood pressure, is a medical condition characterized by elevated force of blood against the walls of arteries. It is typically defined by a blood pressure reading of 130/80 mm Hg or higher and can be categorized as either essential (primary) or secondary, depending on its underlying cause. Prolonged hypertension can lead to a range of serious health issues, with one of the most significant being coronary heart disease. Coronary heart disease, also known as coronary artery disease, results from the gradual accumulation of fatty deposits (atherosclerosis) in the coronary arteries, which supply oxygen and nutrients to the heart muscle. As these arteries narrow or become blocked, blood flow to the heart is reduced, leading to chest pain (angina) and, in severe cases, heart attacks.
For instance,
In September 2023, according to an article published in Pan American Health Organization Journal, Hypertension, often asymptomatic, significantly contributes to cardiovascular diseases, which are the leading cause of death. Factors such as aging, obesity, and poor lifestyle choices are fueling the rising prevalence, demanding effective treatments.
Opportunities
- Development of Advanced Therapeutics for Strokes
The development of advanced therapeutics presents a significant opportunity for the stroke market by addressing the substantial unmet needs in stroke care. Current treatments, primarily focused on restoring blood flow through thrombolysis or thrombectomy, are effective only within a narrow time window and do not address the underlying neuronal damage. Advanced therapeutics, such as neuroprotective agents, cell-based therapies, and targeted drug delivery systems, promise to mitigate this damage, promote neuronal repair, and improve long-term functional outcomes for stroke patients. This will lead to a decrease in disability, reduced healthcare costs associated with long-term care, and improved quality of life for survivors, thus expanding the market potential by attracting investment and driving demand for more effective treatments.
For instance,
In April 2022, according to an article published by the American Heart Association Journals, the treatment of acute ischemic stroke continues to advance. Tenecteplase has been evaluated as an alternative thrombolytic drug and evidence suggests that it is as least as effective as alteplase and may lyse large vessel clots more effectively. Endovascular therapy with mechanical thrombectomy has now been shown to be beneficial up to 24 hours after stroke onset in carefully selected patients with proximal, large vessel occlusions.
- Expansion in Stroke Rehabilitation Services
The expansion of stroke rehabilitation services presents a substantial opportunity for the stroke market by addressing the growing need for more effective recovery and rehabilitation programs. Currently, stroke survivors often face significant challenges in regaining lost motor and cognitive functions, leading to prolonged hospital stays, increased medical costs, and reduced quality of life. As the global population ages and stroke incidence rates rise, there is a pressing need for enhanced rehabilitation services that cater to the individual needs of stroke survivors. By expanding stroke rehabilitation services, healthcare providers and payers can address the unmet demand for comprehensive and personalized care, leading to better patient outcomes, reduced healthcare costs, and increased patient satisfaction.
For instance,
In April 2023, according to an article published by the MDPI, developed countries make efforts to provide rehabilitation for stroke patients. Physical rehabilitation can reduce or prevent known complications in stroke patients while also improving their quality of life. Therapists choose interventions based on impairments, activity limitations, and goals of recovery.
Restraints/Challenges
- High Cost of Diagnosis
Heart disease and stroke are one of the major factors of increasing mortality rate globally over the years. Stroke can be ranked among the most costly chronic diseases. More than 868,000 Americans die due to heart disease or stroke every year—that’s one-third of all deaths. With the increasing incidence of stroke, the cost of diagnosis and treatment has increased over the years which is the major restraining factor.
The majority of patients not only endure life-long disabilities that affect their livelihood but also have an enormous societal economic impact. The cost of diagnosis has also increased with the rise in technological advancement.
For instance,
According to the Agency for Healthcare Research and Quality, the average hospital admission for ischemic stroke (which includes diagnosis & stay) is 5.6 days at USD 9,100 per stay, and for hemorrhagic stroke, it is 8.4 days at USD 19,500 per stay.
- Increase in Product Recall
A wide range of diagnostic devices for stroke are used by professionals for performing different procedures on various patients of different age groups. Thus, side effects and complications associated with the use of these devices can cause serious harm to the patients.
Also these diagnostic devices and products are very expensive and highly risky for which a potential failure may cause serious consequences to the patient. Therefore, they are strictly regulated and recalled for the safety of patients.
For instance,
Neusoft Medical Systems Co., Ltd. Company’s product NeuViz 64 Multi-slice CT Scanner System Product which is a Multi-Slice CT Scanner System used as a whole body computed tomography x-ray system featuring a continuously rotating x-ray tube and detector array have been recalled by FDA due to the software error into the system.
This market report provides details of new recent developments, trade regulations, import-export analysis, production analysis, value chain optimization, market share, impact of domestic and localized market players, analyses opportunities in terms of emerging revenue pockets, changes in market regulations, strategic market growth analysis, market size, category market growths, application niches and dominance, product approvals, product launches, geographic expansions, technological innovations in the market. To gain more info on the market contact Data Bridge Market Research for an Analyst Brief, our team will help you take an informed market decision to achieve market growth.
Stroke Market Scope
The market is categorized into five notable segments based on type, diagnosis and treatment, gender, end user, and distribution channel. The growth amongst these segments will help you analyze meagre growth segments in the industries and provide the users with a valuable market overview and market insights to help them make strategic decisions for identifying core market applications.
Type
- Ischemic Stroke
- Thrombotic (Cerebral Thrombosis)
- Embolic (Cerebral Embolism)
- Hemorrhagic Stroke
- Subarachnoid Hemorrhage
- Intracerebral Hemorrhage
- Transient Ischemic Attact (TIA)
Diagnostic & Treatment
- Treatment
- Medication
- By Class
- Blood Pressure Medicines
- Angiotensin-Converting Enzyme (ACE) Inhibitors
- Ramipril
- Lisinopril
- Enalapril
- Perindopril
- Other
- Thiazide Diuretics
- Indapamide
- Bendroflumethiazide
- Spironolactone
- Amiloride
- Other
- Calcium Channel Blockers
- Amlodipine
- Nifedipine
- Verapamil
- Nicardipine
- Felodipine
- Nimodipine
- Other
- Beta Blockers
- Atenolol
- Bisoprolol
- Labetolol
- Others
- Alpha-Blockers
- Doxazosin
- Others
- Others
- Angiotensin-Converting Enzyme (ACE) Inhibitors
- Antiplatelet Drugs
- Aspirin
- Clopidogrel
- Dipyridamole
- Ticlopidine
- Others
- Anticoagulants
- Warfarin
- Apixaban
- Dabigatran
- Heparin
- Rivaroxaban
- Other
- Tissue Plasminogen Activator (TPA)
- Alteplase
- Tenecteplase
- Reteplase
- Anistreplase
- Other
- Statins
- Atorvastatin
- Simvastatin
- Lovastatin
- Rosuvastatin
- Fluvastatin
- Pravastatin
- Pitavastatin
- Others
- Vitamin K
- Supportive Medication
- Nutritional Supplements
- Antipyretics
- Others
- Blood Pressure Medicines
- By Drug Type
- Branded
- Activase
- Edobaxan
- Coumadin
- Heparin Leo
- Duoplavin
- Aggrenox
- Retavase
- Jantoven
- Cathflo
- Other
- Branded
- Generic
- By Route of administration
- Oral
- Tablet
- Capsules
- Others
- Parenteral
- Intravenous
- Subcutaneous
- Others
- Oral
- By Mode of Purchase
- Prescription
- Over the Counter (OTC)
- By Therapy Type
- Combination Therapy
- Monotherapy
- By Route of administration
- Surgery
- Embolic Coils
- Aspiration Catheters
- Stent Retriever
- Surgical Clipping
- Others
- Others Therapy
- Physical Therapy
- Occupational Therapy
- Speech Therapy
- Others
- By Class
- Diagnosis
- Imaging Test
- Computerized Tomography (CT) Scan
- Magnetic Resonance Imaging (MRI)
- Carotid Ultrasound
- Cerebral Angiogram
- Blood Test
- Echocardiogram
- Lumbar Puncture
- Others
- Imaging Test
- Medication
Gender
- Female
- Male
End User
- Hospitals & Clinics
- Specialty Clinics
- Ambulatory Surgical Center
- Homecare
- Laboratories
- Others
Distribution Channel
- Direct
- Retail
- Online
Stroke Market Regional Analysis
The market is analyzed and market size insights and trends are provided by type, diagnosis & treatment, gender, end user, and distribution channel as referenced above.
The countries covered in the market are U.S., Canada, and Mexico
U.S. is expected to dominate and fastest growing country in the stroke market, driven by a high disease burden, urbanization, and expanding diagnostic and therapeutic access. Government focus on NCDs and private sector investment are accelerating market growth.
The country section of the report also provides individual market impacting factors and changes in regulation in the market domestically that impacts the current and future trends of the market. Data points like down-stream and upstream value chain analysis, technical trends and porter's five forces analysis, case studies are some of the pointers used to forecast the market scenario for individual countries. Also, the presence and availability of North America brands and their challenges faced due to large or scarce competition from local and domestic brands, impact of domestic tariffs and trade routes are considered while providing forecast analysis of the country data.
Stroke Market Share
The market competitive landscape provides details by competitor. Details included are company overview, company financials, revenue generated, market potential, investment in research and development, new market initiatives, North America presence, production sites and facilities, production capacities, company strengths and weaknesses, product launch, product width and breadth, application dominance. The above data points provided are only related to the companies' focus related to market.
Stroke Market Leaders Operating in the Market Are:
- Bristol-Myers Squibb Company (U.S.)
- Boehringer Ingelheim International GmbH (Germany)
- F. Hoffmann-La Roche Ltd (Switzerland)
- DAIICHI SANKYO COMPANY, LIMITED (Japan)
- Sanofi (France)
- Johnson & Johnson Services, Inc. (U.S.)
- Bayer AG (Germany)
- Sandoz AG (Switzerland)
- Pfizer Inc. (U.S.)
- Medtronic (Ireland)
- Abbott (U.S.)
- Viatris Inc. (U.S.)
- AstraZeneca (U.K.)
- Penumbra, Inc. (U.S.)
- GLENMARK PHARMACEUTICALS LTD (India)
- Fresenius SE & Co. KGaA (Germany)
- Teva Pharmaceuticals USA, Inc. (Israel)
- Lupin (India)
- Amneal Pharmaceuticals LLC (U.S.)
Latest Developments in Stroke Market
- In July 2023, Roche announced a new partnership with Alnylam to develop and commercialize zilebesir, an investigational RNAi therapy currently in Phase 2 for the treatment of high blood pressure. This collaboration combines Alnylam's proven experience in RNAi therapy with Roche's global commercial reach, commitment to innovation and desire to change the landscape for patients with serious cardiovascular disease
- In September 2020, Daiichi Sankyo Company Limited announced that it has submitted a supplemental application in Japan for the extended approval of the anticoagulant edoxaban (edoxaban benzoate hydrate) in elderly patients with nonvalvular regurgitation and severe bleeding. Risk. This application is based on the results of a Japanese Phase 3 clinical trial (ELDERCARE-AF trial) in 984 patients with non-valvular atrial fibrillation who are at least 80 years old and have a high risk of bleeding and are not suitable for other available anticoagulant therapies. Daiichi Sankyo plans to contribute to the treatment of elderly patients with non-valvular atrial fibrillation by offering a new treatment option
- In July 2022, Sandoz, the world's leading manufacturer of generics and biosimilars, announced an investment of approximately USD 90 million in its facility in Ljubljana, Slovenia, to establish its Sandoz Biopharma Development Center by 2026. With this investment, the Ljubljana site will become one of Sandoz's most important biosimilar product development sites. The new office will result in the creation of approximately 200 new full-time jobs and will further strengthen the company's capabilities in the development of biosimilars and pharmaceutical products
- In January 2023, Penumbra, Inc., a healthcare company focused on innovative therapies, announced the US Food and Drug Administration (FDA) approval and launch of Lightning Flash, the most advanced and powerful mechanical thrombectomy system on the market. Lightning Flash features Penumbra's new Lightning Intelligent Aspiration technology, which now has two clot detection algorithms. Combined with innovative catheter technology, the Lightning Flash is designed to quickly remove large blood clots from the body, including venous embolism and Pulmonary Embolism (PE). This launch will help the company expand its product portfolio because the advanced results of this new technology are exceptionally traceable and its unique ability to differentiate flowing blood from clots
- In August 2023, Lupin has announced the launch of Jeet, a patient support program dedicated to heart health. The launch of the initiative coincides with India's 77th Independence Day, which symbolizes freedom from disease-related stress and the journey to a happier and healthier life. Jeet becomes a trusted partner in cardiovascular care by offering various benefits such as cost savings, medical assistance, medication reminders and lifestyle support. Jeet offers a holistic approach to improving the physician and patient experience by increasing awareness of cardiovascular disease and its comorbidities. The app includes features designed to encourage a healthier lifestyle and support a healthy heart
SKU-

- Interactive Data Analysis Dashboard
- Company Analysis Dashboard for high growth potential opportunities
- Research Analyst Access for customization & queries
- Competitor Analysis with Interactive dashboard
- Latest News, Updates & Trend analysis
- Harness the Power of Benchmark Analysis for Comprehensive Competitor Tracking
Table of Content
1 INTRODUCTION
1.1 OBJECTIVES OF THE STUDY
1.2 MARKET DEFINITION
1.3 LIMITATIONS
1.4 MARKETS COVERED
2 MARKET SEGMENTATION
2.1 MARKETS COVERED
2.2 GEOGRAPHICAL SCOPE
2.3 YEARS CONSIDERED FOR THE STUDY
2.4 CURRENCY AND PRICING
2.5 DBMR TRIPOD DATA VALIDATION MODEL
2.6 MULTIVARIATE MODELLING
2.7 TYPE LIFELINE CURVE
2.8 PRIMARY INTERVIEWS WITH KEY OPINION LEADERS
2.9 DBMR MARKET POSITION GRID
2.1 MARKET END USER COVERAGE GRID
2.11 VENDOR SHARE ANALYSIS
2.12 SECONDARY SOURCES
2.13 ASSUMPTIONS
3 EXECUTIVE SUMMARY
4 PREMIUM INSIGHTS
4.1 PESTEL ANALYSIS
4.2 PORTER’S FIVE FORCES
5 NORTH AMERICA STROKE MARKET, REGULATORY FRAMEWORK
5.1 REGULATION IN U.S.
5.2 REGULATION IN EUROPE
5.3 REGULATION IN CHINA
5.4 REGULATION IN JAPAN
5.5 REGULATION IN SOUTH AFRICA
6 MARKET OVERVIEW
6.1 DRIVERS
6.1.1 RISING INCIDENCES OF STROKE DRIVE DEMAND FOR TREATMENTS
6.1.2 INCREASING NUMBER OF PATIENTS WITH HYPERTENSION AND CORONARY HEART DISEASES
6.1.3 INCREASING DIABETIC AND OBESE POPULATIONS ELEVATE STROKE RISKS
6.1.4 ADVANCEMENTS IN MEDICAL TECHNOLOGY IMPROVE STROKE CARE OUTCO.MES
6.2 RESTRAINTS
6.2.1 HIGH COST OF DIAGNOSIS
6.2.2 INCREASE IN PRODUCT RECALL
6.3 OPPORTUNITIES
6.3.1 DEVELOPMENT OF ADVANCED THERAPEUTICS FOR STROKES
6.3.2 EXPANSION IN STROKE REHABILITATION SERVICES
6.3.3 INNOVATIVE TREATMENTS IN PIPELINE FOR STROKE TREATMENT
6.4 CHALLENGES
6.4.1 FALSE DIAGNOSIS IN STROKES
6.4.2 COMPLICATIONS ASSOCIATED WITH MANAGING STROKE
7 NORTH AMERICA STROKE MARKET, BY TYPE
7.1 OVERVIEW
7.2 ISCHEMIC STROKE
7.2.1 THROMBOTIC (CEREBRAL THROMBOSIS)
7.2.2 EMBOLIC (CEREBRAL EMBOLISM)
7.3 HEMORRHAGIC STROKE
7.3.1 SUBARACHNOID HEMORRHAGE
7.3.2 INTRACEREBRAL HEMORRHAGE
7.4 TRANSIENT ISCHEMIC ATTACT (TIA)
8 NORTH AMERICA STROKE MARKET, BY GENDER
8.1 OVERVIEW
8.2 FEMALE
8.3 MALE
9 NORTH AMERICA STROKE MARKET, BY DIAGNOSIS AND TREATMENT
9.1 OVERVIEW
9.2 TREATMENT
9.2.1 BY TREATMENT TYPE
9.2.1.1 MEDICATION
9.2.1.1.1 MEDICATION, BY CLASS
9.2.1.1.1.1 BLOOD PRESSURE MEDICINES
9.2.1.1.1.1.1 ANGIOTENSIN-CONVERTING ENZYME (ACE) INHIBITORS
9.2.1.1.1.1.2 RAMIPRIL
9.2.1.1.1.1.3 LISINOPRIL
9.2.1.1.1.1.4 ENALAPRIL
9.2.1.1.1.1.5 PERINDOPRIL
9.2.1.1.1.1.6 OTHER
9.2.1.1.1.2 THIAZIDE DIURETICS
9.2.1.1.1.2.1 INDAPAMIDE
9.2.1.1.1.2.2 BENDROFLUMETHIAZIDE
9.2.1.1.1.2.3 SPIRONOLACTONE
9.2.1.1.1.2.4 AMILORIDE
9.2.1.1.1.2.5 OTHER
9.2.1.1.1.3 CALCIUM CHANNEL BLOCKERS
9.2.1.1.1.3.1 AMLODIPINE
9.2.1.1.1.3.2 NIFEDIPINE
9.2.1.1.1.3.3 VERAPAMIL
9.2.1.1.1.3.4 NICARDIPINE
9.2.1.1.1.3.5 FELODIPINE
9.2.1.1.1.3.6 NIMODIPINE
9.2.1.1.1.3.7 OTHERS
9.2.1.1.1.4 BETA BLOCKERS
9.2.1.1.1.4.1 ATENOLOL
9.2.1.1.1.4.2 BISOPROLOL
9.2.1.1.1.4.3 LABETOLOL
9.2.1.1.1.4.4 OTHERS
9.2.1.1.1.5 ALPHA-BLOCKERS
9.2.1.1.1.5.1 DOXAZOSIN
9.2.1.1.1.5.2 OTHERS
9.2.1.1.1.6 OTHERS
9.2.1.1.1.7 ANTIPLATELET DRUGS
9.2.1.1.1.7.1 ASPIRIN
9.2.1.1.1.7.2 CLOPIDOGREL
9.2.1.1.1.7.3 DIPYRIDAMOLE
9.2.1.1.1.7.4 TICLOPIDINE
9.2.1.1.1.7.5 OTHERS
9.2.1.1.1.8 ANTICOAGULANTS
9.2.1.1.1.8.1 WARFARIN
9.2.1.1.1.8.2 APIXABAN
9.2.1.1.1.8.3 DABIGATRAN
9.2.1.1.1.8.4 HEPARIN
9.2.1.1.1.8.5 RIVAROXABAN
9.2.1.1.1.8.6 OTHERS
9.2.1.1.1.9 TISSUE PLASMINOGEN ACTIVATOR (TPA)
9.2.1.1.1.9.1 ALTEPLASE
9.2.1.1.1.9.2 TENECTEPLASE
9.2.1.1.1.9.3 RETEPLASE
9.2.1.1.1.9.4 ANISTREPLASE
9.2.1.1.1.9.5 OTHERS
9.2.1.1.1.10 STATINS
9.2.1.1.1.10.1.1 ATORVASTATIN
9.2.1.1.1.10.1.2 SIMVASTATIN
9.2.1.1.1.10.1.3 LOVASTATIN
9.2.1.1.1.10.1.4 ROSUVASTATIN
9.2.1.1.1.10.1.5 FLUVASTATIN
9.2.1.1.1.10.1.6 PRAVASTATIN
9.2.1.1.1.10.1.7 PITAVASTATIN
9.2.1.1.1.10.1.8 OTHERS
9.2.1.1.1.11 VITAMIN K
9.2.1.1.1.12 SUPPORTIVE MEDICATION
9.2.1.1.1.12.1 NUTRITIONAL SUPPLEMENTS
9.2.1.1.1.12.2 ANTIPYRETICS
9.2.1.1.1.12.3 OTHERS
9.2.1.1.2 MEDICATION, BY DRUG TYPE
9.2.1.1.2.1 BRANDED
9.2.1.1.2.1.1 ACTIVASE
9.2.1.1.2.1.2 EDOBAXAN
9.2.1.1.2.1.3 COUMADIN
9.2.1.1.2.1.4 HEPARIN LEO
9.2.1.1.2.1.5 DUOPLAVIN
9.2.1.1.2.1.6 AGGRENOX
9.2.1.1.2.1.7 RETAVASE
9.2.1.1.2.1.8 JANTOVEN
9.2.1.1.2.1.9 CATHFLO
9.2.1.1.2.1.10 OTHER
9.2.1.1.2.2 GENERIC
9.2.1.1.3 MEDICATION, BY ROUTE OF ADMINISTRATION
9.2.1.1.3.1 ORAL
9.2.1.1.3.1.1 TABLET
9.2.1.1.3.1.2 CAPSULES
9.2.1.1.3.1.3 OTHERS
9.2.1.1.3.2 PARENTERAL
9.2.1.1.3.2.1 INTRAVENOUS
9.2.1.1.3.2.2 SUBCUTANEOUS
9.2.1.1.3.3 OTHERS
9.2.1.1.4 MEDICATION, BY MODE OF PURCHASE
9.2.1.1.4.1 PRESCRIPTION
9.2.1.1.4.2 OVER THE COUNTER (OTC)
9.2.1.1.5 MEDICATION, BY THERAPY TYPE
9.2.1.1.5.1 COMBINATION THERAPY
9.2.1.1.5.2 MONOTHERAPY
9.2.1.2 SURGERY
9.2.1.2.1 EMBOLIC COILS
9.2.1.2.2 ASPIRATION CATHETERS
9.2.1.2.3 STENT RETRIEVER
9.2.1.2.4 SURGICAL CLIPPING
9.2.1.2.5 OTHERS
9.2.1.3 OTHERS THERAPY
9.2.1.3.1 PHYSICAL THERAPY
9.2.1.3.2 OCCUPATIONAL THERAPY
9.2.1.3.3 SPEECH THERAPY
9.2.1.3.4 OTHERS
9.3 DIAGNOSIS
9.3.1 IMAGING TEST
9.3.1.1 COMPUTERIZED TOMOGRAPHY (CT) SCAN
9.3.1.2 MAGNETIC RESONANCE IMAGING (MRI)
9.3.1.3 CAROTID ULTRASOUND
9.3.1.4 CEREBRAL ANGIOGRAM
9.3.2 BLOOD TEST
9.3.3 ECHOCARDIOGRAM
9.3.4 LUMBAR PUNCTURE
9.3.5 OTHERS
10 NORTH AMERICA STROKE MARKET, BY DISTRIBUTION CHANNEL
10.1 OVERVIEW
10.2 DIRECT
10.3 RETAIL
10.4 ONLINE
11 NORTH AMERICA STROKE MARKET, BY END USER
11.1 OVERVIEW
11.2 HOSPITALS & CLINICS
11.3 SPECIALTY CLINICS
11.4 AMBULATORY SURGICAL CENTER
11.5 HOMECARE
11.6 LABORATORIES
11.7 OTHERS
12 NORTH AMERICA STROKE MARKET, BY REGION
12.1 NORTH AMERICA
12.1.1 U.S
12.1.2 CANADA
12.1.3 MEXICO
13 NORTH AMERICA STROKE MARKET, COMPANY LANDSCAPE
13.1 COMPANY SHARE ANALYSIS: NORTH AMERICA
14 SWOT ANALYSIS
15 COMPANY PROFILES
15.1 BRISTOL-MYERS SQUIBB COMPANY
15.1.1 COMPANY SNAPSHOT
15.1.2 REVENUE ANALYSIS
15.1.3 COMPANY SHARE ANALYSIS
15.1.4 PRODUCT PORTFOLIO
15.2 F. HOFFMANN-LA ROCHE LTD
15.2.1 COMPANY SNAPSHOT
15.2.2 REVENUE ANALYSIS
15.2.3 COMPANY SHARE ANALYSIS
15.2.4 PRODUCT PORTFOLIO
15.2.5 RECENT DEVELOPMENT
15.3 BOEHRINGER INGELHEIM INTERNATIONAL GMBH
15.3.1 COMPANY SNAPSHOT
15.3.2 COMPANY SHARE ANALYSIS
15.3.3 PRODUCT PORTFOLIO
15.3.4 RECENT DEVELOPMENT
15.4 DAIICHI SANKYO COMPANY, LIMITED
15.4.1 COMPANY SNAPSHOT
15.4.2 REVENUE ANALYSIS
15.4.3 COMPANY SHARE ANALYSIS
15.4.4 PRODUCT PORTFOLIO
15.4.5 RECENT DEVELOPMENT
15.5 SANOFI
15.5.1 COMPANY SNAPSHOT
15.5.2 REVENUE ANALYSIS
15.5.3 COMPANY SHARE ANALYSIS
15.5.4 PRODUCT PORTFOLIO
15.6 ABBOTT
15.6.1 COMPANY SNAPSHOT
15.6.2 REVENUE ANALYSIS
15.6.3 PRODUCT PORTFOLIO
15.6.4 RECENT DEVELOPMENT
15.7 AMNEAL PHARMACEUTICALS LLC
15.7.1 COMPANY SNAPSHOT
15.7.2 REVENUE ANALYSIS
15.7.3 PRODUCT PORTFOLIO
15.7.4 RECENT DEVELOPMENT
15.8 ASTRAZENECA
15.8.1 COMPANY SNAPSHOT
15.8.2 REVENUE ANALYSIS
15.8.3 PRODUCT PORTFOLIO
15.8.4 RECENT DEVELOPMENT
15.9 BAYER AG
15.9.1 COMPANY SNAPSHOT
15.9.2 REVENUE ANALYSIS
15.9.3 PRODUCT PORTFOLIO
15.9.4 RECENT DEVELOPMENT
15.1 FRESENIUS SE & CO. KGAA
15.10.1 COMPANY SNAPSHOT
15.10.2 REVENUE ANALYSIS
15.10.3 PRODUCT PORTFOLIO
15.10.4 RECENT DEVELOPMENT
15.11 GLENMARK PHARMACEUTICALS LTD.
15.11.1 COMPANY SNAPSHOT
15.11.2 REVENUE ANALYSIS
15.11.3 PRODUCT PORTFOLIO
15.11.4 RECENT DEVELOPMENT
15.12 JOHNSON & JOHNSON SERVICES, INC.
15.12.1 COMPANY SNAPSHOT
15.12.2 REVENUE ANALYSIS
15.12.3 PRODUCT PORTFOLIO
15.12.4 RECENT DEVELOPMENT
15.13 LUPIN
15.13.1 COMPANY SNAPSHOT
15.13.2 REVENUE ANALYSIS
15.13.3 PRODUCT PORTFOLIO
15.13.4 RECENT DEVELOPMENT
15.14 MEDTRONIC
15.14.1 COMPANY SNAPSHOT
15.14.2 REVENUE ANALYSIS
15.14.3 PRODUCT PORTFOLIO
15.14.4 RECENT DEVELOPMENT
15.15 PENUMBRA, INC.
15.15.1 COMPANY SNAPSHOT
15.15.2 REVENUE ANALYSIS
15.15.3 PRODUCT PORTFOLIO
15.15.4 RECENT DEVELOPMENT
15.16 PFIZER INC.
15.16.1 COMPANY SNAPSHOT
15.16.2 REVENUE ANALYSIS
15.16.3 PRODUCT PORTFOLIO
15.16.4 RECENT DEVELOPMENT
15.17 SANDOZ AG
15.17.1 COMPANY SNAPSHOT
15.17.2 REVENUE ANALYSIS
15.17.3 PRODUCT PORTFOLIO
15.17.4 RECENT DEVELOPMENT
15.18 TEVA PHARMACEUTICALS USA, INC.
15.18.1 COMPANY SNAPSHOT
15.18.2 REVENUE ANALYSIS
15.18.3 PRODUCT PORTFOLIO
15.18.4 RECENT DEVELOPMENT
15.19 VIATRIS INC.
15.19.1 COMPANY SNAPSHOT
15.19.2 REVENUE ANALYSIS
15.19.3 PRODUCT PORTFOLIO
15.19.4 RECENT DEVELOPMENT
16 QUESTIONNAIRE
17 RELATED REPORTS
List of Table
TABLE 1 NORTH AMERICA STROKE MARKET, BY TYPE, 2018-2032 (USD THOUSAND)
TABLE 2 NORTH AMERICA ISCHEMIC STROKE IN STROKE MARKET, BY REGION, 2018-2032 (USD THOUSAND)
TABLE 3 NORTH AMERICA ISCHEMIC STROKE IN STROKE MARKET, BY TYPE, 2018-2032 (USD THOUSAND)
TABLE 4 NORTH AMERICA HEMORRHAGIC STROKE IN STROKE MARKET, BY REGION, 2018-2032 (USD THOUSAND)
TABLE 5 NORTH AMERICA HEMORRHAGIC STROKE IN STROKE MARKET, BY TYPE, 2018-2032 (USD THOUSAND)
TABLE 6 NORTH AMERICA TRANSIENT ISCHEMIC ATTACT (TIA) IN STROKE MARKET, BY REGION, 2018-2032 (USD THOUSAND)
TABLE 7 NORTH AMERICA STROKE MARKET, BY GENDER, 2018-2032 (USD THOUSAND)
TABLE 8 NORTH AMERICA FEMALE IN STROKE MARKET, BY REGION, 2018-2032 (USD THOUSAND)
TABLE 9 NORTH AMERICA MALE IN STROKE MARKET, BY REGION, 2018-2032 (USD THOUSAND)
TABLE 10 NORTH AMERICA STROKE MARKET, BY DIAGNOSIS AND TREATMENT, 2018-2032 (USD THOUSAND)
TABLE 11 NORTH AMERICA TREATMENT IN STROKE MARKET, BY REGION, 2018-2032 (USD THOUSAND)
TABLE 12 NORTH AMERICA TREATMENT IN STROKE MARKET, BY TREATMENT TYPE, 2018-2032 (USD THOUSAND)
TABLE 13 NORTH AMERICA MEDICATION IN STROKE MARKET, BY CLASS, 2018-2032 (USD THOUSAND)
TABLE 14 NORTH AMERICA BLOOD PRESSURE MEDICINES IN STROKE MARKET, BY CLASS, 2018-2032 (USD THOUSAND)
TABLE 15 NORTH AMERICA ANGIOTENSIN-CONVERTING ENZYME (ACE) INHIBITORS IN STROKE MARKET, BY CLASS, 2018-2032 (USD THOUSAND)
TABLE 16 NORTH AMERICA THIAZIDE DIURETICS IN STROKE MARKET, BY CLASS, 2018-2032 (USD THOUSAND)
TABLE 17 NORTH AMERICA CALCIUM CHANNEL BLOCKERS IN STROKE MARKET, BY CLASS, 2018-2032 (USD THOUSAND)
TABLE 18 NORTH AMERICA BETA BLOCKERS IN STROKE MARKET, BY CLASS, 2018-2032 (USD THOUSAND)
TABLE 19 NORTH AMERICA ALPHA-BLOCKERS IN STROKE MARKET, BY CLASS, 2018-2032 (USD THOUSAND)
TABLE 20 NORTH AMERICA ANTIPLATELET DRUGS IN STROKE MARKET, BY CLASS, 2018-2032 (USD THOUSAND)
TABLE 21 NORTH AMERICA ANTICOAGULANTS IN STROKE MARKET, BY CLASS, 2018-2032 (USD THOUSAND)
TABLE 22 NORTH AMERICA TISSUE PLASMINOGEN ACTIVATOR (TPA) IN STROKE MARKET, BY CLASS, 2018-2032 (USD THOUSAND)
TABLE 23 NORTH AMERICA STATINS IN STROKE MARKET, BY CLASS, 2018-2032 (USD THOUSAND)
TABLE 24 NORTH AMERICA SUPPORTIVE MEDICATION IN STROKE MARKET, BY CLASS, 2018-2032 (USD THOUSAND)
TABLE 25 NORTH AMERICA MEDICATION IN STROKE MARKET, BY DRUG TYPE, 2018-2032 (USD THOUSAND)
TABLE 26 NORTH AMERICA BRANDED IN STROKE MARKET, BY DRUG TYPE, 2018-2032 (USD THOUSAND)
TABLE 27 NORTH AMERICA MEDICATION IN STROKE MARKET, BY ROUTE OF ADMINISTRATION, 2018-2032 (USD THOUSAND)
TABLE 28 NORTH AMERICA ORAL IN STROKE MARKET, BY TYPE, 2018-2032 (USD THOUSAND)
TABLE 29 NORTH AMERICA PARENTERAL IN STROKE MARKET, BY TYPE, 2018-2032 (USD THOUSAND)
TABLE 30 NORTH AMERICA MEDICATION IN STROKE MARKET, BY MODE OF PURCHASE, 2018-2032 (USD THOUSAND)
TABLE 31 NORTH AMERICA MEDICATION IN STROKE MARKET, BY THERAPY TYPE, 2018-2032 (USD THOUSAND)
TABLE 32 NORTH AMERICA SURGERY IN STROKE MARKET, BY INSTRUMENT TYPE, 2018-2032 (USD THOUSAND)
TABLE 33 NORTH AMERICA OTHER THERAPY IN STROKE MARKET, BY TYPE, 2018-2032 (USD THOUSAND)
TABLE 34 NORTH AMERICA DIAGNOSIS IN STROKE MARKET, BY REGION, 2018-2032 (USD THOUSAND)
TABLE 35 NORTH AMERICA DIAGNOSIS IN STROKE MARKET, BY DIAGNOSIS TYPE, 2018-2032 (USD THOUSAND)
TABLE 36 NORTH AMERICA IMAGING TEST IN STROKE MARKET, BY TYPE, 2018-2032 (USD THOUSAND)
TABLE 37 NORTH AMERICA STROKE MARKET, BY DISTRIBUTION CHANNEL, 2018-2032 (USD THOUSAND)
TABLE 38 NORTH AMERICA DIRECT IN STROKE MARKET, BY REGION, 2018-2032 (USD THOUSAND)
TABLE 39 NORTH AMERICA RETAIL IN STROKE MARKET, BY REGION, 2018-2032 (USD THOUSAND)
TABLE 40 NORTH AMERICA ONLINE IN STROKE MARKET, BY REGION, 2018-2032 (USD THOUSAND)
TABLE 41 NORTH AMERICA STROKE MARKET, BY END USER, 2018-2032 (USD THOUSAND)
TABLE 42 NORTH AMERICA HOSPITALS & CLINICS IN STROKE MARKET, BY REGION, 2018-2032 (USD THOUSAND)
TABLE 43 NORTH AMERICA SPECIALTY CLINICS IN STROKE MARKET, BY REGION, 2018-2032 (USD THOUSAND)
TABLE 44 NORTH AMERICA AMBULATORY SURGICAL CENTER IN STROKE MARKET, BY REGION, 2018-2032 (USD THOUSAND)
TABLE 45 NORTH AMERICA HOMECARE IN STROKE MARKET, BY REGION, 2018-2032 (USD THOUSAND)
TABLE 46 NORTH AMERICA LABORATORIES IN STROKE MARKET, BY REGION, 2018-2032 (USD THOUSAND)
TABLE 47 NORTH AMERICA OTHERS IN STROKE MARKET, BY REGION, 2018-2032 (USD THOUSAND)
TABLE 48 NORTH AMERICA STROKE MARKET, BY COUNTRY, 2018-2032 (USD THOUSAND)
TABLE 49 NORTH-AMERICA STROKE MARKET, BY TYPE, 2018-2032 (USD THOUSAND)
TABLE 50 NORTH-AMERICA ISCHEMIC STROKE IN STROKE MARKET, BY TYPE, 2018-2032 (USD THOUSAND)
TABLE 51 NORTH-AMERICA HEMORRHAGIC STROKE IN STROKE MARKET, BY TYPE, 2018-2032 (USD THOUSAND)
TABLE 52 NORTH-AMERICA STROKE MARKET, BY DIAGNOSIS AND TREATMENT, 2018-2032 (USD THOUSAND)
TABLE 53 NORTH-AMERICA TREATMENT IN STROKE MARKET, BY TREATMENT TYPE, 2018-2032 (USD THOUSAND)
TABLE 54 NORTH-AMERICA MEDICATION IN STROKE MARKET, BY CLASS, 2018-2032 (USD THOUSAND)
TABLE 55 NORTH-AMERICA BLOOD PRESSURE MEDICINE IN STROKE MARKET, BY CLASS, 2018-2032 (USD THOUSAND)
TABLE 56 NORTH-AMERICA ANGIOTENSIN-CONVERTING ENZYME (ACE) INHIBITORS IN STROKE MARKET, BY CLASS, 2018-2032 (USD THOUSAND)
TABLE 57 NORTH-AMERICA THIAZIDE DIURETICS IN STROKE MARKET, BY CLASS, 2018-2032 (USD THOUSAND)
TABLE 58 NORTH-AMERICA CALCIUM CHANNEL BLOCKERS IN STROKE MARKET, BY CLASS, 2018-2032 (USD THOUSAND)
TABLE 59 NORTH-AMERICA BETA BLOCKERS IN STROKE MARKET, BY CLASS, 2018-2032 (USD THOUSAND)
TABLE 60 NORTH-AMERICA ALPHA-BLOCKERS IN STROKE MARKET, BY CLASS, 2018-2032 (USD THOUSAND)
TABLE 61 NORTH-AMERICA ANTIPLATELET DRUGS IN STROKE MARKET, BY CLASS, 2018-2032 (USD THOUSAND)
TABLE 62 NORTH-AMERICA ANTICOAGULANTS IN STROKE MARKET, BY CLASS, 2018-2032 (USD THOUSAND)
TABLE 63 NORTH-AMERICA TISSUE PLASMINOGEN ACTIVATOR (TPA) IN STROKE MARKET, BY CLASS, 2018-2032 (USD THOUSAND)
TABLE 64 NORTH-AMERICA STATINS IN STROKE MARKET, BY CLASS, 2018-2032 (USD THOUSAND)
TABLE 65 NORTH-AMERICA SUPPORTIVE MEDICATION IN STROKE MARKET, BY CLASS, 2018-2032 (USD THOUSAND)
TABLE 66 NORTH-AMERICA MEDICATION IN STROKE MARKET, BY DRUG TYPE, 2018-2032 (USD THOUSAND)
TABLE 67 NORTH-AMERICA BRANDED IN STROKE MARKET, BY DRUG TYPE, 2018-2032 (USD THOUSAND)
TABLE 68 NORTH-AMERICA MEDICATION IN STROKE MARKET, BY ROUTE OF ADMINISTRATION, 2018-2032 (USD THOUSAND)
TABLE 69 NORTH-AMERICA ORAL IN STROKE MARKET, BY TYPE, 2018-2032 (USD THOUSAND)
TABLE 70 NORTH-AMERICA PARENTERAL IN STROKE MARKET, BY TYPE, 2018-2032 (USD THOUSAND)
TABLE 71 NORTH-AMERICA MEDICATION IN STROKE MARKET, BY MODE OF PURCHASE, 2018-2032 (USD THOUSAND)
TABLE 72 NORTH-AMERICA MEDICATION IN STROKE MARKET, BY THERAPY TYPE, 2018-2032 (USD THOUSAND)
TABLE 73 NORTH-AMERICA SURGERY IN STROKE MARKET, BY INSTRUMENT TYPE, 2018-2032 (USD THOUSAND)
TABLE 74 NORTH-AMERICA OTHER THERAPY IN STROKE MARKET, BY TYPE, 2018-2032 (USD THOUSAND)
TABLE 75 NORTH-AMERICA DIAGNOSIS IN STROKE MARKET, BY DIAGNOSIS TYPE, 2018-2032 (USD THOUSAND)
TABLE 76 NORTH-AMERICA IMAGING TEST IN STROKE MARKET, BY TYPE, 2018-2032 (USD THOUSAND)
TABLE 77 NORTH-AMERICA STROKE MARKET, BY GENDER, 2018-2032 (USD THOUSAND)
TABLE 78 NORTH-AMERICA STROKE MARKET, BY END USER, 2018-2032 (USD THOUSAND)
TABLE 79 NORTH-AMERICA STROKE MARKET, BY DISTRIBUTION CHANNEL, 2018-2032 (USD THOUSAND)
TABLE 80 U.S. STROKE MARKET, BY TYPE, 2018-2032 (USD THOUSAND)
TABLE 81 U.S. ISCHEMIC STROKE IN STROKE MARKET, BY TYPE, 2018-2032 (USD THOUSAND)
TABLE 82 U.S. HEMORRHAGIC STROKE IN STROKE MARKET, BY TYPE, 2018-2032 (USD THOUSAND)
TABLE 83 U.S. STROKE MARKET, BY DIAGNOSIS AND TREATMENT, 2018-2032 (USD THOUSAND)
TABLE 84 U.S. TREATMENT IN STROKE MARKET, BY TREATMENT TYPE, 2018-2032 (USD THOUSAND)
TABLE 85 U.S. MEDICATION IN STROKE MARKET, BY CLASS, 2018-2032 (USD THOUSAND)
TABLE 86 U.S. BLOOD PRESSURE MEDICINE IN STROKE MARKET, BY CLASS, 2018-2032 (USD THOUSAND)
TABLE 87 U.S. ANGIOTENSIN-CONVERTING ENZYME (ACE) INHIBITORS IN STROKE MARKET, BY CLASS, 2018-2032 (USD THOUSAND)
TABLE 88 U.S. THIAZIDE DIURETICS IN STROKE MARKET, BY CLASS, 2018-2032 (USD THOUSAND)
TABLE 89 U.S. CALCIUM CHANNEL BLOCKERS IN STROKE MARKET, BY CLASS, 2018-2032 (USD THOUSAND)
TABLE 90 U.S. BETA BLOCKERS IN STROKE MARKET, BY CLASS, 2018-2032 (USD THOUSAND)
TABLE 91 U.S. ALPHA-BLOCKERS IN STROKE MARKET, BY CLASS, 2018-2032 (USD THOUSAND)
TABLE 92 U.S. ANTIPLATELET DRUGS IN STROKE MARKET, BY CLASS, 2018-2032 (USD THOUSAND)
TABLE 93 U.S. ANTICOAGULANTS IN STROKE MARKET, BY CLASS, 2018-2032 (USD THOUSAND)
TABLE 94 U.S. TISSUE PLASMINOGEN ACTIVATOR (TPA) IN STROKE MARKET, BY CLASS, 2018-2032 (USD THOUSAND)
TABLE 95 U.S. STATINS IN STROKE MARKET, BY CLASS, 2018-2032 (USD THOUSAND)
TABLE 96 U.S. SUPPORTIVE MEDICATION IN STROKE MARKET, BY CLASS, 2018-2032 (USD THOUSAND)
TABLE 97 U.S. MEDICATION IN STROKE MARKET, BY DRUG TYPE, 2018-2032 (USD THOUSAND)
TABLE 98 U.S. BRANDED IN STROKE MARKET, BY DRUG TYPE, 2018-2032 (USD THOUSAND)
TABLE 99 U.S. MEDICATION IN STROKE MARKET, BY ROUTE OF ADMINISTRATION, 2018-2032 (USD THOUSAND)
TABLE 100 U.S. ORAL IN STROKE MARKET, BY TYPE, 2018-2032 (USD THOUSAND)
TABLE 101 U.S. PARENTERAL IN STROKE MARKET, BY TYPE, 2018-2032 (USD THOUSAND)
TABLE 102 U.S. MEDICATION IN STROKE MARKET, BY MODE OF PURCHASE, 2018-2032 (USD THOUSAND)
TABLE 103 U.S. MEDICATION IN STROKE MARKET, BY THERAPY TYPE, 2018-2032 (USD THOUSAND)
TABLE 104 U.S. SURGERY IN STROKE MARKET, BY INSTRUMENT TYPE, 2018-2032 (USD THOUSAND)
TABLE 105 U.S. OTHER THERAPY IN STROKE MARKET, BY TYPE, 2018-2032 (USD THOUSAND)
TABLE 106 U.S. DIAGNOSIS IN STROKE MARKET, BY DIAGNOSIS TYPE, 2018-2032 (USD THOUSAND)
TABLE 107 U.S. IMAGING TEST IN STROKE MARKET, BY TYPE, 2018-2032 (USD THOUSAND)
TABLE 108 U.S. STROKE MARKET, BY GENDER, 2018-2032 (USD THOUSAND)
TABLE 109 U.S. STROKE MARKET, BY END USER, 2018-2032 (USD THOUSAND)
TABLE 110 U.S. STROKE MARKET, BY DISTRIBUTION CHANNEL, 2018-2032 (USD THOUSAND)
TABLE 111 CANADA STROKE MARKET, BY TYPE, 2018-2032 (USD THOUSAND)
TABLE 112 CANADA ISCHEMIC STROKE IN STROKE MARKET, BY TYPE, 2018-2032 (USD THOUSAND)
TABLE 113 CANADA HEMORRHAGIC STROKE IN STROKE MARKET, BY TYPE, 2018-2032 (USD THOUSAND)
TABLE 114 CANADA STROKE MARKET, BY DIAGNOSIS AND TREATMENT, 2018-2032 (USD THOUSAND)
TABLE 115 CANADA TREATMENT IN STROKE MARKET, BY TREATMENT TYPE, 2018-2032 (USD THOUSAND)
TABLE 116 CANADA MEDICATION IN STROKE MARKET, BY CLASS, 2018-2032 (USD THOUSAND)
TABLE 117 CANADA BLOOD PRESSURE MEDICINE IN STROKE MARKET, BY CLASS, 2018-2032 (USD THOUSAND)
TABLE 118 CANADA ANGIOTENSIN-CONVERTING ENZYME (ACE) INHIBITORS IN STROKE MARKET, BY CLASS, 2018-2032 (USD THOUSAND)
TABLE 119 CANADA THIAZIDE DIURETICS IN STROKE MARKET, BY CLASS, 2018-2032 (USD THOUSAND)
TABLE 120 CANADA CALCIUM CHANNEL BLOCKERS IN STROKE MARKET, BY CLASS, 2018-2032 (USD THOUSAND)
TABLE 121 CANADA BETA BLOCKERS IN STROKE MARKET, BY CLASS, 2018-2032 (USD THOUSAND)
TABLE 122 CANADA ALPHA-BLOCKERS IN STROKE MARKET, BY CLASS, 2018-2032 (USD THOUSAND)
TABLE 123 CANADA ANTIPLATELET DRUGS IN STROKE MARKET, BY CLASS, 2018-2032 (USD THOUSAND)
TABLE 124 CANADA ANTICOAGULANTS IN STROKE MARKET, BY CLASS, 2018-2032 (USD THOUSAND)
TABLE 125 CANADA TISSUE PLASMINOGEN ACTIVATOR (TPA) IN STROKE MARKET, BY CLASS, 2018-2032 (USD THOUSAND)
TABLE 126 CANADA STATINS IN STROKE MARKET, BY CLASS, 2018-2032 (USD THOUSAND)
TABLE 127 CANADA SUPPORTIVE MEDICATION IN STROKE MARKET, BY CLASS, 2018-2032 (USD THOUSAND)
TABLE 128 CANADA MEDICATION IN STROKE MARKET, BY DRUG TYPE, 2018-2032 (USD THOUSAND)
TABLE 129 CANADA BRANDED IN STROKE MARKET, BY DRUG TYPE, 2018-2032 (USD THOUSAND)
TABLE 130 CANADA MEDICATION IN STROKE MARKET, BY ROUTE OF ADMINISTRATION, 2018-2032 (USD THOUSAND)
TABLE 131 CANADA ORAL IN STROKE MARKET, BY TYPE, 2018-2032 (USD THOUSAND)
TABLE 132 CANADA PARENTERAL IN STROKE MARKET, BY TYPE, 2018-2032 (USD THOUSAND)
TABLE 133 CANADA MEDICATION IN STROKE MARKET, BY MODE OF PURCHASE, 2018-2032 (USD THOUSAND)
TABLE 134 CANADA MEDICATION IN STROKE MARKET, BY THERAPY TYPE, 2018-2032 (USD THOUSAND)
TABLE 135 CANADA SURGERY IN STROKE MARKET, BY INSTRUMENT TYPE, 2018-2032 (USD THOUSAND)
TABLE 136 CANADA OTHER THERAPY IN STROKE MARKET, BY TYPE, 2018-2032 (USD THOUSAND)
TABLE 137 CANADA DIAGNOSIS IN STROKE MARKET, BY DIAGNOSIS TYPE, 2018-2032 (USD THOUSAND)
TABLE 138 CANADA IMAGING TEST IN STROKE MARKET, BY TYPE, 2018-2032 (USD THOUSAND)
TABLE 139 CANADA STROKE MARKET, BY GENDER, 2018-2032 (USD THOUSAND)
TABLE 140 CANADA STROKE MARKET, BY END USER, 2018-2032 (USD THOUSAND)
TABLE 141 CANADA STROKE MARKET, BY DISTRIBUTION CHANNEL, 2018-2032 (USD THOUSAND)
TABLE 142 MEXICO STROKE MARKET, BY TYPE, 2018-2032 (USD THOUSAND)
TABLE 143 MEXICO ISCHEMIC STROKE IN STROKE MARKET, BY TYPE, 2018-2032 (USD THOUSAND)
TABLE 144 MEXICO HEMORRHAGIC STROKE IN STROKE MARKET, BY TYPE, 2018-2032 (USD THOUSAND)
TABLE 145 MEXICO STROKE MARKET, BY DIAGNOSIS AND TREATMENT, 2018-2032 (USD THOUSAND)
TABLE 146 MEXICO TREATMENT IN STROKE MARKET, BY TREATMENT TYPE, 2018-2032 (USD THOUSAND)
TABLE 147 MEXICO MEDICATION IN STROKE MARKET, BY CLASS, 2018-2032 (USD THOUSAND)
TABLE 148 MEXICO BLOOD PRESSURE MEDICINE IN STROKE MARKET, BY CLASS, 2018-2032 (USD THOUSAND)
TABLE 149 MEXICO ANGIOTENSIN-CONVERTING ENZYME (ACE) INHIBITORS IN STROKE MARKET, BY CLASS, 2018-2032 (USD THOUSAND)
TABLE 150 MEXICO THIAZIDE DIURETICS IN STROKE MARKET, BY CLASS, 2018-2032 (USD THOUSAND)
TABLE 151 MEXICO CALCIUM CHANNEL BLOCKERS IN STROKE MARKET, BY CLASS, 2018-2032 (USD THOUSAND)
TABLE 152 MEXICO BETA BLOCKERS IN STROKE MARKET, BY CLASS, 2018-2032 (USD THOUSAND)
TABLE 153 MEXICO ALPHA-BLOCKERS IN STROKE MARKET, BY CLASS, 2018-2032 (USD THOUSAND)
TABLE 154 MEXICO ANTIPLATELET DRUGS IN STROKE MARKET, BY CLASS, 2018-2032 (USD THOUSAND)
TABLE 155 MEXICO ANTICOAGULANTS IN STROKE MARKET, BY CLASS, 2018-2032 (USD THOUSAND)
TABLE 156 MEXICO TISSUE PLASMINOGEN ACTIVATOR (TPA) IN STROKE MARKET, BY CLASS, 2018-2032 (USD THOUSAND)
TABLE 157 MEXICO STATINS IN STROKE MARKET, BY CLASS, 2018-2032 (USD THOUSAND)
TABLE 158 MEXICO SUPPORTIVE MEDICATION IN STROKE MARKET, BY CLASS, 2018-2032 (USD THOUSAND)
TABLE 159 MEXICO MEDICATION IN STROKE MARKET, BY DRUG TYPE, 2018-2032 (USD THOUSAND)
TABLE 160 MEXICO BRANDED IN STROKE MARKET, BY DRUG TYPE, 2018-2032 (USD THOUSAND)
TABLE 161 MEXICO MEDICATION IN STROKE MARKET, BY ROUTE OF ADMINISTRATION, 2018-2032 (USD THOUSAND)
TABLE 162 MEXICO ORAL IN STROKE MARKET, BY TYPE, 2018-2032 (USD THOUSAND)
TABLE 163 MEXICO PARENTERAL IN STROKE MARKET, BY TYPE, 2018-2032 (USD THOUSAND)
TABLE 164 MEXICO MEDICATION IN STROKE MARKET, BY MODE OF PURCHASE, 2018-2032 (USD THOUSAND)
TABLE 165 MEXICO MEDICATION IN STROKE MARKET, BY THERAPY TYPE, 2018-2032 (USD THOUSAND)
TABLE 166 MEXICO SURGERY IN STROKE MARKET, BY INSTRUMENT TYPE, 2018-2032 (USD THOUSAND)
TABLE 167 MEXICO OTHER THERAPY IN STROKE MARKET, BY TYPE, 2018-2032 (USD THOUSAND)
TABLE 168 MEXICO DIAGNOSIS IN STROKE MARKET, BY DIAGNOSIS TYPE, 2018-2032 (USD THOUSAND)
TABLE 169 MEXICO IMAGING TEST IN STROKE MARKET, BY TYPE, 2018-2032 (USD THOUSAND)
TABLE 170 MEXICO STROKE MARKET, BY GENDER, 2018-2032 (USD THOUSAND)
TABLE 171 MEXICO STROKE MARKET, BY END USER, 2018-2032 (USD THOUSAND)
TABLE 172 MEXICO STROKE MARKET, BY DISTRIBUTION CHANNEL, 2018-2032 (USD THOUSAND)
List of Figure
FIGURE 1 NORTH AMERICA STROKE MARKET: SEGMENTATION
FIGURE 2 NORTH AMERICA STROKE MARKET: DATA TRIANGULATION
FIGURE 3 NORTH AMERICA STROKE MARKET: DROC ANALYSIS
FIGURE 4 NORTH AMERICA STROKE MARKET: NORTH AMERICA VS REGIONAL MARKET ANALYSIS
FIGURE 5 NORTH AMERICA STROKE MARKET: COMPANY RESEARCH ANALYSIS
FIGURE 6 NORTH AMERICA STROKE MARKET: INTERVIEW DEMOGRAPHICS
FIGURE 7 NORTH AMERICA STROKE MARKET: DBMR MARKET POSITION GRID
FIGURE 8 NORTH AMERICA STROKE MARKET: MARKET END USER COVERAGE GRID
FIGURE 9 NORTH AMERICA STROKE MARKET: VENDOR SHARE ANALYSIS
FIGURE 10 NORTH AMERICA STROKE MARKET: SEGMENTATION
FIGURE 11 RISING INCIDENCES OF STROKE DRIVE DEMAND FOR TREATMENTS IS EXPECTED TO DRIVE THE NORTH AMERICA STROKE MARKET GROWTH IN THE FORECAST PERIOD OF 2025 TO 2032
FIGURE 12 ISCHEMIC STROKE SEGMENT IS EXPECTED TO ACCOUNT FOR THE LARGEST SHARE OF THE NORTH AMERICA STROKE MARKET IN THE FORECAST PERIOD OF 2025 & 2032
FIGURE 13 NORTH AMERICA STROKE MARKET EXECUTIVE SUMMARY
FIGURE 14 STRATEGIC DECISIONS
FIGURE 15 DRIVERS, RESTRAINTS, OPPORTUNITIES, AND CHALLENGES OF THE NORTH AMERICA STROKE MARKET
FIGURE 16 NORTH AMERICA STROKE MARKET: BY TYPE, 2024
FIGURE 17 NORTH AMERICA STROKE MARKET: BY TYPE, 2025-2032 (USD THOUSAND)
FIGURE 18 NORTH AMERICA STROKE MARKET: BY TYPE, CAGR (2025-2032)
FIGURE 19 NORTH AMERICA STROKE MARKET: BY TYPE, LIFELINE CURVE
FIGURE 20 NORTH AMERICA STROKE MARKET: BY GENDER, 2024
FIGURE 21 NORTH AMERICA STROKE MARKET: BY GENDER, 2025 TO 2032 (USD THOUSAND)
FIGURE 22 NORTH AMERICA STROKE MARKET: BY GENDER, CAGR (2025- 2032)
FIGURE 23 NORTH AMERICA STROKE MARKET: BY GENDER, LIFELINE CURVE
FIGURE 24 NORTH AMERICA STROKE MARKET: BY DIAGNOSIS AND TREATMENT, 2024
FIGURE 25 NORTH AMERICA STROKE MARKET: BY DIAGNOSIS AND TREATMENT, 2025-2032 (USD THOUSAND)
FIGURE 26 NORTH AMERICA STROKE MARKET: BY DIAGNOSIS AND TREATMENT, CAGR (2025-2032)
FIGURE 27 NORTH AMERICA STROKE MARKET: BY DIAGNOSIS AND TREATMENT, LIFELINE CURVE
FIGURE 28 NORTH AMERICA STROKE MARKET: BY DISTRIBUTION CHANNEL, 2024
FIGURE 29 NORTH AMERICA STROKE MARKET: BY DISTRIBUTION CHANNEL, 2018-2032 (USD THOUSAND)
FIGURE 30 NORTH AMERICA STROKE MARKET: BY DISTRIBUTION CHANNEL, CAGR (2025-2032)
FIGURE 31 NORTH AMERICA STROKE MARKET: BY DISTRIBUTION CHANNEL, LIFELINE CURVE
FIGURE 32 NORTH AMERICA STROKE MARKET: BY END USER, 2024
FIGURE 33 NORTH AMERICA STROKE MARKET: BY END USER, 2025-2032 (USD THOUSAND)
FIGURE 34 NORTH AMERICA STROKE MARKET: BY END USER, CAGR (2025-2032)
FIGURE 35 NORTH AMERICA STROKE MARKET: BY END USER, LIFELINE CURVE
FIGURE 36 NORTH AMERICA STROKE MARKET: SNAPSHOT (2024)
FIGURE 37 NORTH AMERICA STROKE MARKET: COMPANY SHARE 2024 (%)
Data collection and base year analysis are done using data collection modules with large sample sizes. The stage includes obtaining market information or related data through various sources and strategies. It includes examining and planning all the data acquired from the past in advance. It likewise envelops the examination of information inconsistencies seen across different information sources. The market data is analysed and estimated using market statistical and coherent models. Also, market share analysis and key trend analysis are the major success factors in the market report. To know more, please request an analyst call or drop down your inquiry.
The key research methodology used by DBMR research team is data triangulation which involves data mining, analysis of the impact of data variables on the market and primary (industry expert) validation. Data models include Vendor Positioning Grid, Market Time Line Analysis, Market Overview and Guide, Company Positioning Grid, Patent Analysis, Pricing Analysis, Company Market Share Analysis, Standards of Measurement, Global versus Regional and Vendor Share Analysis. To know more about the research methodology, drop in an inquiry to speak to our industry experts.
Data Bridge Market Research is a leader in advanced formative research. We take pride in servicing our existing and new customers with data and analysis that match and suits their goal. The report can be customized to include price trend analysis of target brands understanding the market for additional countries (ask for the list of countries), clinical trial results data, literature review, refurbished market and product base analysis. Market analysis of target competitors can be analyzed from technology-based analysis to market portfolio strategies. We can add as many competitors that you require data about in the format and data style you are looking for. Our team of analysts can also provide you data in crude raw excel files pivot tables (Fact book) or can assist you in creating presentations from the data sets available in the report.


