
North America Surgical Visualization Products Market
Market Size in USD Billion
 USD
1.60 Billion
USD
4.61 Billion
2024
2032
USD
1.60 Billion
USD
4.61 Billion
2024
2032
| 2025 - 2032 | |
| USD 1.60 Billion | |
| USD 4.61 Billion | |
| % | |
|
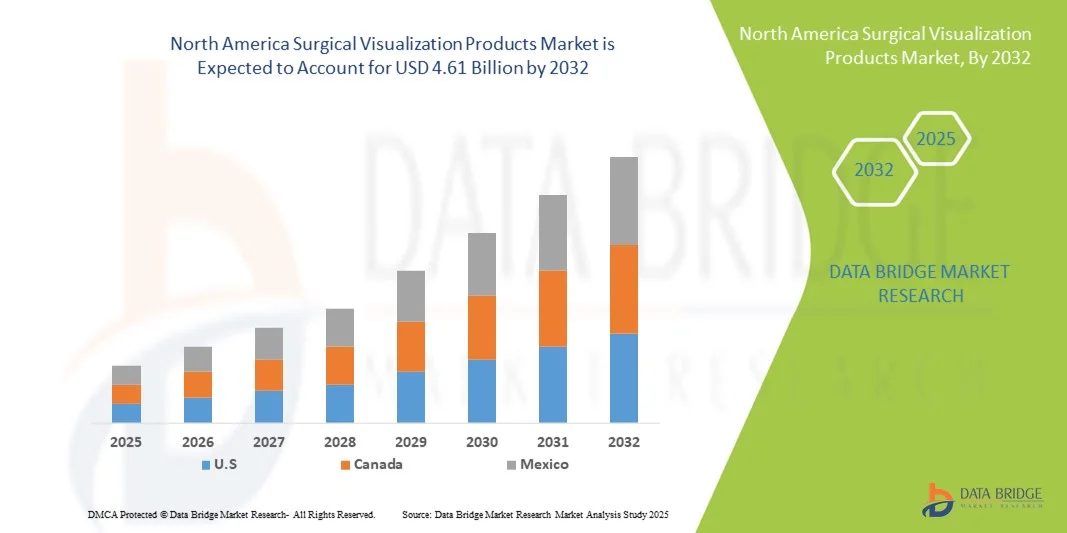
North America Surgical Visualization Products Market Size
- The North America surgical visualization products market size was valued at USD 1.60 billion in 2024 and is expected to reach USD 4.61 billion by 2032, at a CAGR of 14.1% during the forecast period
- The market growth is largely fueled by the increasing adoption of advanced imaging systems and minimally invasive surgical techniques, leading to higher demand for precise and efficient visualization tools in operating rooms across hospitals and ambulatory surgical centers
- Furthermore, rising prevalence of chronic diseases and an aging population, along with technological advancements in surgical visualization products, is establishing these solutions as essential tools in modern surgical practices. These converging factors are accelerating the uptake of surgical visualization products, thereby significantly boosting the industry's growth
North America Surgical Visualization Products Market Analysis
- Surgical visualization products, including advanced imaging systems, endoscopes, and 3D visualization tools, are increasingly vital components of modern operating rooms in both hospitals and ambulatory surgical centers due to their ability to enhance precision, improve surgical outcomes, and integrate with minimally invasive surgical procedures
- The escalating demand for surgical visualization products is primarily fueled by the rising adoption of minimally invasive surgeries, increasing prevalence of chronic diseases, and the need for higher efficiency and accuracy in complex surgical procedures
- The United States dominated the surgical visualization products market with the largest revenue share of 38.5% in 2024, characterized by advanced healthcare infrastructure, high adoption of cutting-edge surgical technologies, and a strong presence of key industry players
- China is expected to be the fastest-growing country in the surgical visualization products market during the forecast period due to increasing healthcare investments, expanding hospital networks, and rising awareness of advanced surgical technologies
- Laparoscopy segment dominated the surgical visualization products market with a market share of 43.2% in 2024, driven by its widespread adoption in minimally invasive procedures, high demand across multiple surgical specialties, and continuous technological advancements improving visualization and procedural efficiency
Report Scope and North America Surgical Visualization Products Market Segmentation
|
Attributes |
North America Surgical Visualization Products Key Market Insights |
|
Segments Covered |
|
|
Countries Covered |
North America
|
|
Key Market Players |
|
|
Market Opportunities |
|
|
Value Added Data Infosets |
In addition to the insights on market scenarios such as market value, growth rate, segmentation, geographical coverage, and major players, the market reports curated by the Data Bridge Market Research also include in-depth expert analysis, patient epidemiology, pipeline analysis, pricing analysis, and regulatory framework |
North America Surgical Visualization Products Market Trends
Advancements in 3D Imaging and AI-Assisted Surgery
- A significant and accelerating trend in the North America surgical visualization market is the integration of advanced 3D imaging and AI-assisted technologies, enhancing precision, surgical planning, and intraoperative decision-making across multiple specialties
- For instance, the ZEISS KINEVO 900 surgical microscope incorporates 3D visualization with AI-powered image processing, enabling surgeons to navigate complex procedures with improved clarity and accuracy
- AI integration in surgical visualization enables predictive analytics for tissue recognition, enhanced real-time guidance, and automated annotation of anatomical structures. For instance, the Brainlab Curve platform uses AI to optimize surgical trajectories and provide alerts for critical anatomical landmarks
- The seamless integration of surgical visualization systems with robotic-assisted surgery and digital operating room platforms facilitates centralized control over imaging, patient monitoring, and instrument guidance, enhancing procedural efficiency and safety
- This trend toward more intelligent, intuitive, and interconnected surgical visualization solutions is fundamentally reshaping operating room workflows. Consequently, companies such as Stryker are developing AI-enabled visualization systems with features such as automated image enhancement and integration with robotic instruments
- The adoption of surgical visualization systems offering 3D imaging and AI-assisted capabilities is growing rapidly across hospitals and specialized surgical centers, as healthcare providers increasingly prioritize precision, safety, and procedural efficiency
North America Surgical Visualization Products Market Dynamics
Driver
Rising Adoption of Minimally Invasive Surgeries and Technological Advancements
- The increasing prevalence of minimally invasive surgeries and the adoption of advanced surgical technologies are significant drivers of demand for surgical visualization products in North America
- For instance, in March 2024, Intuitive Surgical expanded its da Vinci Xi robotic surgery system with enhanced visualization modules for complex laparoscopic procedures, improving surgeon accuracy and patient outcomes
- As hospitals seek to improve surgical efficiency and reduce postoperative complications, advanced visualization tools such as high-definition endoscopes and 3D imaging systems provide compelling advantages over conventional approaches
- Furthermore, the expansion of specialized surgical centers and the rising volume of complex procedures are driving the adoption of integrated visualization systems, allowing better procedural planning and intraoperative guidance
- The combination of higher procedural accuracy, shorter operation times, and improved patient safety is propelling the demand for surgical visualization products, particularly in minimally invasive and robotic-assisted surgeries
Restraint/Challenge
High Costs and Regulatory Compliance Complexity
- The relatively high cost of advanced surgical visualization systems and the complexity of regulatory compliance pose significant challenges to market growth, especially for smaller hospitals or clinics with limited budgets
- For instance, purchasing and maintaining the ZEISS KINEVO 900 or Stryker 1688 AIM 4K system involves substantial capital expenditure and adherence to stringent FDA and ISO regulatory requirements
- Navigating these regulatory frameworks, including premarket approvals, safety certifications, and ongoing audits, can slow product adoption and increase operational burdens for healthcare providers
- In addition, continuous training requirements for surgical staff to operate advanced systems effectively add to the perceived cost and implementation challenges
- Overcoming these challenges through financing solutions, regulatory support, and modular or scalable system offerings will be vital for sustained growth in the North America surgical visualization products market
North America Surgical Visualization Products Market Scope
The market is segmented on the basis of product type, application, end user, and distribution channel.
- By Product Type
On the basis of product type, the North America surgical visualization products market is segmented into endoscopic cameras, accessories, light sources, displays and monitors, video recorders & processors, camera heads, and video converters. The endoscopic camera segment dominated the market with the largest revenue share in 2024, driven by its critical role in minimally invasive surgeries and laparoscopic procedures. Hospitals and specialty surgical centers prioritize high-definition endoscopic cameras for enhanced image clarity, accurate diagnosis, and improved surgical outcomes. The growing prevalence of chronic and complex conditions requiring precise interventions further supports the dominance of endoscopic cameras. Continuous technological innovations, including 4K imaging, AI-assisted visualization, and integration with robotic systems, make these cameras indispensable in modern operating rooms. High compatibility with multiple surgical procedures, including laparoscopy, arthroscopy, and urology endoscopy, adds to their widespread adoption. Moreover, the availability of modular camera systems enables hospitals to upgrade without replacing entire setups, ensuring cost-effectiveness and flexibility.
The accessories segment is anticipated to witness the fastest growth from 2025 to 2032, fueled by the rising need for compatible instruments and supplementary components such as insufflators, trocars, and specialized adapters. Accessories enhance the performance of core visualization devices and allow surgeons to customize systems for specific procedures. The increasing adoption of minimally invasive and robotic-assisted surgeries creates continuous demand for innovative and procedure-specific accessories. Furthermore, hospitals and ambulatory surgical centers prefer investing in modular accessory kits that expand the functionality of existing cameras and light sources. Manufacturers focusing on ergonomically designed, durable, and reusable accessories are further driving growth. The growth of the accessories segment is also supported by the trend of bundled offerings with visualization systems, enabling seamless integration and improved operational efficiency.
- By Application
On the basis of application, the market is segmented into arthroscopy, laparoscopy, ENT endoscopy, obstetrics/gynecology endoscopy, urology endoscopy, gastroscopy, and others. The laparoscopy segment dominated the market in 2024 with a market share of 43.2%, attributed to the increasing volume of minimally invasive abdominal surgeries. Surgeons prefer laparoscopic procedures due to reduced patient recovery times, smaller incisions, and lower complication risks, all of which depend on advanced visualization solutions. High-definition cameras, coupled with 3D imaging, are critical for precise tissue manipulation and enhanced intraoperative visibility in laparoscopic procedures. The growing prevalence of gastrointestinal disorders, gynecological surgeries, and bariatric procedures further supports market dominance. In addition, government and private healthcare initiatives promoting minimally invasive techniques are driving laparoscopic visualization adoption. Continuous training programs for surgeons in laparoscopic techniques also boost demand for specialized visualization systems in this segment.
The ENT endoscopy segment is expected to witness the fastest growth during the forecast period, driven by rising ENT disorders, increasing geriatric population, and expanding outpatient ENT procedures. Advanced endoscopes enable precise visualization of complex ear, nose, and throat structures, reducing surgical risks and improving patient outcomes. Integration with AI and enhanced imaging software provides ENT surgeons with better diagnostic and procedural accuracy. Growing investments in ENT-focused healthcare infrastructure and rising awareness about minimally invasive ENT interventions contribute to the accelerated adoption of these systems. The availability of portable and ergonomic ENT endoscopic devices is further boosting demand across hospitals, specialty clinics, and diagnostic centers.
- By End User
On the basis of end user, the market is segmented into hospitals, specialty clinics, diagnostic imaging centers, ambulatory surgical centers, and others. The hospital segment dominated the market with the highest revenue share in 2024 due to large-scale surgical volumes, advanced infrastructure, and significant investments in modern operating room technologies. Hospitals require integrated visualization systems to manage complex procedures, maintain high surgical precision, and ensure patient safety. High adoption is also supported by multi-specialty surgical requirements, centralized procurement practices, and the need for compatibility across different surgical departments. Hospitals also lead in deploying 3D imaging, robotic-assisted surgery, and AI-based visualization tools, further cementing market dominance.
The ambulatory surgical centers (ASCs) segment is anticipated to witness the fastest growth from 2025 to 2032, driven by increasing outpatient surgical procedures and cost-efficiency advantages compared to traditional hospitals. ASCs are adopting compact and modular visualization systems for minimally invasive surgeries, including laparoscopy, arthroscopy, and urology procedures. The growing trend of outpatient surgical care, especially for routine and elective procedures, is encouraging investments in portable and high-performance visualization products. In addition, ASCs benefit from faster installation, lower maintenance costs, and integration with cloud-based monitoring and imaging solutions, supporting rapid adoption.
- By Distribution Channel
On the basis of distribution channel, the market is segmented into direct tender and third-party distributors. The direct tender segment dominated the market in 2024, driven by large healthcare organizations procuring visualization systems directly from manufacturers for better pricing, service agreements, and customization options. Hospitals and high-volume surgical centers prefer direct procurement to ensure compatibility with existing equipment and access to dedicated technical support. Direct tenders also facilitate bulk orders for multiple surgical units and departments, enhancing operational efficiency and cost savings. Manufacturers benefit from direct engagement with end users, enabling tailored solutions and long-term service contracts, reinforcing market dominance.
The third-party distributors segment is expected to witness the fastest growth from 2025 to 2032, fueled by increasing demand from small to mid-sized clinics and diagnostic centers that rely on distributors for flexible purchasing options. Third-party channels offer faster access to a wide range of products without requiring significant upfront investments. Distributors also provide value-added services such as installation, maintenance, and training, which appeal to end users with limited technical expertise. The growth of third-party distribution is supported by expanding medical device networks, partnerships with manufacturers, and the trend of multi-brand procurement to meet diverse surgical requirements.
North America Surgical Visualization Products Market Regional Analysis
- The United States dominated the surgical visualization products market with the largest revenue share of 38.5% in 2024, characterized by advanced healthcare infrastructure, high adoption of cutting-edge surgical technologies, and a strong presence of key industry players
- Healthcare providers in the country highly value the precision, enhanced visualization, and integration capabilities offered by surgical visualization systems with robotic-assisted surgery, 3D imaging, and AI-based guidance tools
- This widespread adoption is further supported by advanced healthcare infrastructure, high healthcare expenditure, and the presence of key industry players, establishing surgical visualization products as essential tools for improving surgical outcomes and procedural efficiency
U.S. Surgical Visualization Products Market Insight
The U.S. surgical visualization products market captured the largest revenue share of 38.5% in 2024 within North America, fueled by the rapid adoption of minimally invasive surgeries and advanced imaging systems. Hospitals and specialty surgical centers are increasingly prioritizing high-definition endoscopic cameras, 3D visualization tools, and AI-assisted surgical systems to enhance precision and procedural outcomes. The growing preference for integrated operating room solutions, combined with rising investments in robotic-assisted surgery, further propels the market. Moreover, the presence of key industry players and continuous technological innovations in imaging and visualization are significantly contributing to market expansion.
Canada Surgical Visualization Products Market Insight
The Canadian surgical visualization products market is expected to grow at a substantial CAGR during the forecast period, driven by increasing investments in healthcare infrastructure and adoption of minimally invasive procedures. Healthcare providers are focusing on improving surgical efficiency and reducing postoperative complications through advanced visualization systems. The demand is further supported by government initiatives promoting modern surgical technologies and the rising prevalence of chronic diseases requiring specialized procedures. Canadian hospitals and surgical centers are incorporating high-definition imaging and 3D visualization tools into both new surgical suites and upgrades of existing operating rooms.
Mexico Surgical Visualization Products Market Insight
The Mexican surgical visualization products market is anticipated to expand at a noteworthy CAGR during the forecast period, fueled by rising awareness of advanced surgical technologies and increased healthcare expenditure. Hospitals and specialty clinics are adopting laparoscopic and arthroscopic visualization systems to improve surgical accuracy and patient outcomes. In addition, the growing number of outpatient surgical procedures and ambulatory surgical centers is contributing to market growth. Mexico’s gradual shift toward modern operating room setups, coupled with an expanding network of private healthcare providers, is further stimulating adoption.
North America Surgical Visualization Products Market Share
The North America Surgical Visualization Products industry is primarily led by well-established companies, including:
- Stryker (U.S.)
- CONMED Corporation (U.S.)
- Olympus Corporation (U.S.)
- Boston Scientific Corporation (U.S.)
- Medtronic (Ireland)
- KARL STORZ SE & Co. KG (Germany)
- FUJIFILM Holdings Corporation (Japan)
- HOYA Corporation (Japan)
- Richard Wolf GmbH (Germany)
- Johnson & Johnson Services, Inc. (U.S.)
- B. Braun SE (Germany)
- Alcon (Switzerland)
- Smith & Nephew (U.K.)
- Intuitive Surgical, Inc. (U.S.)
- Laborie (U.S.)
- Acutronic Holding AG (Switzerland)
- MEDIVIS (U.S.)
- BioDigital, Inc. (U.S.)
- MediView XR, Inc. (U.S.)
- Happersberger otopront GmbH (Germany)
What are the Recent Developments in North America Surgical Visualization Products Market?
- In October 2025, Fujifilm launched the next-generation ELUXEO® 8000 endoscopic imaging system with enhanced LED multi-light technology. The system offers improved image quality and is designed to assist healthcare professionals in providing better patient care. The ELUXEO 8000 System and all seven FDA 510k-cleared 800 Series endoscopes were available for demonstration at the American College of Gastroenterology (ACG) conference
- In September 2025, a groundbreaking laparoscopic surgery was successfully performed using an AI-guided autonomous camera system. The system combines magnetic surgical instruments with AI-driven software that tracks the surgeon’s tools and autonomously adjusts the camera's angle to follow the procedure seamlessly. This development represents a significant advancement toward the automation of surgical procedures
- In September 2025, Surgical Science launched RobotiX Express, a portable robotic surgery training platform that enhances accessibility and hands-on training for surgeons. This innovation aims to improve surgical skills efficiently across various medical centers
- In July 2025, Zimmer Biomet announced its acquisition of Monogram Technologies for approximately USD 177 million to enhance its robotics portfolio, particularly in surgical robotics. Monogram specializes in semi- and fully autonomous surgical technologies, including a semi-autonomous knee replacement system approved by the FDA in March 2025. The deal is part of Zimmer's strategy to broaden its presence in the growing global robotic surgery market, expected to reach USD 16 billion by 2030.
- In March 2025, Olympus announced the launch of an AI-powered surgical planning application designed to enhance pre-operative planning for liver, lung, and kidney procedures. The tool integrates advanced imaging analytics and machine learning, empowering surgeons to take ownership of their pre-op planning. This collaboration represents a significant step forward in Olympus's mission to bring innovative, AI-enabled solutions to the healthcare industry to help make clinical workflows more efficient and effective
SKU-

- Interactive Data Analysis Dashboard
- Company Analysis Dashboard for high growth potential opportunities
- Research Analyst Access for customization & queries
- Competitor Analysis with Interactive dashboard
- Latest News, Updates & Trend analysis
- Harness the Power of Benchmark Analysis for Comprehensive Competitor Tracking
Data collection and base year analysis are done using data collection modules with large sample sizes. The stage includes obtaining market information or related data through various sources and strategies. It includes examining and planning all the data acquired from the past in advance. It likewise envelops the examination of information inconsistencies seen across different information sources. The market data is analysed and estimated using market statistical and coherent models. Also, market share analysis and key trend analysis are the major success factors in the market report. To know more, please request an analyst call or drop down your inquiry.
The key research methodology used by DBMR research team is data triangulation which involves data mining, analysis of the impact of data variables on the market and primary (industry expert) validation. Data models include Vendor Positioning Grid, Market Time Line Analysis, Market Overview and Guide, Company Positioning Grid, Patent Analysis, Pricing Analysis, Company Market Share Analysis, Standards of Measurement, Global versus Regional and Vendor Share Analysis. To know more about the research methodology, drop in an inquiry to speak to our industry experts.
Data Bridge Market Research is a leader in advanced formative research. We take pride in servicing our existing and new customers with data and analysis that match and suits their goal. The report can be customized to include price trend analysis of target brands understanding the market for additional countries (ask for the list of countries), clinical trial results data, literature review, refurbished market and product base analysis. Market analysis of target competitors can be analyzed from technology-based analysis to market portfolio strategies. We can add as many competitors that you require data about in the format and data style you are looking for. Our team of analysts can also provide you data in crude raw excel files pivot tables (Fact book) or can assist you in creating presentations from the data sets available in the report.


