
Market Analysis and Size
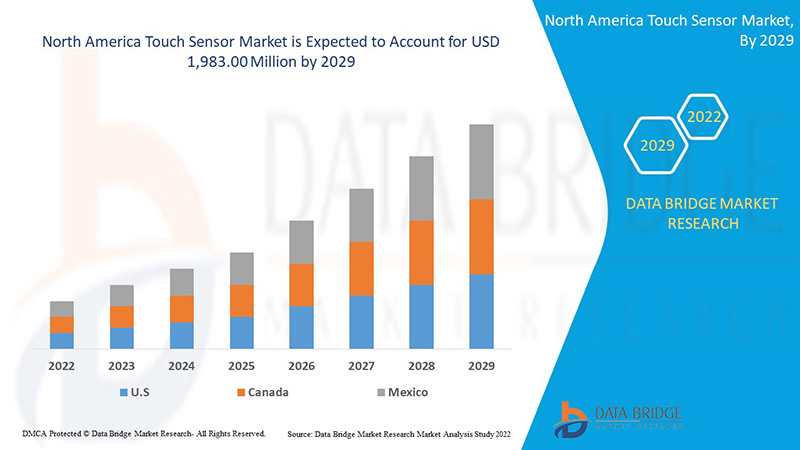
The growing integration of sensors due to the increasing number of touch screen displays and devices may augment the North America touch sensor market growth. Rising demand for consumer electronics such as smart televisions, speakers, and home automation systems is supplementing the market growth.
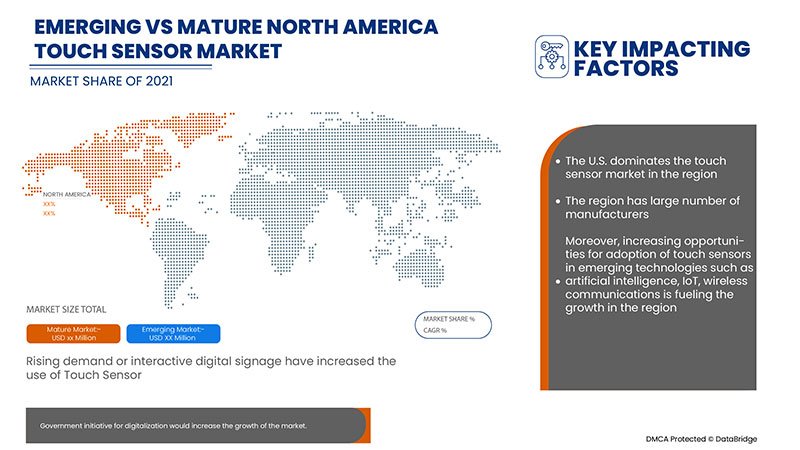
The growing demand for interactive digital signage in retail stores and malls drives the demand for these touch sensors. Also, the growing demand for interactive digital signage in retail stores and malls, which reduces manual labor and acts as self-help for consumers, further accelerates the market growth. The rapid progression of touch sensor technology and increasing use of touch screens in the educational and corporate sector to increase interactivity boost the market's growth. The automotive segment has massive potential to lead the demand for touch sensors owing to the rapid integration of touch panels in vehicles.
The North America touch sensor market players are more focused on new product development, partnership, and other strategies to increase the North America touch sensor market share.
The major factors expected to drive the growth of the North America touch sensor market are the growing adoption of touch-based displays, rising demand for consumer electronics, increasing use of touch screens in the automotive industry, and government initiatives for digitalization. However, declining demand for all-in-one PCs may restrain the market's growth.
Data Bridge Market Research analyses that the touch sensor market is expected to reach the value of USD 1,983.00 million by the year 2029, at a CAGR of 12.6% during the forecast period. "Resistive" accounts for the most prominent type segment in the respective market as resistive touch sensor does not depend on the electrical property of capacitance. The market report curated by the Data Bridge Market Research team includes in-depth expert analysis, import/export analysis, pricing analysis, production consumption analysis, and climate chain scenario.
|
Report Metric |
Details |
|
Forecast Period |
2022 to 2029 |
|
Base Year |
2021 |
|
Historic Years |
2020 (Customizable to 2019 - 2014) |
|
Quantitative Units |
Revenue in USD Million, Pricing in USD |
|
Segments Covered |
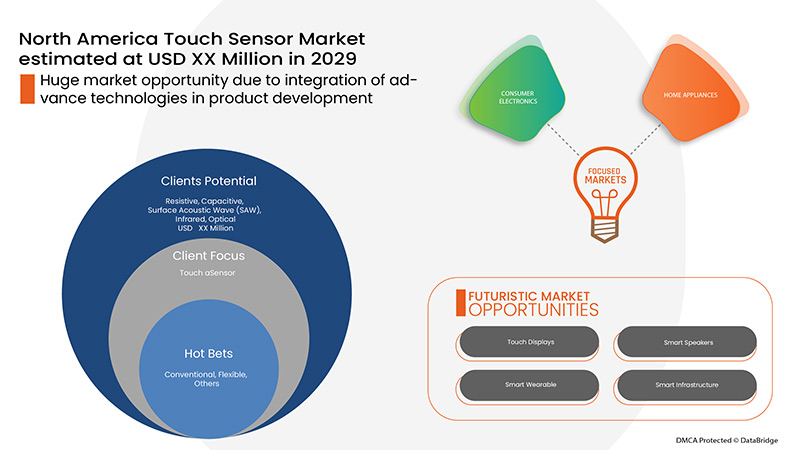
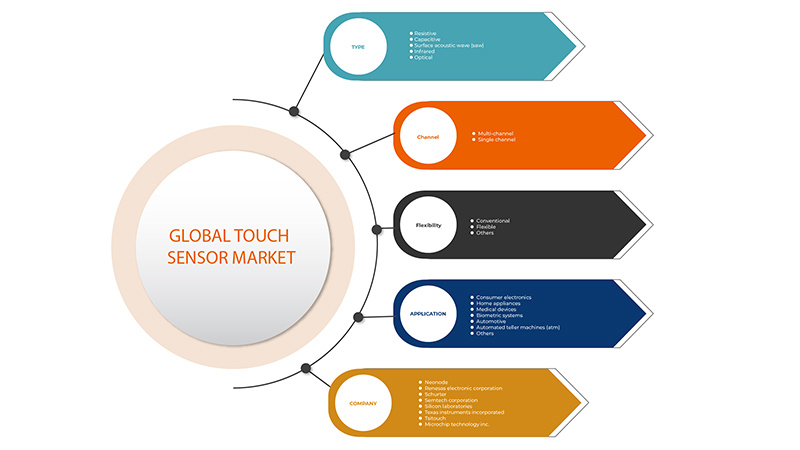
Type (Resistive, Capacitive, Surface Acoustic Wave (SAW), Infrared, Optical), Flexibility (Conventional, Flexible, Others), Channel (Multi-Channel, Single Channel), Application (Consumer Electronics, Home Appliances, Medical Devices, Biometric Systems, Automotive, Automated Teller Machines (ATM), Others) |
|
Countries Covered |
U.S., Canada, and Mexico |
|
Market Players Covered |
Neonode Inc., Renesas Electronics Corporation., SCHURTER, Semtech Corporation, Silicon Laboratories, Texas Instruments Incorporated, TSItouch, Zytronic PLC, Apex Material Technology Corporation, Xymox Technologies, Inc., CIRQUE CORPORATION, Futaba Corporation, Synaptics Incorporated, Infineon Technologies AG, Japan Display Inc., Nissha Co., Ltd., Azoteq (PTY) Ltd, CAPTRON, DMC CO., LTD., Elo Touch Solutions, Inc., Microchip Technology Inc., among others |
Market Definition
A touch sensor is defined as an electronic sensor used to detect and record physical touch. They are considered economical miniature-sized alternatives to traditional mechanical switches. The sensor generally works when a contact or pressure is applied on the surface, which allows the current to flow through the circuit. They are of various types, including capacitive, resistive, infrared, and surface acoustic wave (SAW).
They are used in various applications, including consumer electronics, medical devices, and automotive, due to their numerous advantages. Consumer electronics devices range from entertainment systems such as speakers to communication devices such as mobiles to smart homes and home automation.
The Market Dynamics of the North America Touch Sensor Market Include:
- Growing adoption of touch-based displays
The North American region has seen rapid growth in digital technologies, which has increased the adoption of touch-based displays. For instance, in the case of personal computers and laptops, the mouse and keyboard have been replaced by a simple user interface that is highly responsive and can be easily used for navigation. They are also highly durable and resilient, due to which they have a longer life. Thus, the rapid incorporation of touch-based and touchscreen devices across industries ranging from restaurants to manufacturing companies to financial services is a factor that may drive the growth of the North America market.
- Rising demand for consumer electronics
The upward trend in demand for consumer electronics fueled by the strong demand for devices with better features is a major factor that is anticipated to drive the growth of the North America touch sensor market.
- Increasing use of touch sensors in the automotive industry
North America has huge market opportunity growth for the automotive industry. Companies such as Tesla launching large touch screens of 16 inches in their vehicles have further boosted the demand for touch sensors. The automotive industry has become one of the major users of touch displays and is expected to boost the growth of the North America touch sensor market.
- Government initiatives for digitalization
North America has been highly inclined towards digitalization, and the government is continuously taking steps to get digitally transformed. Digitalization has radically transformed our lives, and the advent of this pandemic has turned this on its head. It has forced economies around the world to rethink their strategies and keep the country running. It has cast a spotlight on their shortfalls in terms of transformation. The government's push towards digitalization through initiatives and foreign investments is a major factor projected to drive the market's growth.
- Rising demand for interactive digital signage
On-premise displays were first introduced in the 1970s when big CRT televisions were used as displays for content management. By 1980, it was used widely in retail space. However, in 2000, software-driven signage exploded and became widely popular. A decade later, flexible and curved displays came into the picture, and it paved the way for machine-machine and human-machine interaction giving rise to interactive digital signage. Technological progression and high-speed connectivity have opened a new door of possibilities.
Restraints/Challenges faced by the North America Touch Sensor Market
- Declining demand for all-in-one-pcs
In North America, the users are more inclined to use smartphones and tablets rather than opting for all-in-one PCs. Today, PCs are widely used across all companies for their work. A normal computer comes with a separate CPU, monitor, and other components, whereas in an All-In-One (AIO) PC, all the components are integrated into the monitor. Apple iMac is considered one of the most successful AIO in general. In general, AIO is very attractive and features a touchscreen monitor. As more companies are providing laptops to their employees for working from home instead of all in one PC, thus it is expected to restrain the market's growth.
- Chip supply shortages
The leaders and executives at multinational corporations in Asia-Pacific are worried about the scarcity of semiconductors, which has hit manufacturing and sales in numerous countries, and no early solution is in sight. This poses a significant challenge to the growth of the market.
This North America touch sensor market report provides details of new recent developments, trade regulations, import-export analysis, production analysis, value chain optimization, market share, the impact of domestic and localized market players, analyses opportunities in terms of emerging revenue pockets, changes in market regulations, strategic market growth analysis, market size, category market growths, application niches and dominance, product approvals, product launches, geographic expansions, technological innovations in the market. To gain more info on the touch sensor market contact Data Bridge Market Research for an Analyst Brief. Our team will help you take an informed market decision to achieve market growth.
Recent Development
- In November 2020, Microchip Technology Inc. announced that they had launched the world's first capacitive touchscreen controller family, MXT336UD-MAUHA1, pre-certified for safety. This family includes three controllers, MXT112UD-MAUHA1, the MXT228UD-MAUHA1, and the MXT336UD-MAUHA1, designed as per varying requirements. It will help the company increase its market share and enter into this field, further generating higher revenues down the road
North America Touch Sensor Market Scope
The North America touch sensor market is segmented on the basis of type, flexibility, channel, and application. The growth amongst these segments will help you analyze meager growth segments in the industries and provide the users with a valuable market overview and market insights to help them make strategic decisions for identifying core market applications.
Type
- Resistive
- Capacitive
- Surface Acoustic Wave (SAW)
- Infrared
- Optical
On the basis of type, the North America touch sensor market is segmented into resistive, capacitive, surface acoustic wave (saw), infrared and optical.
Flexibility
- Conventional
- Flexible
- Others
On the basis of flexibility, the North America touch sensor market is segmented into conventional, flexible, and others.
Channel
- Single Channel
- Multi-Channel
On the basis of channel, the North America touch sensor market is segmented into single channel and multi-channel.
Application
- Consumer Electronics
- Home Appliances
- Medical Devices
- Automated Teller Machines (ATM)
- Biometric Systems
- Automotive
- Others
On the basis of application, the North America touch sensor market is segmented into consumer electronics, home appliances, medical devices, automated teller machines (ATM), biometric systems, automotive, and others.
North America Touch Sensor Market Regional Analysis/Insights
The North America touch sensor market is analyzed, and market size insights and trends are provided by country, type, flexibility, channel, and application as referenced above.
Some of the countries covered in the North America touch sensor market report are the U.S., Canada, and Mexico.
The U.S. is expected to dominate the North America touch sensor market as the region has many local players. The U.S. has been a center for some of the top leading companies in the semiconductor industry.
The country section of the report also provides individual market impacting factors and changes in market regulation that impact the current and future trends of the market. Data points such as downstream and upstream value chain analysis, technical trends and porter's five forces analysis, and case studies are some of the pointers used to forecast the market scenario for individual countries. Also, the presence and availability of North American brands and their challenges faced due to large or scarce competition from local and domestic brands, the impact of domestic tariffs, and trade routes are considered while providing forecast analysis of the country data.
Competitive Landscape and North America Touch Sensor Market Share Analysis
The North America touch sensor market competitive landscape provides details by the competitor. Details included are company overview, company financials, revenue generated, market potential, investment in research and development, new market initiatives, global presence, production sites and facilities, production capacities, company strengths and weaknesses, product launch, product width and breadth, application dominance. The above data points provided are only related to the companies' focus related to the North America touch sensor market.
Some of the major players operating in the North America touch sensor market are Neonode Inc., Renesas Electronics Corporation., SCHURTER, Semtech Corporation, Silicon Laboratories, Texas Instruments Incorporated, TSItouch, Zytronic PLC, Apex Material Technology Corporation, Xymox Technologies, Inc., CIRQUE CORPORATION, Futaba Corporation, Synaptics Incorporated, Infineon Technologies AG, Japan Display Inc., Nissha Co., Ltd., Azoteq (PTY) Ltd, CAPTRON, DMC CO., LTD., Elo Touch Solutions, Inc., Microchip Technology Inc., among others.
Research Methodology: North America Touch Sensor Market
Data collection and base year analysis are done using data collection modules with large sample sizes. The market data is analyzed and estimated using market statistical and coherent models. Also, market share analysis and key trend analysis are the major success factors in the market report. To know more, please request an analyst call or can drop down your inquiry.
The key research methodology used by the DBMR research team is data triangulation which involves data mining, analysis of the impact of data variables on the market, and primary (industry expert) validation. Apart from this, data models include Vendor Positioning Grid, Market Time Line Analysis, Market Overview and Guide, Expert Analysis, Import/Export Analysis, Pricing Analysis, Production Consumption Analysis, Climate Chain Scenario, Company Positioning Grid, Company Market Share Analysis, Standards of Measurement, Global versus Regional and Vendor Share Analysis. To know more about the research methodology, drop an inquiry to speak to our industry experts.
SKU-

- Interactive Data Analysis Dashboard
- Company Analysis Dashboard for high growth potential opportunities
- Research Analyst Access for customization & queries
- Competitor Analysis with Interactive dashboard
- Latest News, Updates & Trend analysis
- Harness the Power of Benchmark Analysis for Comprehensive Competitor Tracking
Table of Content
1 INTRODUCTION
1.1 OBJECTIVES OF THE STUDY
1.2 MARKET DEFINITION
1.3 OVERVIEW OF NORTH AMERICA TOUCH SENSOR MARKET
1.4 CURRENCY AND PRICING
1.5 LIMITATION
1.6 MARKETS COVERED
2 MARKET SEGMENTATION
2.1 MARKETS COVERED
2.2 GEOGRAPHICAL SCOPE
2.3 YEARS CONSIDERED FOR THE STUDY
2.4 DBMR TRIPOD DATA VALIDATION MODEL
2.5 PRIMARY INTERVIEWS WITH KEY OPINION LEADERS
2.6 DBMR MARKET POSITION GRID
2.7 VENDOR SHARE ANALYSIS
2.8 MULTIVARIATE MODELING
2.9 TYPE TIMELINE CURVE
2.1 MARKET APPLICATION COVERAGE GRID
2.11 CHALLENGE MATRIX
2.12 SECONDARY SOURCES
2.13 ASSUMPTIONS
3 EXECUTIVE SUMMARY
4 PREMIUM INSIGHTS
5 PREMIUM INSIGHTS
5.1 TOUCH SENSOR PRICING ANALYSIS
6 MARKET OVERVIEW
6.1 DRIVERS
6.1.1 GROWING ADOPTION OF TOUCH-BASED DISPLAYS
6.1.2 RISING DEMAND FOR CONSUMER ELECTRONICS
6.1.3 INCREASING USE OF TOUCH SCREENS IN THE AUTOMOTIVE INDUSTRY
6.1.4 GOVERNMENT INITIATIVES FOR DIGITALIZATION
6.1.5 RISING DEMAND FOR INTERACTIVE DIGITAL SIGNAGE
6.2 RESTRAINTS
6.2.1 DECLINING DEMAND FOR ALL-IN-ONE PC
6.2.2 SHORTAGE OF SKILLED LABOUR
6.2.3 SHORT SUPPLY OF INDIUM
6.3 OPPORTUNITIES
6.3.1 SURGE IN INDUSTRIAL APPLICATIONS OF TOUCH-BASED PANELS AND EQUIPMENT
6.3.2 DEVELOPMENTS IN MULTI-TOUCH TECHNOLOGY
6.3.3 RISE IN INVESTMENTS FOR R&D OF TOUCH SENSORS
6.4 CHALLENGES
6.4.1 CHIP SUPPLY SHORTAGE
6.4.2 ACCIDENTAL TOUCHES DUE TO HIGH SENSITIVITY
7 COVID-19 IMPACT ON THE NORTH AMERICA TOUCH SENSOR MARKET
7.1 ANALYSIS OF IMPACT OF COVID-19 ON THE MARKET
7.2 AFTERMATH OF COVID-19 AND GOVERNMENT INITIATIVES TO BOOST THE MARKET
7.3 STRATEGIC DECISIONS FOR MANUFACTURERS AFTER COVID-19 TO GAIN COMPETITIVE MARKET SHARE
7.4 IMPACT ON DEMAND
7.5 IMPACT ON PRICE
7.6 IMPACT ON SUPPLY CHAIN
7.7 CONCLUSION
8 NORTH AMERICA TOUCH SENSOR MARKET, BY TYPE
8.1 OVERVIEW
8.2 RESISTIVE
8.2.1 5 –WIRE
8.2.2 8 –WIRE
8.2.3 4 –WIRE
8.3 CAPACITIVE
8.3.1 BY TECHNOLOGY
8.3.1.1 PROJECTED CAPACITANCE
8.3.1.2 SURFACE CAPACITANCE
8.3.2 BY SURFACE TYPE
8.3.2.1 GLASS
8.3.2.2 NON-GLASS
8.3.2.2.1 PLASTIC/POLYMER
8.3.2.2.1.1 PET & PETG
8.3.2.2.1.2 POLYCARBONATES
8.3.2.2.1.3 PMMA
8.3.2.2.1.4 OTHERS
8.3.2.2.2 SAPPHIRE
8.4 SURFACE ACOUSTIC WAVE (SAW)
8.5 INFRARED
8.6 OPTICAL
9 NORTH AMERICA TOUCH SENSOR MARKET, BY FLEXIBILITY
9.1 OVERVIEW
9.2 CONVENTIONAL
9.3 FLEXIBLE
9.4 OTHERS
10 NORTH AMERICA TOUCH SENSOR MARKET, BY CHANNEL
10.1 OVERVIEW
10.2 MULTI-CHANNEL
10.3 SINGLE CHANNEL
11 NORTH AMERICA TOUCH SENSOR MARKET, BY APPLICATION
11.1 OVERVIEW
11.2 CONSUMER ELECTRONICS
11.2.1 LAPTOPS
11.2.2 MONITORS
11.2.3 WEARABLE
11.2.4 ALL-IN-ONE (AIO) PCS
11.2.5 OTHERS
11.3 HOME APPLIANCES
11.3.1 WASHING MACHINES
11.3.2 OVEN
11.3.3 REFRIGERATOR
11.3.4 OTHERS
11.4 MEDICAL DEVICES
11.5 BIOMETRIC SYSTEMS
11.6 AUTOMOTIVE
11.7 AUTOMATED TELLER MACHINES (ATM)
11.8 OTHERS
12 NORTH AMERICA TOUCH SENSOR MARKET, BY REGION
12.1 NORTH AMERICA
12.1.1 U.S.
12.1.2 CANADA
12.1.3 MEXICO
13 NORTH AMERICA TOUCH SENSOR MARKET: COMPANY LANDSCAPE
13.1 COMPANY SHARE ANALYSIS: NORTH AMERICA
14 SWOT ANALYSIS
15 COMPANY PROFILE
15.1 MICROCHIP TECHNOLOGY INC.
15.1.1 COMPANY SNAPSHOT
15.1.2 REVENUE ANALYSIS
15.1.3 COMPANY SHARE ANALYSIS
15.1.4 PRODUCT PORTFOLIO
15.1.5 RECENT DEVELOPMENTS
15.2 INFINEON TECHNOLOGIES AG
15.2.1 COMPANY SNAPSHOT
15.2.2 REVENUE ANALYSIS
15.2.3 COMPANY SHARE ANALYSIS
15.2.4 PRODUCT PORTFOLIO
15.2.5 RECENT DEVELOPMENT
15.3 JAPAN DISPLAY INC.
15.3.1 COMPANY SNAPSHOT
15.3.2 REVENUE ANALYSIS
15.3.3 COMPANY SHARE ANALYSIS
15.3.4 PRODUCT PORTFOLIO
15.3.5 RECENT DEVELOPMENTS
15.4 TEXAS INSTRUMENTS INCORPORATED
15.4.1 COMPANY SNAPSHOT
15.4.2 REVENUE ANALYSIS
15.4.3 COMPANY SHARE ANALYSIS
15.4.4 PRODUCT PORTFOLIO
15.4.5 RECENT DEVELOPMENTS
15.5 NISSHA CO. LTD.
15.5.1 COMPANY SNAPSHOT
15.5.2 REVENUE ANALYSIS
15.5.3 COMPANY SHARE ANALYSIS
15.5.4 PRODUCT PORTFOLIO
15.5.5 RECENT DEVELOPMENT
15.6 RENESAS ELECTRONICS CORPORATION
15.6.1 COMPANY SNAPSHOT
15.6.2 REVENUE ANALYSIS
15.6.3 PRODUCT PORTFOLIO
15.6.4 RECENT DEVELOPMENTS
15.7 APEX MATERIAL TECHNOLOGY CORPORATION
15.7.1 COMPANY SNAPSHOT
15.7.2 PRODUCT PORTFOLIO
15.7.3 RECENT DEVELOPMENTS
15.8 AZOTEQ (PTY) LTD
15.8.1 COMPANY SNAPSHOT
15.8.2 PRODUCT PORTFOLIO
15.8.3 RECENT DEVELOPMENT
15.9 CAPTRON
15.9.1 COMPANY SNAPSHOT
15.9.2 PRODUCT PORTFOLIO
15.9.3 RECENT DEVELOPMENTS
15.1 CIRQUE CORPORATION
15.10.1 COMPANY SNAPSHOT
15.10.2 PRODUCT PORTFOLIO
15.10.3 RECENT DEVELOPMENTS
15.11 DMC CO., LTD.
15.11.1 COMPANY SNAPSHOT
15.11.2 PRODUCT PORTFOLIO
15.11.3 RECENT DEVELOPMENT
15.12 ELO TOUCH SOLUTIONS INC.
15.12.1 COMPANY SNAPSHOT
15.12.2 PRODUCT PORTFOLIO
15.12.3 RECENT DEVELOPMENT
15.13 FUTABA CORPORATION
15.13.1 COMPANY SNAPSHOT
15.13.2 REVENUE ANALYSIS
15.13.3 PRODUCT PORTFOLIO
15.13.4 RECENT DEVELOPMENT
15.14 NEONODE INC.
15.14.1 COMPANY SNAPSHOT
15.14.2 REVENUE ANALYSIS
15.14.3 PRODUCT PORTFOLIO
15.14.4 RECENT DEVELOPMENTS
15.15 SCHURTER
15.15.1 COMPANY SNAPSHOT
15.15.2 PRODUCT PORTFOLIO
15.15.3 RECENT DEVELOPMENTS
15.16 SEMTECH CORPORATION
15.16.1 COMPANY SNAPSHOT
15.16.2 REVENUE ANALYSIS
15.16.3 PRODUCT PORTFOLIO
15.16.4 RECENT DEVELOPMENTS
15.17 SILICON LABORATORIES
15.17.1 COMPANY SNAPSHOT
15.17.2 REVENUE ANALYSIS
15.17.3 PRODUCT PORTFOLIO
15.17.4 RECENT DEVELOPMENTS
15.18 SYNAPTICS INCORPORATED
15.18.1 COMPANY SNAPSHOT
15.18.2 REVENUE ANALYSIS
15.18.3 PRODUCT PORTFOLIO
15.18.4 RECENT DEVELOPMENT
15.19 TSITOUCH
15.19.1 COMPANY SNAPSHOT
15.19.2 PRODUCT PORTFOLIO
15.19.3 RECENT DEVELOPMENTS
15.2 XYMOX TECHNOLOGIES, INC.
15.20.1 COMPANY SNAPSHOT
15.20.2 PRODUCT PORTFOLIO
15.20.3 RECENT DEVELOPMENT
15.21 ZYTRONIC PLC
15.21.1 COMPANY SNAPSHOT
15.21.2 REVENUE ANALYSIS
15.21.3 PRODUCT PORTFOLIO
15.21.4 RECENT DEVELOPMENTS
16 QUESTIONNAIRE
17 RELATED REPORTS
List of Table
TABLE 1 NORTH AMERICA TOUCH SENSOR MARKET, BY TYPE, 2020-2029 (USD MILLION)
TABLE 2 NORTH AMERICA RESISTIVE IN TOUCH SENSOR MARKET, BY REGION, 2020-2029 (USD MILLION)
TABLE 3 NORTH AMERICA RESISTIVE IN TOUCH SENSOR MARKET, BY TYPE, 2020-2029 (USD MILLION)
TABLE 4 NORTH AMERICA CAPACITIVE IN TOUCH SENSOR MARKET, BY REGION, 2020-2029 (USD MILLION)
TABLE 5 NORTH AMERICA CAPACITIVE IN TOUCH SENSOR MARKET, BY TECHNOLOGY, 2020-2029 (USD MILLION)
TABLE 6 NORTH AMERICA CAPACITIVE IN TOUCH SENSOR MARKET, BY SURFACE TYPE, 2020-2029 (USD MILLION)
TABLE 7 NORTH AMERICA NON-GLASS IN TOUCH SENSOR MARKET, BY TYPE, 2020-2029 (USD MILLION)
TABLE 8 NORTH AMERICA PLASTIC/POLYMER IN TOUCH SENSOR MARKET, BY TYPE, 2020-2029 (USD MILLION)
TABLE 9 NORTH AMERICA SURFACE ACOUSTIC WAVE (SAW) IN TOUCH SENSOR MARKET, BY REGION, 2020-2029 (USD MILLION)
TABLE 10 NORTH AMERICA INFRARED IN TOUCH SENSOR MARKET, BY REGION, 2020-2029 (USD MILLION)
TABLE 11 NORTH AMERICA OPTICAL IN TOUCH SENSOR MARKET, BY REGION, 2020-2029 (USD MILLION)
TABLE 12 NORTH AMERICA TOUCH SENSOR MARKET, BY FLEXIBILITY, 2020-2029 (USD MILLION)
TABLE 13 NORTH AMERICA CONVENTIONAL IN TOUCH SENSOR MARKET, BY REGION, 2020-2029 (USD MILLION)
TABLE 14 NORTH AMERICA FLEXIBLE IN TOUCH SENSOR MARKET, BY REGION, 2020-2029 (USD MILLION)
TABLE 15 NORTH AMERICA OTHERS IN TOUCH SENSOR MARKET, BY REGION, 2020-2029 (USD MILLION)
TABLE 16 NORTH AMERICA TOUCH SENSOR MARKET, BY CHANNEL, 2020-2029 (USD MILLION)
TABLE 17 NORTH AMERICA MULTI-CHANNEL IN TOUCH SENSOR MARKET, BY REGION, 2020-2029 (USD MILLION)
TABLE 18 NORTH AMERICA SINGLE CHANNEL IN TOUCH SENSOR MARKET, BY REGION, 2020-2029 (USD MILLION)
TABLE 19 NORTH AMERICA TOUCH SENSOR MARKET, BY APPLICATION, 2020-2029 (USD MILLION)
TABLE 20 NORTH AMERICA CONSUMER ELECTRONICS IN TOUCH SENSOR MARKET, BY REGION, 2020-2029 (USD MILLION)
TABLE 21 NORTH AMERICA CONSUMER ELECTRONICS IN TOUCH SENSOR, BY TYPE, 2020-2029 (USD MILLION)
TABLE 22 NORTH AMERICA HOME APPLIANCES IN TOUCH SENSOR MARKET, BY REGION, 2020-2029 (USD MILLION)
TABLE 23 NORTH AMERICA HOME APPLIANCES IN TOUCH SENSOR, BY TYPE, 2020-2029 (USD MILLION)
TABLE 24 NORTH AMERICA MEDICAL DEVICES IN TOUCH SENSOR MARKET, BY REGION, 2020-2029 (USD MILLION)
TABLE 25 NORTH AMERICA BIOMETRIC SYSTEMS IN TOUCH SENSOR MARKET, BY REGION, 2020-2029 (USD MILLION)
TABLE 26 NORTH AMERICA AUTOMOTIVE IN TOUCH SENSOR MARKET, BY REGION, 2020-2029 (USD MILLION)
TABLE 27 NORTH AMERICA AUTOMATED TELLER MACHINES (ATM) IN TOUCH SENSOR MARKET, BY REGION, 2020-2029 (USD MILLION)
TABLE 28 NORTH AMERICA OTHERS IN TOUCH SENSOR MARKET, BY REGION, 2020-2029 (USD MILLION)
TABLE 29 NORTH AMERICA TOUCH SENSOR MARKET, BY COUNTRY, 2020-2029 (USD MILLION)
TABLE 30 NORTH AMERICA TOUCH SENSOR MARKET, BY TYPE, 2020-2029 (USD MILLION)
TABLE 31 NORTH AMERICA RESISTIVE IN TOUCH SENSOR MARKET, BY TYPE, 2020-2029 (USD MILLION)
TABLE 32 NORTH AMERICA CAPACITIVE IN TOUCH SENSOR MARKET, BY TECHNOLOGY, 2020-2029 (USD MILLION)
TABLE 33 NORTH AMERICA CAPACITIVE IN TOUCH SENSOR MARKET, BY SURFACE TYPE, 2020-2029 (USD MILLION)
TABLE 34 NORTH AMERICA NON-GLASS IN TOUCH SENSOR MARKET, BY TYPE, 2020-2029 (USD MILLION)
TABLE 35 NORTH AMERICA PLASTIC/POLYMER IN TOUCH SENSOR MARKET, BY TYPE, 2020-2029 (USD MILLION)
TABLE 36 NORTH AMERICA TOUCH SENSOR MARKET, BY FLEXIBILITY, 2020-2029 (USD MILLION)
TABLE 37 NORTH AMERICA TOUCH SENSOR MARKET, BY CHANNEL, 2020-2029 (USD MILLION)
TABLE 38 NORTH AMERICA TOUCH SENSOR MARKET, BY APPLICATION, 2020-2029 (USD MILLION)
TABLE 39 NORTH AMERICA CONSUMER ELECTRONICS IN TOUCH SENSOR MARKET, BY TYPE, 2020-2029 (USD MILLION)
TABLE 40 NORTH AMERICA HOME APPLIANCES IN TOUCH SENSOR MARKET, BY TYPE, 2020-2029 (USD MILLION)
TABLE 41 U.S. TOUCH SENSOR MARKET, BY TYPE, 2020-2029 (USD MILLION)
TABLE 42 U.S. RESISTIVE IN TOUCH SENSOR MARKET, BY TYPE, 2020-2029 (USD MILLION)
TABLE 43 U.S. CAPACITIVE IN TOUCH SENSOR MARKET, BY TECHNOLOGY, 2020-2029 (USD MILLION)
TABLE 44 U.S. CAPACITIVE IN TOUCH SENSOR MARKET, BY SURFACE TYPE, 2020-2029 (USD MILLION)
TABLE 45 U.S. NON-GLASS IN TOUCH SENSOR MARKET, BY TYPE, 2020-2029 (USD MILLION)
TABLE 46 U.S. PLASTIC/POLYMER IN TOUCH SENSOR MARKET, BY TYPE, 2020-2029 (USD MILLION)
TABLE 47 U.S. TOUCH SENSOR MARKET, BY FLEXIBILITY, 2020-2029 (USD MILLION)
TABLE 48 U.S. TOUCH SENSOR MARKET, BY CHANNEL, 2020-2029 (USD MILLION)
TABLE 49 U.S. TOUCH SENSOR MARKET, BY APPLICATION, 2020-2029 (USD MILLION)
TABLE 50 U.S. CONSUMER ELECTRONICS IN TOUCH SENSOR MARKET, BY TYPE, 2020-2029 (USD MILLION)
TABLE 51 U.S. HOME APPLIANCES IN TOUCH SENSOR MARKET, BY TYPE, 2020-2029 (USD MILLION)
TABLE 52 CANADA TOUCH SENSOR MARKET, BY TYPE, 2020-2029 (USD MILLION)
TABLE 53 CANADA RESISTIVE IN TOUCH SENSOR MARKET, BY TYPE, 2020-2029 (USD MILLION)
TABLE 54 CANADA CAPACITIVE IN TOUCH SENSOR MARKET, BY TECHNOLOGY, 2020-2029 (USD MILLION)
TABLE 55 CANADA CAPACITIVE IN TOUCH SENSOR MARKET, BY SURFACE TYPE, 2020-2029 (USD MILLION)
TABLE 56 CANADA NON-GLASS IN TOUCH SENSOR MARKET, BY TYPE, 2020-2029 (USD MILLION)
TABLE 57 CANADA PLASTIC/POLYMER IN TOUCH SENSOR MARKET, BY TYPE, 2020-2029 (USD MILLION)
TABLE 58 CANADA TOUCH SENSOR MARKET, BY FLEXIBILITY, 2020-2029 (USD MILLION)
TABLE 59 CANADA TOUCH SENSOR MARKET, BY CHANNEL, 2020-2029 (USD MILLION)
TABLE 60 CANADA TOUCH SENSOR MARKET, BY APPLICATION, 2020-2029 (USD MILLION)
TABLE 61 CANADA CONSUMER ELECTRONICS IN TOUCH SENSOR MARKET, BY TYPE, 2020-2029 (USD MILLION)
TABLE 62 CANADA HOME APPLIANCES IN TOUCH SENSOR MARKET, BY TYPE, 2020-2029 (USD MILLION)
TABLE 63 MEXICO TOUCH SENSOR MARKET, BY TYPE, 2020-2029 (USD MILLION)
TABLE 64 MEXICO RESISTIVE IN TOUCH SENSOR MARKET, BY TYPE, 2020-2029 (USD MILLION)
TABLE 65 MEXICO CAPACITIVE IN TOUCH SENSOR MARKET, BY TECHNOLOGY, 2020-2029 (USD MILLION)
TABLE 66 MEXICO CAPACITIVE IN TOUCH SENSOR MARKET, BY SURFACE TYPE, 2020-2029 (USD MILLION)
TABLE 67 MEXICO NON-GLASS IN TOUCH SENSOR MARKET, BY TYPE, 2020-2029 (USD MILLION)
TABLE 68 MEXICO PLASTIC/POLYMER IN TOUCH SENSOR MARKET, BY TYPE, 2020-2029 (USD MILLION)
TABLE 69 MEXICO TOUCH SENSOR MARKET, BY FLEXIBILITY, 2020-2029 (USD MILLION)
TABLE 70 MEXICO TOUCH SENSOR MARKET, BY CHANNEL, 2020-2029 (USD MILLION)
TABLE 71 MEXICO TOUCH SENSOR MARKET, BY APPLICATION, 2020-2029 (USD MILLION)
TABLE 72 MEXICO CONSUMER ELECTRONICS IN TOUCH SENSOR MARKET, BY TYPE, 2020-2029 (USD MILLION)
TABLE 73 MEXICO HOME APPLIANCES IN TOUCH SENSOR MARKET, BY TYPE, 2020-2029 (USD MILLION)
List of Figure
FIGURE 1 NORTH AMERICA TOUCH SENSOR MARKET: SEGMENTATION
FIGURE 2 NORTH AMERICA TOUCH SENSOR MARKET: DATA TRIANGULATION
FIGURE 3 NORTH AMERICA TOUCH SENSOR MARKET: DROC ANALYSIS
FIGURE 4 NORTH AMERICA TOUCH SENSOR MARKET: NORTH AMERICA VS REGIONAL MARKET ANALYSIS
FIGURE 5 NORTH AMERICA TOUCH SENSOR MARKET: COMPANY RESEARCH ANALYSIS
FIGURE 6 NORTH AMERICA TOUCH SENSOR MARKET: INTERVIEW DEMOGRAPHICS
FIGURE 7 NORTH AMERICA TOUCH SENSOR MARKET: DBMR MARKET POSITION GRID
FIGURE 8 NORTH AMERICA TOUCH SENSOR MARKET: VENDOR SHARE ANALYSIS
FIGURE 9 NORTH AMERICA TOUCH SENSOR MARKET: APPLICATION COVERAGE GRID
FIGURE 10 NORTH AMERICA TOUCH SENSOR MARKET: CHALLENGE MATRIX
FIGURE 11 NORTH AMERICA TOUCH SENSOR MARKET: SEGMENTATION
FIGURE 12 GROWING INTEGRATION OF SENSORS IN TOUCH-ENABLED DEVICES IS EXPECTED TO DRIVE NORTH AMERICA TOUCH SENSOR MARKET IN THE FORECAST PERIOD
FIGURE 13 RESISTIVE SEGMENT IS EXPECTED TO ACCOUNT FOR THE LARGEST SHARE OF NORTH AMERICA TOUCH SENSOR MARKET IN 2022 & 2029
FIGURE 14 ASIA-PACIFIC IS EXPECTED TO DOMINATE AND IS THE FASTEST-GROWING REGION IN NORTH AMERICA TOUCH SENSOR MARKET IN THE FORECAST PERIOD
FIGURE 15 DRIVERS, RESTRAINTS, OPPORTUNITIES, AND CHALLENGES OF THE NORTH AMERICA TOUCH SENSOR MARKET
FIGURE 16 NORTH AMERICA TOUCH SENSOR MARKET: BY TYPE, 2021
FIGURE 17 NORTH AMERICA TOUCH SENSOR MARKET: BY FLEXIBILITY, 2021
FIGURE 18 NORTH AMERICA TOUCH SENSOR MARKET: BY CHANNEL, 2021
FIGURE 19 NORTH AMERICA TOUCH SENSOR MARKET: BY APPLICATION, 2021
FIGURE 20 NORTH AMERICA TOUCH SENSOR MARKET: SNAPSHOT (2021)
FIGURE 21 NORTH AMERICA TOUCH SENSOR MARKET: BY COUNTRY (2021)
FIGURE 22 NORTH AMERICA TOUCH SENSOR MARKET: BY COUNTRY (2022 & 2029)
FIGURE 23 NORTH AMERICA TOUCH SENSOR MARKET: BY COUNTRY (2021 & 2029)
FIGURE 24 NORTH AMERICA TOUCH SENSOR MARKET: BY TYPE (2022-2029)
FIGURE 25 NORTH AMERICA TOUCH SENSOR MARKET: COMPANY SHARE 2021 (%)
North America Touch Sensor Market, Supply Chain Analysis and Ecosystem Framework
To support market growth and help clients navigate the impact of geopolitical shifts, DBMR has integrated in-depth supply chain analysis into its North America Touch Sensor Market research reports. This addition empowers clients to respond effectively to global changes affecting their industries. The supply chain analysis section includes detailed insights such as North America Touch Sensor Market consumption and production by country, price trend analysis, the impact of tariffs and geopolitical developments, and import and export trends by country and HSN code. It also highlights major suppliers with data on production capacity and company profiles, as well as key importers and exporters. In addition to research, DBMR offers specialized supply chain consulting services backed by over a decade of experience, providing solutions like supplier discovery, supplier risk assessment, price trend analysis, impact evaluation of inflation and trade route changes, and comprehensive market trend analysis.
Data collection and base year analysis are done using data collection modules with large sample sizes. The stage includes obtaining market information or related data through various sources and strategies. It includes examining and planning all the data acquired from the past in advance. It likewise envelops the examination of information inconsistencies seen across different information sources. The market data is analysed and estimated using market statistical and coherent models. Also, market share analysis and key trend analysis are the major success factors in the market report. To know more, please request an analyst call or drop down your inquiry.
The key research methodology used by DBMR research team is data triangulation which involves data mining, analysis of the impact of data variables on the market and primary (industry expert) validation. Data models include Vendor Positioning Grid, Market Time Line Analysis, Market Overview and Guide, Company Positioning Grid, Patent Analysis, Pricing Analysis, Company Market Share Analysis, Standards of Measurement, Global versus Regional and Vendor Share Analysis. To know more about the research methodology, drop in an inquiry to speak to our industry experts.
Data Bridge Market Research is a leader in advanced formative research. We take pride in servicing our existing and new customers with data and analysis that match and suits their goal. The report can be customized to include price trend analysis of target brands understanding the market for additional countries (ask for the list of countries), clinical trial results data, literature review, refurbished market and product base analysis. Market analysis of target competitors can be analyzed from technology-based analysis to market portfolio strategies. We can add as many competitors that you require data about in the format and data style you are looking for. Our team of analysts can also provide you data in crude raw excel files pivot tables (Fact book) or can assist you in creating presentations from the data sets available in the report.


