
Market Analysis and Insights: South America Biostimulants Market
Biostimulants market is expected to gain market growth in the forecast period of 2022 to 2029. Data Bridge Market Research analyses that the market is growing with the CAGR of 13.8% in the forecast period of 2022 to 2029 and expected to reach 1,447.76 million by 2029.
Biostimulants are developed to help farmers in order to meet increased agricultural demand on a sustainable basis. Biostimulants boost crop yield and its value, which positively affects the farm productivity. Agricultural biostimulant is comprised of multiple amalgamations of chemicals, substances, and micro-organisms that are added to the plants or soils to boost crop vigor, production, sensitivity to abiotic pressure, and quality. Biostimulants support the growth and production of crops throughout the entire crop life cycle, from seed germination to plant maturity, in a variety of demonstrated ways including regulating plant metabolism. They are developed for farmers to meet the demand for sustainable agriculture including quality and improved crop yield, and even for the consumers to meet the demand for organic products so as to cope up with health and safety standards. Thus, due to this, investors are increasingly interested in the biostimulant category with respect to the significant growth potential.
The major factors driving the growth of the biostimulants market are increasing adoption of organic products in agriculture, rising need for increasing agricultural production to meet the surge in population pressure and unstable yields in agriculture due to climate changes. Increasing agricultural production in South America is creating opportunities for the growth of the market. Biostimulant quality contamination issues during manufacturing and transportation is acting as the major restraint for biostimulants market.
This biostimulants market report provides details of market share, new developments, and product pipeline analysis, impact of domestic and localised market players, analyses opportunities in terms of emerging revenue pockets, changes in market regulations, product approvals, strategic decisions, product launches, geographic expansions, and technological innovations in the market. To understand the analysis and the market scenario contact us for an Analyst Brief, our team will help you create a revenue impact solution to achieve your desired goal.
South America Biostimulants Market Scope and Market Size
Biostimulants market is segmented on the basis of active ingredients, crop type, application method, form, origin, end user and distribution channel. The growth among segments helps you analyse niche pockets of growth and strategies to approach the market and determine your core application areas and the difference in your target markets.
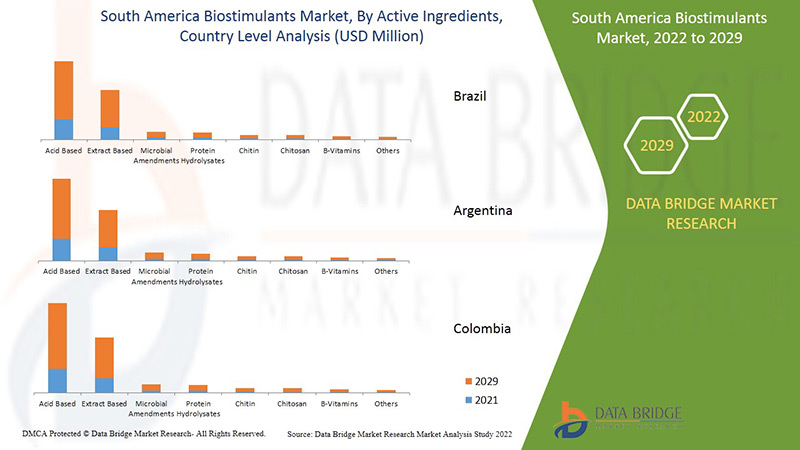
- On the basis of active ingredients, the South America biostimulants market is segmented into acid based, extract based, microbial amendments, protein hydrolysates, B-vitamins, chitin, chitosan, and others. In 2022, Acid based segment is expected to dominate the market as it has important components, such as humic acid, fulvic acid, and it increases productivity and growth of the plant. Along with these, it enhances fertility of soil and shows less harmful effect on ecosystem. Humic acid helps plants by maintaining nutrient availability, gas exchange between soil and atmosphere and it also improves fertility of soil.
- On the basis of crop type, South America biostimulants market is segmented into fruits & vegetables, cereals & grains, turf & ornamentals, oilseeds & pulses, and other crops. In 2022, Fruits and vegetables segment is expected to dominate the market due to its high production globally. Farmers are producing more fruits and vegetables to fulfil the growing demand of consumers. It has been observed that high fruits and vegetables production will need more biostimulants with high growth and productivity so this sector is dominating the market.
- On the basis of application method, South America biostimulants market is segmented into foliar treatment, soil treatment, and seed treatment. In 2022, foliar treatment segment is expected to dominate the market as it is highly preferred application by farmers as it shows more effect on plant. Foliar application involves sprinkling of biostimulants on the leaves which are easily absorbed and it shows high productivity.
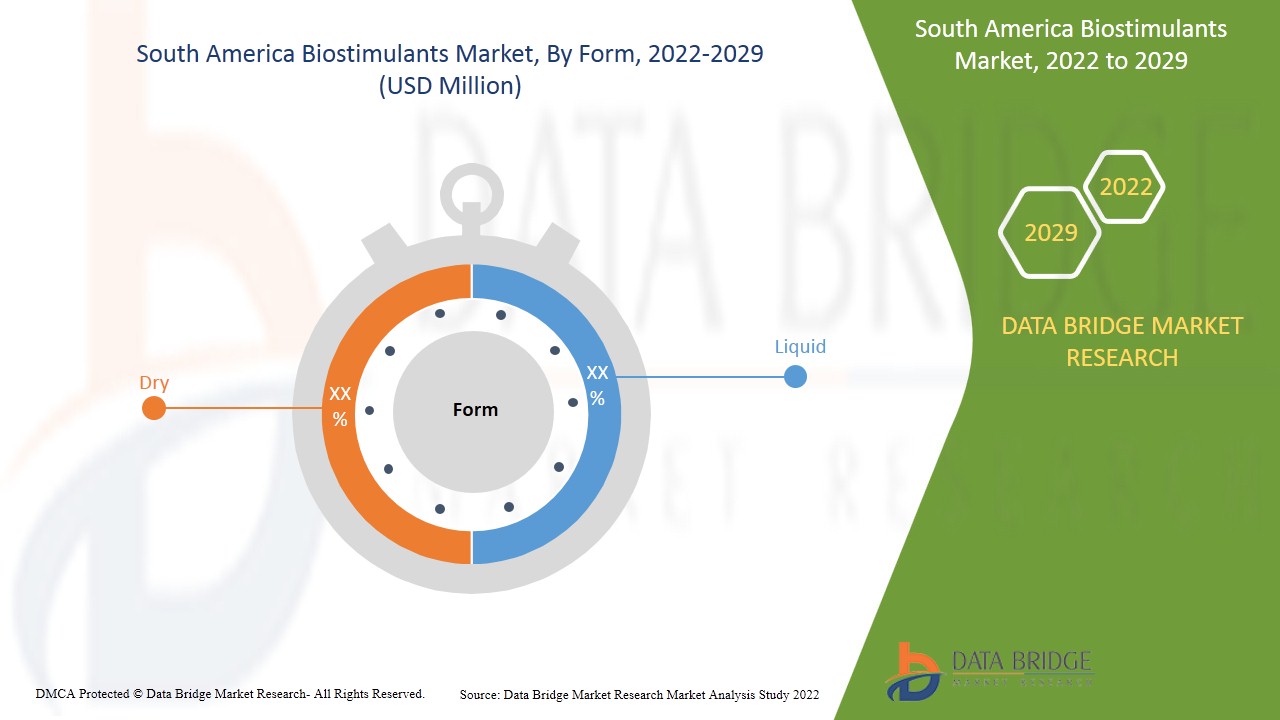
- On the basis of form, South America biostimulants market is segmented into liquid and dry. Liquid is sub-segmented into suspension concentrate, soluble liquid concentrate, and emulsifiable concentrate. In 2022, Liquid segment is expected to dominate the market because it is easily absorbed by the leaves as well as in soil to provide a good root system, better stems and foliar development to make the crop more capable to abiotic stress. Due to multiple benefits from the liquid biostimulants, it has been observed that products in liquid forms are highly preferred.
- On the basis of origin, South America biostimulants market is segmented into natural biostimulants and biosynthetic biostimulants. In 2022, Natural biostimulants segment is expected to dominate the market due its minimal harmful effect on ecosystem as it is made up from natural sources such as seaweed and plant, microbes and other plant material. The natural biostimulants maintain the fertility of soil and prevent it from erosion. However, synthetic segment may grow the market because of use of certain synthetic regulators that ultimately helps the plant growth.
- On the basis of end user, South America biostimulants market is segmented into farmers, agri and related industries, and research institutes. In 2022, farmers segment is expected to dominate the market as it is highly used in farm by farmers to increase yield and growth of the crops for fulfilling the growing demand of food in market. In recent time, farmers are more inclined towards biostimulants due to their benefits such as high productivity, plant growth and less harmful to nature.
- On the basis of distribution channel, South America biostimulants market is segmented into direct, and indirect. In 2022, direct segment is expected to dominate the market because large scale farming as well as related industries needs high amount of stimulating products for high productivity of agricultural products so they directly contact with biostimulants manufacturing companies and hence it takes higher share.
South America Biostimulants Market Country Level Analysis
South America biostimulants market is analysed and market size information is provided by country, active ingredients, crop type, application method, form, origin, end user and distribution channel.
The countries covered in South America biostimulants market report are Brazil, Argentina, Colombia, Peru, Chile, Ecuador, Uruguay, Paraguay and Rest of South America.
Brazil accounted for maximum share in the biostimulants market due to presence of large number of local players in the region. Argentina accounts for second largest market due to increasing growth in farming technologies in the region. Colombia has witnessed high growth in biostimulants due to large number of farmers in the region.
The country section of the biostimulants market report also provides individual market impacting factors and changes in regulation in the market domestically that impacts the current and future trends of the market. Data points such as new sales, replacement sales, country demographics, regulatory acts and import-export analysis are some of the major pointers used to forecast the market scenario for individual countries. Also, presence and availability of global brands and their challenges faced due to large or scarce competition from local and domestic brands, impact of sales channels are considered while providing forecast analysis of the country data.
Rising Demand of Biostimulants
South America biostimulants market also provides you with detailed market analysis for every country growth in installed base of different kind of products, impact of technology using life line curves and changes regulatory scenarios and their impact on the biostimulants market. The data is available for historic year 2012 to 2020.
Competitive Landscape and Biostimulants Market Share Analysis
Biostimulants market competitive landscape provides details by competitor. Details included are company overview, company financials, revenue generated, market potential, investment in research and development, new market initiatives, global presence, production sites and facilities, company strengths and weaknesses, product launch, clinical trials pipelines, brand analysis, product approvals, patents, product width and breadth, application dominance, technology lifeline curve. The above data points provided are only related to the companies’ focus related to Biostimulants market.
Some of the major players operating in the South America biostimulants market are UPL, Lallemand Inc., Agrinos, Koppert Biological Systems, Syngenta, SICIT Group S.p.A, Isagro S.p.A., ILSA S.p.A., OMEX, Trade Corporation International, Bayer AG, Marrone Bio Innovations, Inc., SEIPASA, S.A., Innovak Global, SA de CV, Stoller Group, Yara, BASF SE, Novozymes, Atlantica Agricola, Italpollina Spa, SummitAgro, and others.
For instance,
- In July 2020, Syngenta announced collaboration with IICA (Inter-American Institute for Cooperation on Agriculture). Accordingly, the collaboration was able to implement actions aimed at increasing farmers’ productivity in a sustainable manner and protecting food security in Latin America and the Caribbean. This enabled the company to implement scientific developments in crop protection and seed improvement in rural areas of Latin America and the Caribbean together with IICA.
- In March 2020, SICIT Group S.p.A. and Syngenta announced collaboration to promote sustainable agriculture by signing of a supply contract for ISABION and HICURE biostimulants. The agreement also emphasized on the development of collagen-based biostimulants in the near future. This enabled the company to increase access for farmers to innovative solutions for sustainable farming.
Partnership, joint ventures and other strategies enhances the company market share with increased coverage and presence. It also provides the benefit for organisation to improve their offering for biostimulants market through expanded product range.
SKU-

- Interactive Data Analysis Dashboard
- Company Analysis Dashboard for high growth potential opportunities
- Research Analyst Access for customization & queries
- Competitor Analysis with Interactive dashboard
- Latest News, Updates & Trend analysis
- Harness the Power of Benchmark Analysis for Comprehensive Competitor Tracking
Table of Content
1 INTRODUCTION
1.1 OBJECTIVES OF THE STUDY
1.2 MARKET DEFINITION
1.3 OVERVIEW OF SOUTH AMERICA BIOSTIMULANTS MARKET
1.4 CURRENCY AND PRICING
1.5 LIMITATIONS
1.6 MARKETS COVERED
2 MARKET SEGMENTATION
2.1 MARKETS COVERED
2.2 GEOGRAPHICAL SCOPE
2.3 YEARS CONSIDERED FOR THE STUDY
2.4 DBMR TRIPOD DATA VALIDATION MODEL
2.5 PRIMARY INTERVIEWS WITH KEY OPINION LEADERS
2.6 DBMR MARKET POSITION GRID
2.7 VENDOR SHARE ANALYSIS
2.8 APPLICATION COVERAGE GRID
2.9 MULTIVARIATE MODELING
2.1 OFFERING TIMELINE CURVE
2.11 SECONDARY SOURCES
2.12 ASSUMPTIONS
3 EXECUTIVE SUMMARY
4 PREMIUM INSIGHTS
4.1 GROWTH STRATEGIES
4.2 CONSUMER TRENDS
5 MARKET OVERVIEW
5.1 DRIVERS
5.1.1 INCREASING ADOPTION OF ORGANIC PRODUCTS IN AGRICULTURE
5.1.2 RISING NEED FOR INCREASING AGRICULTURAL PRODUCTION TO MEET THE SURGE IN POPULATION PRESSURE
5.1.3 UNSTABLE YIELDS IN AGRICULTURE DUE TO CLIMATE CHANGES
5.1.4 GROWING EMPHASIS ON SUSTAINABLE FARMING
5.2 RESTRAINTS
5.2.1 BIOSTIMULANT QUALITY CONTAMINATION ISSUES DURING MANUFACTURING AND TRANSPORTATION
5.3 OPPORTUNITIES
5.3.1 INCREASING AGRICULTURAL PRODUCTION IN SOUTH AMERICA
5.3.2 SURGE IN ADOPTION OF MODERN FARMING TECHNOLOGIES FOR INCREASING CROP YIELD
5.4 CHALLENGES
5.4.1 REGIONAL INCONSISTENCY IN DEFINITION AND REGULATIONS CONCERNIGN BIOSTIMULANTS
5.4.2 DEMAND AMONG FARMERS FOR SUBSTITUTE PRODUCTS TO BIOSTIMULANTS
6 COVID-19 IMPACT ON SOUTH AMERICA BIOSTIMULANTS MARKET
6.1 ANALYSIS ON IMPACT OF COVID-19 ON THE MARKET
6.2 AFTERMATH OF COVID-19 AND GOVERNMENT INITIATIVE TO BOOST THE MARKET
6.3 STRATEGIC DECISIONS FOR MANUFACTURERS AFTER COVID-19 TO GAIN COMPETITIVE MARKET SHARE
6.4 IMPACT ON DEMAND
6.5 IMPACT ON SUPPLY CHAIN
6.6 PRICE IMPACT
6.7 CONCLUSION
7 SOUTH AMERICA BIOSTIMULANTS MARKET, BY ACTIVE INGREDIENTS
7.1 OVERVIEW
7.2 ACID BASED
7.2.1 AMINO ACID
7.2.2 FULVIC ACID
7.2.3 HUMIC ACID
7.3 EXTRACT BASED
7.3.1 SEAWEED EXTRACTS
7.3.2 PLANT EXTRACT
7.3.3 FUNGAL EXTRACT
7.4 MICROBIAL AMENDMENTS
7.5 PROTEIN HYDROLYSATES
7.6 CHITIN
7.7 CHITOSAN
7.8 B-VITAMINS
7.9 OTHERS
8 SOUTH AMERICA BIOSTIMULANTS MARKET, BY CROP TYPE
8.1 OVERVIEW
8.2 FRUITS & VEGETABLES
8.3 CEREALS & GRAINS
8.4 OILSEEDS & PULSES
8.5 TURF & ORNAMENTALS
8.6 OTHER CROPS
9 SOUTH AMERICA BIOSTIMULANTS MARKET, BY APPLICATION METHOD
9.1 OVERVIEW
9.2 FOLIAR TREATMENT
9.3 SOIL TREATMENT
9.4 SEED TREATMENT
10 SOUTH AMERICA BIOSTIMULANTS MARKET, BY FORM
10.1 OVERVIEW
10.2 LIQUID
10.2.1 SOLUBLE LIQUID CONCENTRATE
10.2.2 EMULSIFIABLE CONCENTRATE
10.2.3 SUSPENSION CONCENTRATE
10.3 DRY
10.3.1 WETTABLE POWDER
10.3.2 DRY GRANULES
10.3.3 WATER DISPERSIBLE
11 SOUTH AMERICA BIOSTIMULANTS MARKET, BY ORIGIN
11.1 OVERVIEW
11.2 NATURAL BIOSTIMULANTS
11.3 BIOSYNTHETIC BIOSTIMULANTS
12 SOUTH AMERICA BIOSTIMULANTS MARKET, BY END USER
12.1 OVERVIEW
12.2 FARMERS
12.3 AGRI AND RELATED INDUSTRIES
12.4 RESEARCH INSTITUTES
13 SOUTH AMERICA BIOSTIMULANTS MARKET, BY DISTRIBUTION CHANNEL
13.1 OVERVIEW
13.2 DIRECT
13.3 INDIRECT
14 SOUTH AMERICA BIOSTIMULANTS MARKET, BY COUNTRY
14.1 BRAZIL
14.2 ARGENTINA
14.3 COLOMBIA
14.4 PERU
14.5 CHILE
14.6 ECUADOR
14.7 URUGUAY
14.8 PARAGUAY
14.9 REST OF SOUTH AMERICA
15 SOUTH AMERICA BIOSTIMULANTS MARKET: COMPANY LANDSCAPE
15.1 COMPANY SHARE ANALYSIS: SOUTH AMERICA
16 SWOT ANALYSIS (TOP 5 COMPANIES)
16.1 UPL
16.2 BAYER AG
16.3 SYNGENTA
16.4 YARA
16.5 LALLEMAND INC.
17 COMPANY PROFILE
17.1 UPL
17.1.1 COMPANY SNAPSHOT
17.1.2 REVENUE ANALYSIS
17.1.3 PRODUCT PORTFOLIO
17.1.4 RECENT DEVELOPMENTS
17.2 BAYER AG
17.2.1 COMPANY SNAPSHOT
17.2.2 REVENUE ANALYSIS
17.2.3 PRODUCT PORTFOLIO
17.2.4 RECENT DEVELOPMENTS
17.3 SYNGENTA GROUP
17.3.1 COMPANY SNAPSHOT
17.3.2 PRODUCT PORTFOLIO
17.3.3 RECENT DEVELOPMENTS
17.4 YARA
17.4.1 COMPANY SNAPSHOT
17.4.2 REVENUE ANALYSIS
17.4.3 PRODUCT PORTFOLIO
17.4.4 RECENT DEVELOPMENTS
17.5 LALLEMAND INC.
17.5.1 COMPANY SNAPSHOT
17.5.2 PRODUCT PORTFOLIO
17.5.3 RECENT DEVELOPMENTS
17.6 AGRINOS
17.6.1 COMPANY SNAPSHOT
17.6.2 PRODUCT PORTFOLIO
17.6.3 RECENT DEVELOPMENTS
17.7 ATLÁNTICA AGRÍCOLA
17.7.1 COMPANY SNAPSHOT
17.7.2 PRODUCT PORTFOLIO
17.7.3 RECENT DEVELOPMENT
17.8 BASF SE
17.8.1 COMPANY SNAPSHOT
17.8.2 REVENUE ANALYSIS
17.8.3 PRODUCT PORTFOLIO
17.8.4 RECENT DEVELOPMENT
17.9 INNOVAK GLOBAL, SA DE CV
17.9.1 COMPANY SNAPSHOT
17.9.2 PRODUCT PORTFOLIO
17.9.3 RECENT DEVELOPMENTS
17.1 ILSA S.P.A.
17.10.1 COMPANY SNAPSHOT
17.10.2 PRODUCT PORTFOLIO
17.10.3 RECENT DEVELOPMENTS
17.11 ISAGRO S.P.A.
17.11.1 COMPANY SNAPSHOT
17.11.2 REVENUE ANALYSIS
17.11.3 PRODUCT PORTFOLIO
17.11.4 RECENT DEVELOPMENT
17.12 ITALPOLLINA SPA
17.12.1 COMPANY SNAPSHOT
17.12.2 PRODUCT PORTFOLIO
17.12.3 RECENT DEVELOPMENT
17.13 KOPPERT BIOLOGICAL SYSTEMS
17.13.1 COMPANY SNAPSHOT
17.13.2 PRODUCT PORTFOLIO
17.13.3 RECENT DEVELOPMENTS
17.14 MARRONE BIO INNOVATIONS, INC.
17.14.1 COMPANY SNAPSHOT
17.14.2 REVENUE ANALYSIS
17.14.3 PRODUCT PORTFOLIO
17.14.4 RECENT DEVELOPMENTS
17.15 NOVOZYMES
17.15.1 COMPANY SNAPSHOT
17.15.2 REVENUE ANALYSIS
17.15.3 PRODUCT PORTFOLIO
17.15.4 RECENT DEVELOPMENTS
17.16 OMEX
17.16.1 COMPANY SNAPSHOT
17.16.2 PRODUCT PORTFOLIO
17.16.3 RECENT DEVELOPMENT
17.17 SEIPASA, S.A.
17.17.1 COMPANY SNAPSHOT
17.17.2 PRODUCT PORTFOLIO
17.17.3 RECENT DEVELOPMENTS
17.18 SICIT GROUP S.P.A.
17.18.1 COMPANY SNAPSHOT
17.18.2 REVENUE ANALYSIS
17.18.3 PRODUCT PORTFOLIO
17.18.4 RECENT DEVELOPMENTS
17.19 STOLLER GROUP
17.19.1 COMPANY SNAPSHOT
17.19.2 PRODUCT PORTFOLIO
17.19.3 RECENT DEVELOPMENTS
17.2 SUMMITAGRO
17.20.1 COMPANY SNAPSHOT
17.20.2 PRODUCT PORTFOLIO
17.20.3 RECENT DEVELOPMENTS
17.21 TRADE CORPORATION INTERNATIONAL
17.21.1 COMPANY SNAPSHOT
17.21.2 PRODUCT PORTFOLIO
17.21.3 RECENT DEVELOPMENTS
18 QUESTIONNAIRE
19 RELATED REPORTS
List of Table
TABLE 1 SOUTH AMERICA BIOSTIMULANTS MARKET, BY ACTIVE INGREDIENTS, 2020-2029 (USD MILLION)
TABLE 2 SOUTH AMERICA ACID BASED IN BIOSTIMULANTS MARKET, BY TYPE, 2020-2029 (USD MILLION)
TABLE 3 SOUTH AMERICA EXTRACT BASED IN BIOSTIMULANTS MARKET, BY TYPE, 2020-2029 (USD MILLION)
TABLE 4 SOUTH AMERICA BIOSTIMULANTS MARKET, BY CROP TYPE, 2020-2029 (USD MILLION)
TABLE 5 SOUTH AMERICA BIOSTIMULANTS MARKET, BY APPLICATION METHOD, 2020-2029 (USD MILLION)
TABLE 6 SOUTH AMERICA BIOSTIMULANTS MARKET, BY FORM, 2020-2029 (USD MILLION)
TABLE 7 SOUTH AMERICA LIQUID IN BIOSTIMULANTS MARKET, BY TYPE, 2020-2029 (USD MILLION)
TABLE 8 SOUTH AMERICA DRY IN BIOSTIMULANTS MARKET, BY TYPE, 2020-2029 (USD MILLION)
TABLE 9 SOUTH AMERICA BIOSTIMULANTS MARKET, BY ORIGIN, 2020-2029 (USD MILLION)
TABLE 10 SOUTH AMERICA BIOSTIMULANTS MARKET, BY END USER, 2020-2029 (USD MILLION)
TABLE 11 SOUTH AMERICA BIOSTIMULANTS MARKET, BY DISTRIBUTION CHANNEL, 2020-2029 (USD MILLION)
TABLE 12 SOUTH AMERICA BIOSTIMULANTS MARKET, BY COUNTRY, 2020-2029 (USD MILLION)
TABLE 13 BRAZIL BIOSTIMULANTS MARKET, BY ACTIVE INGREDIENTS, 2020-2029 (USD MILLION)
TABLE 14 BRAZIL ACID BASED IN BIOSTIMULANTS MARKET, BY TYPE, 2020-2029 (USD MILLION)
TABLE 15 BRAZIL EXTRACT BASED IN BIOSTIMULANTS MARKET, BY TYPE, 2020-2029 (USD MILLION)
TABLE 16 BRAZIL BIOSTIMULANTS MARKET, BY CROP TYPE, 2020-2029 (USD MILLION)
TABLE 17 BRAZIL BIOSTIMULANTS MARKET, BY APPLICATION METHOD, 2020-2029 (USD MILLION)
TABLE 18 BRAZIL BIOSTIMULANTS MARKET, BY FORM, 2020-2029 (USD MILLION)
TABLE 19 BRAZIL LIQUID IN BIOSTIMULANTS MARKET, BY TYPE, 2020-2029 (USD MILLION)
TABLE 20 BRAZIL DRY IN BIOSTIMULANTS MARKET, BY TYPE, 2020-2029 (USD MILLION)
TABLE 21 BRAZIL BIOSTIMULANTS MARKET, BY ORIGIN, 2020-2029 (USD MILLION)
TABLE 22 BRAZIL BIOSTIMULANTS MARKET, BY END USER, 2020-2029 (USD MILLION)
TABLE 23 BRAZIL BIOSTIMULANTS MARKET, BY DISTRIBUTION CHANNEL, 2020-2029 (USD MILLION)
TABLE 24 ARGENTINA BIOSTIMULANTS MARKET, BY ACTIVE INGREDIENTS, 2020-2029 (USD MILLION)
TABLE 25 ARGENTINA ACID BASED IN BIOSTIMULANTS MARKET, BY TYPE, 2020-2029 (USD MILLION)
TABLE 26 ARGENTINA EXTRACT BASED IN BIOSTIMULANTS MARKET, BY TYPE, 2020-2029 (USD MILLION)
TABLE 27 ARGENTINA BIOSTIMULANTS MARKET, BY CROP TYPE, 2020-2029 (USD MILLION)
TABLE 28 ARGENTINA BIOSTIMULANTS MARKET, BY APPLICATION METHOD, 2020-2029 (USD MILLION)
TABLE 29 ARGENTINA BIOSTIMULANTS MARKET, BY FORM, 2020-2029 (USD MILLION)
TABLE 30 ARGENTINA LIQUID IN BIOSTIMULANTS MARKET, BY TYPE, 2020-2029 (USD MILLION)
TABLE 31 ARGENTINA DRY IN BIOSTIMULANTS MARKET, BY TYPE, 2020-2029 (USD MILLION)
TABLE 32 ARGENTINA BIOSTIMULANTS MARKET, BY ORIGIN, 2020-2029 (USD MILLION)
TABLE 33 ARGENTINA BIOSTIMULANTS MARKET, BY END USER, 2020-2029 (USD MILLION)
TABLE 34 ARGENTINA BIOSTIMULANTS MARKET, BY DISTRIBUTION CHANNEL, 2020-2029 (USD MILLION)
TABLE 35 COLOMBIA BIOSTIMULANTS MARKET, BY ACTIVE INGREDIENTS, 2020-2029 (USD MILLION)
TABLE 36 COLOMBIA ACID BASED IN BIOSTIMULANTS MARKET, BY TYPE, 2020-2029 (USD MILLION)
TABLE 37 COLOMBIA EXTRACT BASED IN BIOSTIMULANTS MARKET, BY TYPE, 2020-2029 (USD MILLION)
TABLE 38 COLOMBIA BIOSTIMULANTS MARKET, BY CROP TYPE, 2020-2029 (USD MILLION)
TABLE 39 COLOMBIA BIOSTIMULANTS MARKET, BY APPLICATION METHOD, 2020-2029 (USD MILLION)
TABLE 40 COLOMBIA BIOSTIMULANTS MARKET, BY FORM, 2020-2029 (USD MILLION)
TABLE 41 COLOMBIA LIQUID IN BIOSTIMULANTS MARKET, BY TYPE, 2020-2029 (USD MILLION)
TABLE 42 COLOMBIA DRY IN BIOSTIMULANTS MARKET, BY TYPE, 2020-2029 (USD MILLION)
TABLE 43 COLOMBIA BIOSTIMULANTS MARKET, BY ORIGIN, 2020-2029 (USD MILLION)
TABLE 44 COLOMBIA BIOSTIMULANTS MARKET, BY END USER, 2020-2029 (USD MILLION)
TABLE 45 COLOMBIA BIOSTIMULANTS MARKET, BY DISTRIBUTION CHANNEL, 2020-2029 (USD MILLION)
TABLE 46 PERU BIOSTIMULANTS MARKET, BY ACTIVE INGREDIENTS, 2020-2029 (USD MILLION)
TABLE 47 PERU ACID BASED IN BIOSTIMULANTS MARKET, BY TYPE, 2020-2029 (USD MILLION)
TABLE 48 PERU EXTRACT BASED IN BIOSTIMULANTS MARKET, BY TYPE, 2020-2029 (USD MILLION)
TABLE 49 PERU BIOSTIMULANTS MARKET, BY CROP TYPE, 2020-2029 (USD MILLION)
TABLE 50 PERU BIOSTIMULANTS MARKET, BY APPLICATION METHOD, 2020-2029 (USD MILLION)
TABLE 51 PERU BIOSTIMULANTS MARKET, BY FORM, 2020-2029 (USD MILLION)
TABLE 52 PERU LIQUID IN BIOSTIMULANTS MARKET, BY TYPE, 2020-2029 (USD MILLION)
TABLE 53 PERU DRY IN BIOSTIMULANTS MARKET, BY TYPE, 2020-2029 (USD MILLION)
TABLE 54 PERU BIOSTIMULANTS MARKET, BY ORIGIN, 2020-2029 (USD MILLION)
TABLE 55 PERU BIOSTIMULANTS MARKET, BY END USER, 2020-2029 (USD MILLION)
TABLE 56 PERU BIOSTIMULANTS MARKET, BY DISTRIBUTION CHANNEL, 2020-2029 (USD MILLION)
TABLE 57 CHILE BIOSTIMULANTS MARKET, BY ACTIVE INGREDIENTS, 2020-2029 (USD MILLION)
TABLE 58 CHILE ACID BASED IN BIOSTIMULANTS MARKET, BY TYPE, 2020-2029 (USD MILLION)
TABLE 59 CHILE EXTRACT BASED IN BIOSTIMULANTS MARKET, BY TYPE, 2020-2029 (USD MILLION)
TABLE 60 CHILE BIOSTIMULANTS MARKET, BY CROP TYPE, 2020-2029 (USD MILLION)
TABLE 61 CHILE BIOSTIMULANTS MARKET, BY APPLICATION METHOD, 2020-2029 (USD MILLION)
TABLE 62 CHILE BIOSTIMULANTS MARKET, BY FORM, 2020-2029 (USD MILLION)
TABLE 63 CHILE LIQUID IN BIOSTIMULANTS MARKET, BY TYPE, 2020-2029 (USD MILLION)
TABLE 64 CHILE DRY IN BIOSTIMULANTS MARKET, BY TYPE, 2020-2029 (USD MILLION)
TABLE 65 CHILE BIOSTIMULANTS MARKET, BY ORIGIN, 2020-2029 (USD MILLION)
TABLE 66 CHILE BIOSTIMULANTS MARKET, BY END USER, 2020-2029 (USD MILLION)
TABLE 67 CHILE BIOSTIMULANTS MARKET, BY DISTRIBUTION CHANNEL, 2020-2029 (USD MILLION)
TABLE 68 ECUADOR BIOSTIMULANTS MARKET, BY ACTIVE INGREDIENTS, 2020-2029 (USD MILLION)
TABLE 69 ECUADOR ACID BASED IN BIOSTIMULANTS MARKET, BY TYPE, 2020-2029 (USD MILLION)
TABLE 70 ECUADOR EXTRACT BASED IN BIOSTIMULANTS MARKET, BY TYPE, 2020-2029 (USD MILLION)
TABLE 71 ECUADOR BIOSTIMULANTS MARKET, BY CROP TYPE, 2020-2029 (USD MILLION)
TABLE 72 ECUADOR BIOSTIMULANTS MARKET, BY APPLICATION METHOD, 2020-2029 (USD MILLION)
TABLE 73 ECUADOR BIOSTIMULANTS MARKET, BY FORM, 2020-2029 (USD MILLION)
TABLE 74 ECUADOR LIQUID IN BIOSTIMULANTS MARKET, BY TYPE, 2020-2029 (USD MILLION)
TABLE 75 ECUADOR DRY IN BIOSTIMULANTS MARKET, BY TYPE, 2020-2029 (USD MILLION)
TABLE 76 ECUADOR BIOSTIMULANTS MARKET, BY ORIGIN, 2020-2029 (USD MILLION)
TABLE 77 ECUADOR BIOSTIMULANTS MARKET, BY END USER, 2020-2029 (USD MILLION)
TABLE 78 ECUADOR BIOSTIMULANTS MARKET, BY DISTRIBUTION CHANNEL, 2020-2029 (USD MILLION)
TABLE 79 URUGUAY BIOSTIMULANTS MARKET, BY ACTIVE INGREDIENTS, 2020-2029 (USD MILLION)
TABLE 80 URUGUAY ACID BASED IN BIOSTIMULANTS MARKET, BY TYPE, 2020-2029 (USD MILLION)
TABLE 81 URUGUAY EXTRACT BASED IN BIOSTIMULANTS MARKET, BY TYPE, 2020-2029 (USD MILLION)
TABLE 82 URUGUAY BIOSTIMULANTS MARKET, BY CROP TYPE, 2020-2029 (USD MILLION)
TABLE 83 URUGUAY BIOSTIMULANTS MARKET, BY APPLICATION METHOD, 2020-2029 (USD MILLION)
TABLE 84 URUGUAY BIOSTIMULANTS MARKET, BY FORM, 2020-2029 (USD MILLION)
TABLE 85 URUGUAY LIQUID IN BIOSTIMULANTS MARKET, BY TYPE, 2020-2029 (USD MILLION)
TABLE 86 URUGUAY DRY IN BIOSTIMULANTS MARKET, BY TYPE, 2020-2029 (USD MILLION)
TABLE 87 URUGUAY BIOSTIMULANTS MARKET, BY ORIGIN, 2020-2029 (USD MILLION)
TABLE 88 URUGUAY BIOSTIMULANTS MARKET, BY END USER, 2020-2029 (USD MILLION)
TABLE 89 URUGUAY BIOSTIMULANTS MARKET, BY DISTRIBUTION CHANNEL, 2020-2029 (USD MILLION)
TABLE 90 PARAGUAY BIOSTIMULANTS MARKET, BY ACTIVE INGREDIENTS, 2020-2029 (USD MILLION)
TABLE 91 PARAGUAY ACID BASED IN BIOSTIMULANTS MARKET, BY TYPE, 2020-2029 (USD MILLION)
TABLE 92 PARAGUAY EXTRACT BASED IN BIOSTIMULANTS MARKET, BY TYPE, 2020-2029 (USD MILLION)
TABLE 93 PARAGUAY BIOSTIMULANTS MARKET, BY CROP TYPE, 2020-2029 (USD MILLION)
TABLE 94 PARAGUAY BIOSTIMULANTS MARKET, BY APPLICATION METHOD, 2020-2029 (USD MILLION)
TABLE 95 PARAGUAY BIOSTIMULANTS MARKET, BY FORM, 2020-2029 (USD MILLION)
TABLE 96 PARAGUAY LIQUID IN BIOSTIMULANTS MARKET, BY TYPE, 2020-2029 (USD MILLION)
TABLE 97 PARAGUAY DRY IN BIOSTIMULANTS MARKET, BY TYPE, 2020-2029 (USD MILLION)
TABLE 98 PARAGUAY BIOSTIMULANTS MARKET, BY ORIGIN, 2020-2029 (USD MILLION)
TABLE 99 PARAGUAY BIOSTIMULANTS MARKET, BY END USER, 2020-2029 (USD MILLION)
TABLE 100 PARAGUAY BIOSTIMULANTS MARKET, BY DISTRIBUTION CHANNEL, 2020-2029 (USD MILLION)
TABLE 101 REST OF SOUTH AMERICA BIOSTIMULANTS MARKET, BY ACTIVE INGREDIENTS, 2020-2029 (USD MILLION)
List of Figure
FIGURE 1 SOUTH AMERICA BIOSTIMULANTS MARKET: SEGMENTATION
FIGURE 2 SOUTH AMERICA BIOSTIMULANTS MARKET: DATA TRIANGULATION
FIGURE 3 SOUTH AMERICA BIOSTIMULANTS MARKET: DROC ANALYSIS
FIGURE 4 SOUTH AMERICA BIOSTIMULANTS MARKET: GLOBAL VS REGIONAL MARKET ANALYSIS
FIGURE 5 SOUTH AMERICA BIOSTIMULANTS MARKET: COMPANY RESEARCH ANALYSIS
FIGURE 6 SOUTH AMERICA BIOSTIMULANTS MARKET: INTERVIEW DEMOGRAPHICS
FIGURE 7 SOUTH AMERICA BIOSTIMULANTS MARKET: DBMR MARKET POSITION GRID
FIGURE 8 SOUTH AMERICA BIOSTIMULANTS MARKET: VENDOR SHARE ANALYSIS
FIGURE 9 SOUTH AMERICA BIOSTIMULANTS MARKET: APPLICATION COVERAGE GRID
FIGURE 10 SOUTH AMERICA BIOSTIMULANTS MARKET: SEGMENTATION
FIGURE 11 GROWING EMPHASIS ON SUSTAINABLE FARMING IS EXPECTED TO DRIVE SOUTH AMERICA BIOSTIMULANTS MARKET IN THE FORECAST PERIOD OF 2022 TO 2029
FIGURE 12 ACID BASED SEGMENT IS EXPECTED TO ACCOUNT FOR THE LARGEST SHARE OF SOUTH AMERICA BIOSTIMULANTS MARKET IN 2022 & 2029
FIGURE 13 DRIVERS, RESTRAINT, OPPORTUNITIES, AND CHALLENGE OF SOUTH AMERICA BIOSTIMULANTS MARKET
FIGURE 14 SOUTH AMERICA BIOSTIMULANTS MARKET, BY ACTIVE INGREDIENTS, 2021
FIGURE 15 SOUTH AMERICA BIOSTIMULANTS MARKET, BY CROP TYPE, 2021
FIGURE 16 SOUTH AMERICA BIOSTIMULANTS MARKET, BY APPLICATION METHOD, 2021
FIGURE 17 SOUTH AMERICA BIOSTIMULANTS MARKET, BY FORM, 2021
FIGURE 18 SOUTH AMERICA BIOSTIMULANTS MARKET, BY ORIGIN, 2021
FIGURE 19 SOUTH AMERICA BIOSTIMULANTS MARKET, BY END USER, 2021
FIGURE 20 SOUTH AMERICA BIOSTIMULANTS MARKET, BY DISTRIBUTION CHANNEL, 2021
FIGURE 21 SOUTH AMERICA BIOSTIMULANTS MARKET: SNAPSHOT (2021)
FIGURE 22 SOUTH AMERICA BIOSTIMULANTS MARKET: BY COUNTRY (2021)
FIGURE 23 SOUTH AMERICA BIOSTIMULANTS MARKET: BY COUNTRY (2022 & 2029)
FIGURE 24 SOUTH AMERICA BIOSTIMULANTS MARKET: BY COUNTRY (2021 & 2029)
FIGURE 25 SOUTH AMERICA BIOSTIMULANTS MARKET: BY ACTIVE INGREDIENTS (2022-2029)
FIGURE 26 SOUTH AMERICA BIOSTIMULANTS MARKET: COMPANY SHARE 2021 (%)
Data collection and base year analysis are done using data collection modules with large sample sizes. The stage includes obtaining market information or related data through various sources and strategies. It includes examining and planning all the data acquired from the past in advance. It likewise envelops the examination of information inconsistencies seen across different information sources. The market data is analysed and estimated using market statistical and coherent models. Also, market share analysis and key trend analysis are the major success factors in the market report. To know more, please request an analyst call or drop down your inquiry.
The key research methodology used by DBMR research team is data triangulation which involves data mining, analysis of the impact of data variables on the market and primary (industry expert) validation. Data models include Vendor Positioning Grid, Market Time Line Analysis, Market Overview and Guide, Company Positioning Grid, Patent Analysis, Pricing Analysis, Company Market Share Analysis, Standards of Measurement, Global versus Regional and Vendor Share Analysis. To know more about the research methodology, drop in an inquiry to speak to our industry experts.
Data Bridge Market Research is a leader in advanced formative research. We take pride in servicing our existing and new customers with data and analysis that match and suits their goal. The report can be customized to include price trend analysis of target brands understanding the market for additional countries (ask for the list of countries), clinical trial results data, literature review, refurbished market and product base analysis. Market analysis of target competitors can be analyzed from technology-based analysis to market portfolio strategies. We can add as many competitors that you require data about in the format and data style you are looking for. Our team of analysts can also provide you data in crude raw excel files pivot tables (Fact book) or can assist you in creating presentations from the data sets available in the report.


