
Us Familial Adenomatous Polyposis Treatment Market
Market Size in USD Billion
 USD
494.18 Billion
USD
659.11 Billion
2024
2032
USD
494.18 Billion
USD
659.11 Billion
2024
2032
| 2025 - 2032 | |
| USD 494.18 Billion | |
| USD 659.11 Billion | |
| % | |
|
Familial Adenomatous Polyposis Treatment Market Size
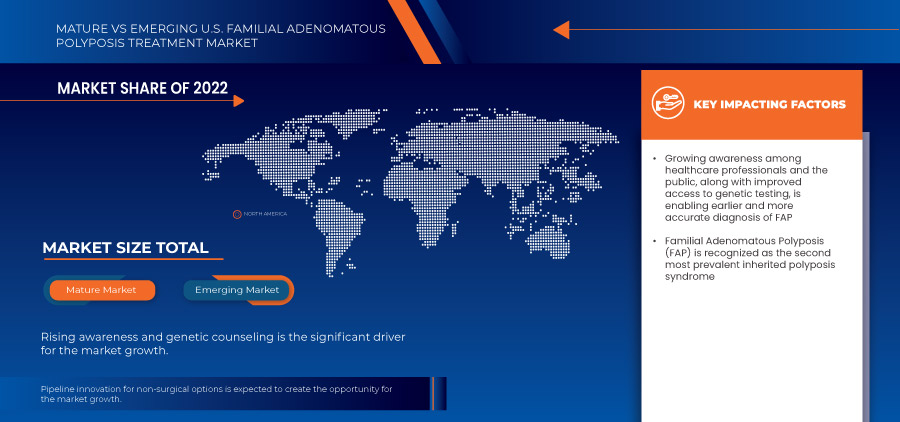
- The U.S. familial adenomatous polyposis treatment market size was valued at USD 659.11 million by 2032 from USD 494.18 million in 2024, growing with a substantial CAGR of 3.7% during the forecast period
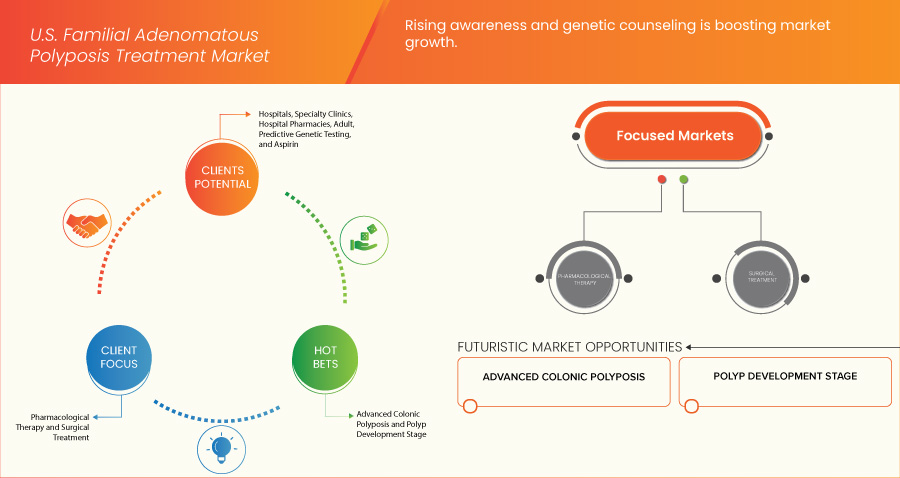
- The market growth is primarily driven by rising awareness and genetic counseling
- Additionally, the improved capacity to identify FAP patients earlier and more accurately expands the addressable market for surveillance and potential therapeutic interventions, stimulating demand for new management strategies
Familial Adenomatous Polyposis Treatment Market Analysis
- The U.S. market is experiencing steady growth driven by increased awareness of early genetic screening and the availability of advanced diagnostic technologies for Familial Adenomatous Polyposis (FAP)
- The presence of well-established healthcare infrastructure, favorable reimbursement policies, and a strong pipeline of clinical research are supporting the adoption of targeted therapies and surgical interventions across the country
- The pharmacological therapy segment is expected to dominate the market with 40.55% by 2025, driven by the growing emphasis on non-invasive disease management, expanded clinical use of NSAIDs and targeted agents, and increased accessibility to oral medications. The availability of multiple drug classes such as COX-2 inhibitors, DFMO, EGFR inhibitors, and novel small molecule therapies, along with diverse routes of administration including oral,
- The surgical treatment segment is growing with the CAGR of 4.8% due to the growing emphasis on non-invasive disease management, expanded clinical use of NSAIDs and targeted agents and intravenous, subcutaneous, and topical further supports the segment's growth
Report Scope and Familial Adenomatous Polyposis Treatment Market Segmentation
|
Attributes |
Familial Adenomatous Polyposis Treatment Key Market Insights |
|
Segments Covered |
|
|
Key Market Players |
|
|
Market Opportunities |
|
|
Value Added Data Infosets |
In addition to the insights on market scenarios such as market value, growth rate, segmentation, geographical coverage, and major players, the market reports curated by the Data Bridge Market Research also include depth expert analysis, patient epidemiology, pipeline analysis, pricing analysis, and regulatory framework. |
Familial Adenomatous Polyposis Treatment Market Trends
“Shift Toward Non-Surgical, Targeted Therapies”
- The U.S. is witnessing a strong trend toward non-surgical and targeted therapeutic options for the treatment of Familial Adenomatous Polyposis (FAP), driven by advancements in precision medicine and unmet clinical needs
- According to preliminary results presented at Digestive Disease Week 2025, investigational drugs like REC‑4881 and eRapa have demonstrated significant reductions in polyp burden, indicating their potential to delay or even eliminate the need for colectomy in certain FAP patients
- These emerging therapies offer targeted mechanisms—such as MEK1/2 inhibition and mTOR modulation—which aim to reduce polyp growth while preserving normal intestinal tissue, improving both clinical outcomes and patient quality of life
- As surgical colectomy remains invasive with lifelong consequences, there is a growing preference for oral therapies and immunomodulators that provide less disruptive, long-term management solutions—particularly for younger or asymptomatic mutation carriers
- The growing regulatory support from the FDA through Orphan Drug and Fast Track designations is further catalyzing R&D investment and accelerating clinical trials in the U.S., reinforcing the market’s pivot toward minimally invasive pharmacological alternatives to traditional surgical care
Familial Adenomatous Polyposis Treatment Market Dynamics
Driver
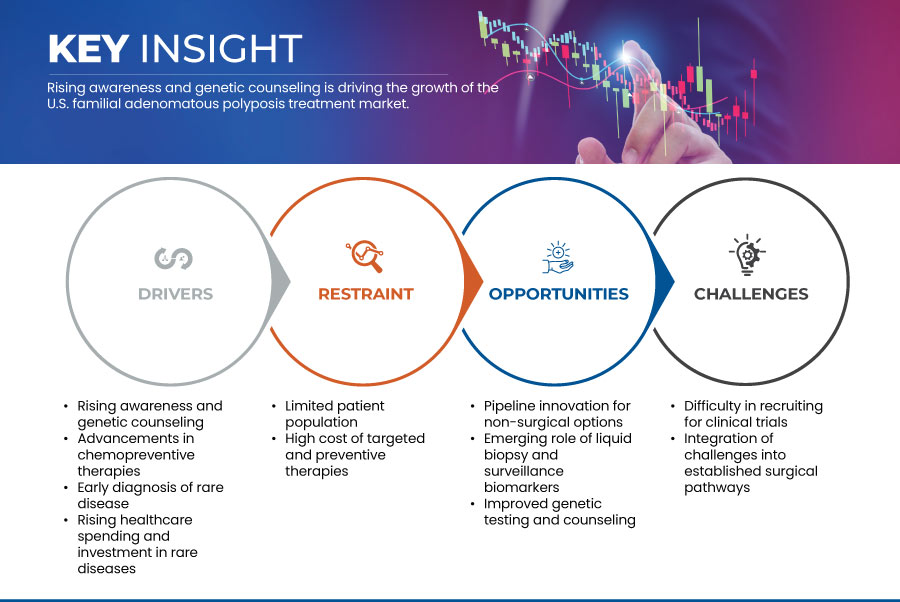
“Rising Awareness and Genetic Counseling”
- The Familial Adenomatous Polyposis (FAP) treatment market is currently experiencing significant acceleration, primarily driven by a robust and continuously expanding awareness of FAP among both the general public and specialized healthcare professionals
- This acceleration is significantly influenced by the rising awareness of FAP, which is intricately linked to the increasing accessibility and sophisticated utilization of genetic counseling services nationwide
- For instance, In May 2025, according to the American Society of Clinical Oncology (ASCO), famitinib demonstrated sustained clinical efficacy and meaningful survival benefits in patients with FAP-associated aggressive desmoid tumors after a median follow-up of 32 months. The report also indicated that, given the unique characteristics of these tumors, careful monitoring for intestinal perforation and the risk of second primary tumors was crucial during treatment
- Moreover, rising awareness and genetic counseling are primary and accelerating drivers of the FAP treatment market growth in the forecast period
Restraint/Challenge
“Limited Patient Population”
- As a designated rare genetic disorder, FAP affects a comparatively tiny fraction of the overall populace, with incidence rates estimated at a mere 1 in 5,000 to 10,000 live births
- This inherently small patient pool presents considerable challenges in terms of market size, rendering it demonstrably less appealing for substantial, large-scale pharmaceutical investments when compared to the vast commercial potential of treatments for more prevalent conditions
- Furthermore, this scarcity of affected individuals creates profound difficulties in recruiting a statistically sufficient number of patients for robust and adequately powered clinical trials, which are indispensable for demonstrating the safety and efficacy of new therapies
- The limited patient population of FAP, a rare genetic disorder, acts as a significant constraint on the U.S. treatment market, making it less attractive for large-scale pharmaceutical investment and complicating clinical trial recruitment
Familial Adenomatous Polyposis Treatment Market Scope
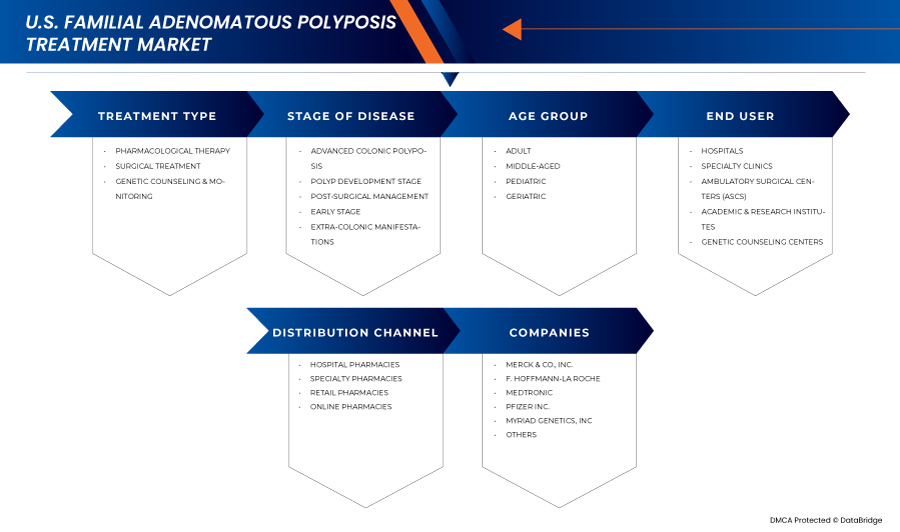
The market is segmented into five notable segments based on treatment type, stage of disease, age group, end user, and distribution channel.
- By Treatment Type
On the basis of treatment type, the U.S. familial adenomatous polyposis treatment market is segmented into pharmacological therapy, surgical treatment, and genetic counseling & monitoring. In 2025, pharmacological therapy segment is expected to dominate the market with a 40.55% owing to the growing emphasis on non-invasive disease management, expanded clinical use of NSAIDs and targeted agents, and increased accessibility to oral medications.
The surgical treatment segment is anticipated to witness the fastest growth rate of 4.8% from 2025 to 2032, due to the continued reliance on colectomy and related surgical interventions as the standard of care for moderate to advanced Familial Adenomatous Polyposis (FAP) cases.
- By Stage of Disease
On the basis of stage of disease, the U.S. familial adenomatous polyposis treatment market is segmented into advanced colonic polyposis, polyp development stage, post-surgical management, early stage, and extra-colonic manifestations. The advanced colonic polyposis segment held the largest market revenue share in 2025, driven by the increased need for immediate surgical or intensive pharmacological intervention in patients with a high polyp burden.
The advanced colonic polyposis segment is expected to witness the fastest CAGR from 2025 to 2032, driven by the increasing incidence of late-diagnosed FAP cases and the higher clinical urgency associated with advanced-stage polyp burden.
- By Age Group
On the basis of age group, the U.S. familial adenomatous polyposis treatment market is segmented into adult, middle-aged, pediatric, and geriatric. The adult segment held the largest market revenue share in 2025, driven by the high diagnostic prevalence of FAP in individuals between late adolescence and early adulthood. Many patients begin to develop polyps in their teenage years, with diagnosis and treatment often initiated in early adulthood.
The adult segment is expected to witness the fastest CAGR from 2025 to 2032, due to the rising diagnosis rates of Familial Adenomatous Polyposis (FAP) in individuals aged 19–55, coupled with increased participation in genetic screening programs and routine colonoscopic surveillance.
- By End User
On the basis of end user, the U.S. familial adenomatous polyposis treatment market is segmented into hospitals, specialty clinics, Ambulatory Surgical Centers (ASCs), academic & research institutes, and genetic counseling centers. The hospitals segment accounted for the largest market revenue share in 2025, driven by the integrated care services they provide, from genetic diagnostics and surgical treatment to long-term disease management.
The hospitals segment is expected to witness the fastest CAGR from 2025 to 2032, driven by the increasing number of FAP-related surgical procedures, enhanced access to advanced diagnostic tools, and the central role of hospitals in administering complex treatments such as colectomy and endoscopic polypectomy.
- By Distribution Channel
On the basis of distribution channel, the U.S. familial adenomatous polyposis treatment market is segmented into hospital pharmacies, specialty pharmacies, retail pharmacies, and online pharmacies. The hospital pharmacies segment accounted for the largest market revenue share in 2025, driven by the critical role hospitals play in dispensing medications during inpatient care and post-surgical treatment. Hospital pharmacies provide immediate access to pharmacological therapies, including NSAIDs, targeted therapies, and chemopreventive agents, which are essential for managing complex FAP cases.
The hospital pharmacies segment is expected to witness the fastest CAGR from 2025 to 2032, due to the growing administration of specialized and investigational FAP therapies that require controlled dispensing and close clinical supervision.
Familial Adenomatous Polyposis Treatment Market Share
The familial adenomatous polyposis treatment industry is primarily led by well-established companies, including:
- Pfizer Inc. (U.S.)
- F. Hoffmann-La Roche Ltd (Switzerland)
- Merck & Co., Inc. (U.S.)
- Medtronic (Ireland)
- Olympus Corporation (Japan)
- Ambry Genetics (U.S.)
- Invitae Corporation (U.S.)
- Boston Scientific Corporation (U.S.)
- Color Health, Inc. (U.S.)
- Emtora Biosciences (U.S.)
- Ethicon (Johnson and Johnson) (U.S.)
- Panbela Therapeutics, Inc. (U.S.)
- Recursion (U.S.)
- SLA Pharma (UK) Limited (U.K.)
- Takeda Pharmaceutical Company Limited (Japan)
- Myriad Genetics, Inc. (U.S.)
Latest Developments in Familial Adenomatous Polyposis Treatment Market
- In April 2025, Merck & Co., Inc. broke ground on a new USD 1 billion Biologics Center of Excellence in Wilmington, Delaware. This state-of-the-art facility is aimed at expanding Merck’s biologics manufacturing capabilities, supporting the development and production of innovative medicines, especially in oncology and immunology
- In June 2025, F. Hoffmann-La Roche Ltd announced a strategic collaboration with Broad Clinical Labs to accelerate the adoption of SBX sequencing technology, an advanced platform designed to enhance genomic profiling and precision diagnostics. This partnership aims to integrate Broad’s cutting-edge sequencing innovation with Roche’s global diagnostic expertise, potentially transforming cancer and rare disease diagnostics through faster, more accurate genetic insights
- In September 2024, Medtronic expanded its AiBLE spine surgery ecosystem by introducing advanced surgical technologies and deepening its strategic partnership with Siemens Healthineers. This development integrates AI-driven imaging and real-time navigation to enhance precision in spine procedures
- In June 2025, Pfizer entered into an exclusive global (ex-China) licensing agreement with 3SBio for SSGJ-707, a bispecific antibody targeting PD-1 and VEGF, showing early promise in cancers like non-small cell lung cancer and metastatic colorectal cancer. This deal includes rights for development, manufacturing, and commercialization outside China, with a USD 1.25 billion upfront payment and potential milestones up to USD 4.8 billion
- In February 2025, Myriad Genetics announced a strategic partnership with PathomIQ to integrate artificial intelligence (AI)-powered technology into its oncology portfolio. This collaboration aims to enhance Myriad's tumor profiling and molecular diagnostic capabilities by leveraging PathomIQ’s AI platform to deliver more precise, data-driven insights for cancer care. The impact of this development is expected to significantly improve diagnostic accuracy and personalized treatment planning for oncology patients
SKU-

- Interactive Data Analysis Dashboard
- Company Analysis Dashboard for high growth potential opportunities
- Research Analyst Access for customization & queries
- Competitor Analysis with Interactive dashboard
- Latest News, Updates & Trend analysis
- Harness the Power of Benchmark Analysis for Comprehensive Competitor Tracking
Table of Content
1 INTRODUCTION
1.1 OBJECTIVES OF THE STUDY
1.2 MARKET DEFINITION
1.3 OVERVIEW OF THE U.S. FAMILIAL ADENOMATOUS POLYPOSIS TREATMENT MARKET
1.4 CURRENCY AND PRICING
1.5 LIMITATIONS
1.6 MARKETS COVERED
2 MARKET SEGMENTATION
2.1 MARKETS COVERED
2.2 GEOGRAPHICAL SCOPE
2.3 YEARS CONSIDERED FOR THE STUDY
2.4 DBMR TRIPOD DATA VALIDATION MODEL
2.5 PRIMARY INTERVIEWS WITH KEY OPINION LEADERS
2.6 MULTIVARIATE MODELLING
2.7 DBMR MARKET POSITION GRID
2.8 SECONDARY SOURCES
2.9 ASSUMPTIONS
3 EXECUTIVE SUMMARY
4 PREMIUM INSIGHTS
4.1 PESTAL ANALYSIS
4.2 PORTERS FIVE FORCES ANALYSIS
4.3 PIPELINE ANALYSIS
4.4 INDUSTRY INSIGHTS
4.4.1 MICRO AND MACRO ECONOMIC FACTORS
4.4.2 PENETRATION AND GROWTH PROSPECT MAPPING
4.4.3 KEY PRICING STRATEGIES
4.4.4 STRATEGIC INSIGHTS & RECOMMENDATIONS:
4.5 EPIDEMIOLOGY
4.5.1 DRUG ADHERENCE AND THERAPY SWITCH MODEL
4.5.2 PATIENT TREATMENT SUCCESS RATES
4.6 MARKETED DRUG ANALYSIS
4.6.1 DRUGS
4.6.2 BRANDED DRUGS
4.6.3 GENERIC DRUGS
4.6.4 THERAPEUTIC INDICATION
4.6.5 PHARMACOLOGICAL CLASS OF THE DRUG
4.6.6 DRUG PRIMARY INDICATION
4.6.7 MARKET STATUS
4.6.8 MEDICATION TYPE
4.6.9 DRUG DOSAGE FORM
4.6.10 DOSAGE AVAILABILITY
4.6.11 PACKAGING TYPE
4.6.12 DRUG ROUTE OF ADMINISTRATION
4.6.13 DOSING FREQUENCY
4.6.14 DRUG INSIGHT
4.6.15 OVERVIEW OF DRUG DEVELOPMENT ACTIVITIES
4.6.16 REGULATORY MILESTONE, SAFETY DATA
4.6.17 EFFICACY DATA, MARKET EXCLUSIVITY DATA
4.6.18 CROSS COMPETITION
4.6.19 THERAPEUTIC PORTFOLIO
4.6.20 CURRENT DEVELOPMENT SCENARIO
4.7 IMPORT-EXPORT ANALYSIS
4.8 SUPPLY CHAIN ECOSYSTEM
4.8.1 PROMINENT COMPANIES
4.8.2 SMALL & MEDIUM SIZE COMPANIES
4.8.3 END USERS
5 HEALTHCARE TARIFFS IMPACT ANALYSIS
5.1 OVERVIEW
5.2 TARIFF STRUCTURES
5.3 PHARMACEUTICAL TARIFFS AND TRADE BARRIERS
5.3.1 IMPORT DUTIES ON PRESCRIPTION DRUGS VS. GENERICS
5.3.2 IMPACT ON DRUG AFFORDABILITY AND ACCESS
5.3.3 KEY TRADE AGREEMENTS AFFECTING PHARMACEUTICAL TARIFFS
5.4 IMPACT OF HEALTHCARE TARIFFS ON PROVIDERS AND PATIENTS
5.4.1 COST BURDEN ON HOSPITALS AND HEALTHCARE FACILITIES
5.4.2 EFFECT ON PATIENT AFFORDABILITY AND INSURANCE COVERAGE
5.4.3 TARIFFS AND THEIR ROLE IN MEDICAL TOURISM
5.5 TRADE AGREEMENTS AND HEALTHCARE TARIFFS
5.5.1 WTO REGULATIONS ON HEALTHCARE TARIFFS
5.5.2 IMPACT OF TRADE WARS ON THE HEALTHCARE SUPPLY CHAIN
5.5.3 ROLE OF FREE TRADE AGREEMENTS (FTAS) IN REDUCING TARIFFS
5.6 IMPACT OF TARIFFS ON HEALTHCARE COSTS AND ACCESSIBILITY
5.7 IMPORTANCE OF TARIFFS IN THE HEALTHCARE SECTOR
6 REGULATORY FRAMEWORK
6.1 REGULATORY APPROVAL PROCESS
6.2 GEOGRAPHIES’ EASE OF REGULATORY APPROVAL
6.3 REGULATORY APPROVAL PATHWAYS
6.4 LICENSING AND REGISTRATION
6.5 POST-MARKETING SURVEILLANCE
6.6 GOOD MANUFACTURING PRACTICES (GMPS) GUIDELINES
7 MARKET OVERVIEW
7.1 DRIVERS
7.1.1 RISING AWARENESS AND GENETIC COUNSELING
7.1.2 ADVANCEMENTS IN CHEMOPREVENTIVE THERAPIES
7.1.3 EARLY DIAGNOSIS OF RARE DISEASE
7.1.4 RISING HEALTHCARE SPENDING AND INVESTMENT IN RARE DISEASES
7.2 RESTRAINTS
7.2.1 LIMITED PATIENT POPULATION
7.2.2 HIGH COST OF TARGETED AND PREVENTIVE THERAPIES
7.3 OPPORTUNITIES
7.3.1 PIPELINE INNOVATION FOR NON-SURGICAL OPTIONS
7.3.2 EMERGING ROLE OF LIQUID BIOPSY AND SURVEILLANCE BIOMARKERS
7.3.3 IMPROVED GENETIC TESTING AND COUNSELING
7.4 CHALLENGES
7.4.1 DIFFICULTY IN RECRUITING FOR CLINICAL TRIALS
7.4.2 INTEGRATION OF CHALLENGES INTO ESTABLISHED SURGICAL PATHWAYS
8 U.S. FAMILIAL ADENOMATOUS POLYPOSIS TREATMENT MARKET, BY TREATMENT TYPE
8.1 OVERVIEW
8.2 PHARMACOLOGICAL THERAPY
8.3 SURGICAL TREATMENT
8.4 GENETIC COUNSELING & MONITORING
9 U.S. FAMILIAL ADENOMATOUS POLYPOSIS TREATMENT MARKET, BY STAGE OF DISEASE
9.1 OVERVIEW
9.2 ADVANCED COLONIC POLYPOSIS
9.3 POLYP DEVELOPMENT STAGE
9.4 POST-SURGICAL MANAGEMENT
9.5 EARLY STAGE
9.6 EXTRA-COLONIC MANIFESTATIONS
10 U.S. FAMILIAL ADENOMATOUS POLYPOSIS TREATMENT MARKET, BY AGE GROUP
10.1 OVERVIEW
10.2 ADULT
10.3 MIDDLE-AGED
10.4 PEDIATRIC
10.5 GERIATRIC
11 U.S. FAMILIAL ADENOMATOUS POLYPOSIS TREATMENT MARKET, BY END USER
11.1 OVERVIEW
11.2 HOSPITALS
11.3 SPECIALTY CLINICS
11.4 AMBULATORY SURGICAL CENTERS (ASCS)
11.5 ACADEMIC & RESEARCH INSTITUTES
11.6 GENETIC COUNSELING CENTERS
12 U.S. FAMILIAL ADENOMATOUS POLYPOSIS TREATMENT MARKET, BY DISTRIBUTION CHANNEL
12.1 OVERVIEW
12.2 HOSPITAL PHARMACIES
12.3 SPECIALTY PHARMACIES
12.4 RETAIL PHARMACIES
12.5 ONLINE PHARMACIES
13 U.S. FAMILIAL ADENOMATOUS POLYPOSIS TREATMENT MARKET: COMPANY LANDSCAPE
13.1 COMPANY SHARE ANALYSIS: U.S.
14 SWOT ANALYSIS
15 COMPANY PROFILES
15.1 MERCK & CO., INC.
15.1.1 COMPANY SNAPSHOT
15.1.2 REVENUE ANALYSIS
15.1.3 PRODUCT PORTFOLIO
15.1.4 RECENT DEVELOPMENT
15.2 F. HOFFMANN-LA ROCHE LTD
15.2.1 COMPANY SNAPSHOT
15.2.2 REVENUE ANALYSIS
15.2.3 SOLUTION PORTFOLIO
15.2.4 RECENT DEVELOPMENT
15.3 MEDTRONIC
15.3.1 COMPANY SNAPSHOT
15.3.2 REVENUE ANALYSIS
15.3.3 PRODUCT PORTFOLIO
15.3.4 RECENT DEVELOPMENT
15.4 PFIZER INC.
15.4.1 COMPANY SNAPSHOT
15.4.2 REVENUE ANALYSIS
15.4.3 PRODUCT PORTFOLIO
15.4.4 RECENT DEVELOPMENT
15.5 MYRIAD GENETICS, INC.
15.5.1 COMPANY SNAPSHOT
15.5.2 REVENUE ANALYSIS
15.5.3 PRODUCT PORTFOLIO
15.5.4 RECENT DEVELOPMENT
15.6 AMBRY GENETICS
15.6.1 COMPANY SNAPSHOT
15.6.2 PIPELINE PRODUCT PORTFOLIO
15.6.3 RECENT DEVELOPMENT
15.7 BOSTON SCIENTIFIC CORPORATION
15.7.1 COMPANY SNAPSHOT
15.7.2 REVENUE ANALYSIS
15.7.3 PRODUCT PORTFOLIO
15.7.4 RECENT DEVELOPMENTS
15.8 COLOR HEALTH, INC.
15.8.1 COMPANY SNAPSHOT
15.8.2 PIPELINE PRODUCT PORTFOLIO
15.8.3 RECENT DEVELOPMENT
15.9 EMTORA BIOSCIENCES
15.9.1 COMPANY SNAPSHOT
15.9.2 PIPELINE PRODUCT PORTFOLIO
15.9.3 RECENT DEVELOPMENT
15.1 ETHICON (JOHNSON AND JOHNSON)
15.10.1 COMPANY SNAPSHOT
15.10.2 PRODUCT PORTFOLIO
15.10.3 RECENT DEVELOPMENT
15.11 INVITAE CORPORATION
15.11.1 COMPANY SNAPSHOT
15.11.2 REVENUE ANALYSIS
15.11.3 PRODUCT PORTFOLIO
15.11.4 RECENT DEVELOPMENT
15.12 OLYMPUS CORPORATION
15.12.1 COMPANY SNAPSHOT
15.12.2 REVENUE ANALYSIS
15.12.3 PIPELINE PRODUCT PORTFOLIO
15.12.4 RECENT DEVELOPMENT
15.13 PANBELA THERAPEUTICS, INC.
15.13.1 COMPANY SNAPSHOT
15.13.2 PIPELINE PRODUCT PORTFOLIO
15.13.3 RECENT DEVELOPMENT
15.14 RECURSION
15.14.1 COMPANY SNAPSHOT
15.14.2 REVENUE ANALYSIS
15.14.3 PIPELINE PRODUCT PORTFOLIO
15.14.4 RECENT DEVELOPMENT
15.15 SLA PHARMA (UK) LIMITED
15.15.1 COMPANY SNAPSHOT
15.15.2 PIPELINE PRODUCT PORTFOLIO
15.15.3 RECENT DEVELOPMENT
15.16 TAKEDA PHARMACEUTICAL COMPANY LIMITED
15.16.1 COMPANY SNAPSHOT
15.16.2 REVENUE ANALYSIS
15.16.3 PIPELINE PRODUCT PORTFOLIO
15.16.4 RECENT DEVELOPMENT
16 QUESTIONNAIRE
17 RELATED REPORTS
List of Table
TABLE 1 PIPELINE PRODUCTS
TABLE 2 PENETRATION AND GROWTH PROSPECT MAPPING ANALYSIS
TABLE 3 AVAILABLE THERAPY AND ADHERENCE.
TABLE 4 PATIENT TREATMENT SUCCESS RATES
TABLE 5 AVAILABLE BRANDED DRUGS
TABLE 6 AVAILABLE DRUG CLASSES
TABLE 7 MARKET STATUS
TABLE 8 DRUG DOSAGE FORM
TABLE 9 DOSING FREQUENCY
TABLE 10 CROSS COMPETITION
TABLE 11 IMPORT ANALYSIS
TABLE 12 EXPORT ANALYSIS
TABLE 13 U.S. FAMILIAL ADENOMATOUS POLYPOSIS TREATMENT MARKET, BY TREATMENT TYPE, 2018-2032 (USD MILLION)
TABLE 14 U.S. PHARMACOLOGICAL THERAPY IN FAMILIAL ADENOMATOUS POLYPOSIS TREATMENT MARKET, BY TYPE, 2018-2032 (USD MILLION)
TABLE 15 U.S. NSAIDS IN FAMILIAL ADENOMATOUS POLYPOSIS TREATMENT MARKET, BY TYPE, 2018-2032 (USD MILLION)
TABLE 16 U.S. TARGETED THERAPY IN FAMILIAL ADENOMATOUS POLYPOSIS TREATMENT MARKET, BY TYPE, 2018-2032 (USD MILLION)
TABLE 17 U.S. CHEMOPREVENTIVE AGENTS IN FAMILIAL ADENOMATOUS POLYPOSIS TREATMENT MARKET, BY TYPE, 2018-2032 (USD MILLION)
TABLE 18 U.S. EXPERIMENTAL/INVESTIGATIONAL DRUGS IN FAMILIAL ADENOMATOUS POLYPOSIS TREATMENT MARKET, BY TYPE, 2018-2032 (USD MILLION)
TABLE 19 U.S. PHARMACOLOGICAL THERAPY IN FAMILIAL ADENOMATOUS POLYPOSIS TREATMENT MARKET, BY DRUG CLASS, 2018-2032 (USD MILLION)
TABLE 20 U.S. PHARMACOLOGICAL THERAPY IN FAMILIAL ADENOMATOUS POLYPOSIS TREATMENT MARKET, BY ROUTE OF ADMINISTRATION, 2018-2032 (USD MILLION)
TABLE 21 U.S. ORAL IN FAMILIAL ADENOMATOUS POLYPOSIS TREATMENT MARKET, BY TYPE, 2018-2032 (USD MILLION)
TABLE 22 U.S. SURGICAL TREATMENT IN FAMILIAL ADENOMATOUS POLYPOSIS TREATMENT MARKET, BY TYPE, 2018-2032 (USD MILLION)
TABLE 23 U.S. COLECTOMY IN FAMILIAL ADENOMATOUS POLYPOSIS TREATMENT MARKET, BY TYPE, 2018-2032 (USD MILLION)
TABLE 24 U.S. ENDOSCOPIC POLYPECTOMY IN FAMILIAL ADENOMATOUS POLYPOSIS TREATMENT MARKET, BY TYPE, 2018-2032 (USD MILLION)
TABLE 25 U.S. GENETIC COUNSELING & MONITORING IN FAMILIAL ADENOMATOUS POLYPOSIS TREATMENT MARKET, BY TYPE, 2018-2032 (USD MILLION)
TABLE 26 U.S. SURVEILLANCE COLONOSCOPY IN FAMILIAL ADENOMATOUS POLYPOSIS TREATMENT MARKET, BY TYPE, 2018-2032 (USD MILLION)
TABLE 27 U.S. FAMILIAL ADENOMATOUS POLYPOSIS TREATMENT MARKET, BY STAGE OF DISEASE, 2018-2032 (USD MILLION)
TABLE 28 U.S. EXTRA-COLONIC MANIFESTATIONS IN FAMILIAL ADENOMATOUS POLYPOSIS TREATMENT MARKET, BY TYPE, 2018-2032 (USD MILLION)
TABLE 29 U.S. FAMILIAL ADENOMATOUS POLYPOSIS TREATMENT MARKET, BY AGE GROUP, 2018-2032 (USD MILLION)
TABLE 30 U.S. FAMILIAL ADENOMATOUS POLYPOSIS TREATMENT MARKET, BY END USER, 2018-2032 (USD MILLION)
TABLE 31 U.S. HOSPITALS IN FAMILIAL ADENOMATOUS POLYPOSIS TREATMENT MARKET, BY TYPE, 2018-2032 (USD MILLION)
TABLE 32 U.S. SPECIALTY CLINICS IN FAMILIAL ADENOMATOUS POLYPOSIS TREATMENT MARKET, BY TYPE, 2018-2032 (USD MILLION)
TABLE 33 U.S. FAMILIAL ADENOMATOUS POLYPOSIS TREATMENT MARKET, BY DISTRIBUTION CHANNEL, 2018-2032 (USD MILLION)
List of Figure
FIGURE 1 U.S. FAMILIAL ADENOMATOUS POLYPOSIS TREATMENT MARKET: SEGMENTATION
FIGURE 2 U.S. FAMILIAL ADENOMATOUS POLYPOSIS TREATMENT MARKET: DATA TRIANGULATION
FIGURE 3 U.S. FAMILIAL ADENOMATOUS POLYPOSIS TREATMENT MARKET: DROC ANALYSIS
FIGURE 4 U.S. FAMILIAL ADENOMATOUS POLYPOSIS TREATMENT MARKET: COUNTRY-WISE MARKET ANALYSIS
FIGURE 5 U.S. FAMILIAL ADENOMATOUS POLYPOSIS TREATMENT MARKET: COMPANY RESEARCH ANALYSIS
FIGURE 6 U.S. FAMILIAL ADENOMATOUS POLYPOSIS TREATMENT MARKET: INTERVIEW DEMOGRAPHICS
FIGURE 7 U.S. FAMILIAL ADENOMATOUS POLYPOSIS TREATMENT MARKET: MULTIVARIATE MODELLING
FIGURE 8 U.S. FAMILIAL ADENOMATOUS POLYPOSIS TREATMENT MARKET: DBMR MARKET POSITION GRID
FIGURE 9 EXECUTIVE SUMMARY
FIGURE 10 THREE SEGMENTS COMPRISE THE U.S. FAMILIAL ADENOMATOUS POLYPOSIS TREATMENT MARKET, BY TREATMENT TYPE (2024)
FIGURE 11 STRATEGIC DECISIONS
FIGURE 12 U.S. FAMILIAL ADENOMATOUS POLYPOSIS TREATMENT MARKET: SEGMENTATION
FIGURE 13 RISING AWARENESS AND GENETIC COUNSELING IS DRIVING THE GROWTH OF THE U.S. FAMILIAL ADENOMATOUS POLYPOSIS TREATMENT MARKET FROM 2025 TO 2032
FIGURE 14 PHARMACOLOGICAL THERAPY SEGMENT IS EXPECTED TO ACCOUNT FOR THE LARGEST SHARE OF THE U.S. FAMILIAL ADENOMATOUS POLYPOSIS TREATMENT MARKET IN 2025 AND 2032
FIGURE 15 PESTLE ANALYSIS
FIGURE 16 PORTERS FIVE FORCES MODEL
FIGURE 17 DRIVERS, RESTRAINTS, OPPORTUNITIES, AND CHALLENGES OF THE U.S. FAMILIAL ADENOMATOUS POLYPOSIS TREATMENT MARKET
FIGURE 18 U.S. FAMILIAL ADENOMATOUS POLYPOSIS TREATMENT MARKET: BY TREATMENT TYPE, 2024
FIGURE 19 U.S. FAMILIAL ADENOMATOUS POLYPOSIS TREATMENT MARKET: BY TREATMENT TYPE, 2018-2032 (USD MILLION)
FIGURE 20 U.S. FAMILIAL ADENOMATOUS POLYPOSIS TREATMENT MARKET: BY TREATMENT TYPE, CAGR (2025-2032)
FIGURE 21 U.S. FAMILIAL ADENOMATOUS POLYPOSIS TREATMENT MARKET: BY TREATMENT TYPE, LIFELINE CURVE
FIGURE 22 U.S. FAMILIAL ADENOMATOUS POLYPOSIS TREATMENT MARKET: BY STAGE OF DISEASE, 2024
FIGURE 23 U.S. FAMILIAL ADENOMATOUS POLYPOSIS TREATMENT MARKET: BY STAGE OF DISEASE, 2018-2032 (USD MILLION)
FIGURE 24 U.S. FAMILIAL ADENOMATOUS POLYPOSIS TREATMENT MARKET: BY STAGE OF DISEASE, CAGR (2025-2032)
FIGURE 25 U.S. FAMILIAL ADENOMATOUS POLYPOSIS TREATMENT MARKET: BY STAGE OF DISEASE, LIFELINE CURVE
FIGURE 26 U.S. FAMILIAL ADENOMATOUS POLYPOSIS TREATMENT MARKET: BY AGE GROUP, 2024
FIGURE 27 U.S. FAMILIAL ADENOMATOUS POLYPOSIS TREATMENT MARKET: BY AGE GROUP, 2018-2032 (USD MILLION)
FIGURE 28 U.S. FAMILIAL ADENOMATOUS POLYPOSIS TREATMENT MARKET: BY AGE GROUP, CAGR (2025-2032)
FIGURE 29 U.S. FAMILIAL ADENOMATOUS POLYPOSIS TREATMENT MARKET: BY AGE GROUP, LIFELINE CURVE
FIGURE 30 U.S. FAMILIAL ADENOMATOUS POLYPOSIS TREATMENT MARKET: BY END USER, 2024
FIGURE 31 U.S. FAMILIAL ADENOMATOUS POLYPOSIS TREATMENT MARKET: BY END USER, 2018-2032 (USD MILLION)
FIGURE 32 U.S. FAMILIAL ADENOMATOUS POLYPOSIS TREATMENT MARKET: BY END USER, CAGR (2025-2032)
FIGURE 33 U.S. FAMILIAL ADENOMATOUS POLYPOSIS TREATMENT MARKET: BY END USER, LIFELINE CURVE
FIGURE 34 U.S. FAMILIAL ADENOMATOUS POLYPOSIS TREATMENT MARKET: BY DISTRIBUTION CHANNEL, 2024
FIGURE 35 U.S. FAMILIAL ADENOMATOUS POLYPOSIS TREATMENT MARKET: BY DISTRIBUTION CHANNEL, 2018-2032 (USD MILLION)
FIGURE 36 U.S. FAMILIAL ADENOMATOUS POLYPOSIS TREATMENT MARKET: BY DISTRIBUTION CHANNEL, CAGR (2025-2032)
FIGURE 37 U.S. FAMILIAL ADENOMATOUS POLYPOSIS TREATMENT MARKET: BY DISTRIBUTION CHANNEL, LIFELINE CURVE
FIGURE 38 U.S. FAMILIAL ADENOMATOUS POLYPOSIS TREATMENT MARKET: COMPANY SHARE 2024 (%)
Data collection and base year analysis are done using data collection modules with large sample sizes. The stage includes obtaining market information or related data through various sources and strategies. It includes examining and planning all the data acquired from the past in advance. It likewise envelops the examination of information inconsistencies seen across different information sources. The market data is analysed and estimated using market statistical and coherent models. Also, market share analysis and key trend analysis are the major success factors in the market report. To know more, please request an analyst call or drop down your inquiry.
The key research methodology used by DBMR research team is data triangulation which involves data mining, analysis of the impact of data variables on the market and primary (industry expert) validation. Data models include Vendor Positioning Grid, Market Time Line Analysis, Market Overview and Guide, Company Positioning Grid, Patent Analysis, Pricing Analysis, Company Market Share Analysis, Standards of Measurement, Global versus Regional and Vendor Share Analysis. To know more about the research methodology, drop in an inquiry to speak to our industry experts.
Data Bridge Market Research is a leader in advanced formative research. We take pride in servicing our existing and new customers with data and analysis that match and suits their goal. The report can be customized to include price trend analysis of target brands understanding the market for additional countries (ask for the list of countries), clinical trial results data, literature review, refurbished market and product base analysis. Market analysis of target competitors can be analyzed from technology-based analysis to market portfolio strategies. We can add as many competitors that you require data about in the format and data style you are looking for. Our team of analysts can also provide you data in crude raw excel files pivot tables (Fact book) or can assist you in creating presentations from the data sets available in the report.


