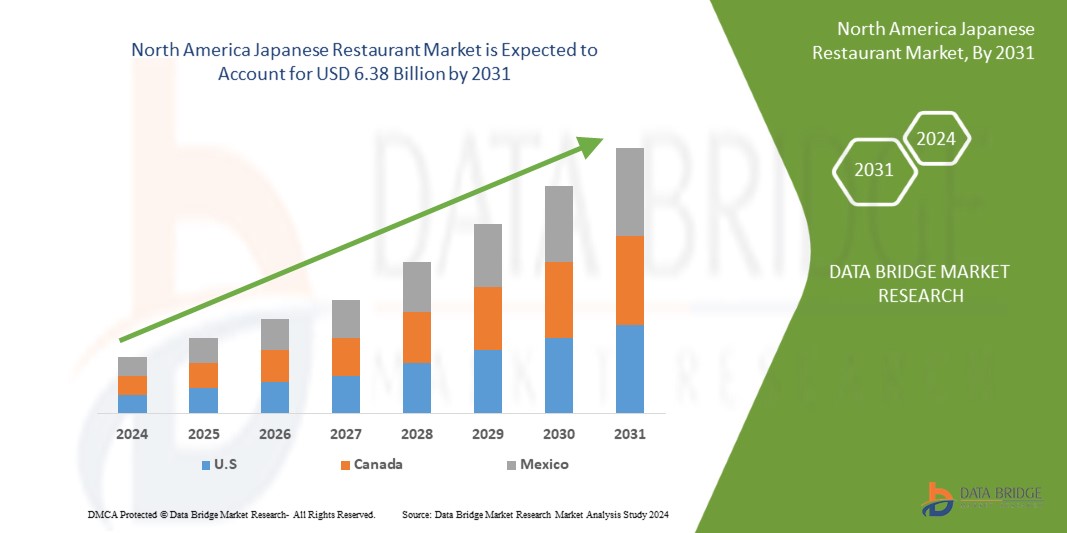
North America Japanese Restaurant Market
Marktgröße in Milliarden USD
CAGR :
% 
 USD
5.11 Billion
USD
6.59 Billion
2024
2032
USD
5.11 Billion
USD
6.59 Billion
2024
2032
| 2025 –2032 | |
| USD 5.11 Billion | |
| USD 6.59 Billion | |
| % | |
North America Japanese Restaurant Market Segmentation, By Cuisine Type(Traditional Japanese Cuisine, Specialty Japanese Cuisine, and Modern Japanese Cuisine), Service Type (Quick Service Restaurants (QSR), Full Service Restaurants, and Take-Out Counters/Outlets), Restaurant Category (Standalone Restaurants and Chain/Franchise Model), Restaurant Model (Takeaway, Home Delivery, and Dine-In), Sales Channel (Physical Outlets and Delivery Online Restaurants/Ghost Kitchen) - Industry Trends and Forecast to 2031
North America Japanese Restaurant Market Analysis
Increasing awareness of health benefits related to Japanese food is driving the market growth. Innovation in menu offerings provides opportunities in the market. Moreover, increase in popularity of the dish sushi is driving market growth.
North America Japanese Restaurant Market Size
The North America market is expected to reach USD 6.38 billion by 2031 from USD 4.97 billion in 2023, growing with a substantial CAGR of 3.23% in the forecast period of 2024 to 2031.
North America Market Trends
“Increasing Awareness of Health Benefits Related to Japanese Food Drives the North America Japanese Restaurant Market”
The North America Japanese restaurant market is experiencing significant growth, driven by the increasing awareness of the health benefits associated with Japanese cuisine. Japanese cuisine, renowned for its emphasis on fresh, high-quality ingredients and balanced nutrition, aligns well with the growing North America focus on health and wellness. Traditional dishes such as sushi, sashimi, and miso soup are not only flavorful but also low in fat and high in essential nutrients. Sushi, for example, features lean proteins like fish and nutrient-rich vegetables, while miso soup provides probiotics beneficial for digestive health. The health benefits of these foods are becoming more widely recognized, leading to a surge in consumer interest. The growing awareness of Japanese cuisine's health benefits also contributes to its appeal in diverse markets. Consumers in various regions are exploring Japanese food not only for its taste but also for its positive impact on overall health. This shift is particularly evident in regions where there is a rising trend of health-oriented eating habits, such as North America and Europe. Japanese restaurants in these areas are seeing increased patronage as they cater to the demand for healthier dining options.
As more people become health-conscious, they are increasingly seeking out dining options that align with their wellness goals. Japanese restaurants are capitalizing on this trend by highlighting the nutritional advantages of their menus. Many establishments like Sushi Gen Enterprises, Sushi Nozawa Group RE&S and others now emphasize their use of fresh, natural ingredients and traditional cooking methods that retain the maximum nutritional value of the food. This focus on health is not just limited to traditional dishes but extends to modern interpretations and fusion cuisines that integrate Japanese principles with other healthy culinary traditions.
Report Scope and Market Segmentation
|
Attributes |
North America Key Market Insights |
|
Segmentation |
By Cuisine Type: Traditional Japanese Cuisine, Specialty Japanese Cuisine, and Modern Japanese Cuisine By Service Type: Quick Service Restaurants (QSR), Full Service Restaurants, and Take-Out Counters/Outlets By Restaurant Category: Standalone Restaurants and Chain/Franchise Model By Restaurant Model: Takeaway, Home Delivery, and Dine-In By Sales Channel: Physical Outlets and Delivery Online Restaurants/Ghost Kitchen |
|
Countries Covered |
U.S., Canada and Mexico |
|
Key Market Players |
Katsu-Ya Group, Inc (U.S.), Wokcano Asian Restaurant & Bar.(U.S.), 893 Ryōtei Berlin (Germany), Chiba Japanese Restaurant (U.S.), Tsujita Artisan Noodle (Japan), Sushi Den (U.S.), Florilège (Japan), Kaiten Zushi (U.S.), Kura Sushi USA (U.S.), Narisawa (Japan), RE&S (Singapore), Sazenka (Japan), Sushi A Go (U.S.), Sushi Gen Enterprises (U.S.), Sushi Nozawa Group (U.S.), Sushiya (India), Takami Sushi & Robata Restaurant (U.S.), Tatsu Ramen LLC (U.S.), Yamashiro Hollywood (U.S.), among others |
|
Market Opportunities |
|
|
Value Added Data Infosets |
In addition to the insights on market scenarios such as market value, growth rate, segmentation, geographical coverage, and major players, the market reports curated by the Data Bridge Market Research also include in-depth expert analysis, pricing analysis, brand share analysis, consumer survey, demography analysis, supply chain analysis, value chain analysis, raw material/consumables overview, vendor selection criteria, PESTLE Analysis, Porter Analysis, and regulatory framework. |
Japanese Restaurant Market Definition
A Japanese restaurant is an establishment that specializes in serving traditional Japanese cuisine, characterized by its emphasis on fresh, high-quality ingredients and meticulous preparation techniques. The menu typically features a variety of dishes, including sushi, sashimi, tempura, ramen, and other items that reflect Japan's diverse culinary heritage. Japanese restaurants often prioritize authenticity, incorporating traditional cooking methods and presentation styles, such as sushi rolls and bento boxes, to deliver a genuine dining experience. The ambiance of these restaurants often reflects Japanese aesthetics, with a focus on simplicity, elegance, and attention to detail. Service in Japanese restaurants is generally attentive and respectful, aiming to enhance the overall dining experience. In recent years, many Japanese restaurants have also embraced modern innovations, such as online ordering and sustainable practices, to meet the evolving preferences of North America consumers.
Japanese Restaurant Market Dynamics
Drivers
- The Increase in Popularity of the Dish Sushi
The rising popularity of sushi is a significant factors for the North America Japanese restaurant market, influencing consumer preferences and expanding market reach. Sushi, a staple of Japanese cuisine, has experienced a surge in North America popularity due to its alignment with health trends, versatility, and integration into mainstream food culture. One of the primary factors driving this trend is sushi’s reputation as a healthy and convenient food option. With its emphasis on fresh fish, vegetables, and rice, sushi is often perceived as a nutritious choice. The growing awareness of health and wellness has led many consumers to seek out healthier alternatives to traditional fast food. Sushi’s low-calorie, high-protein, and omega-3-rich profile aligns well with these dietary preferences, making it an attractive option for health-conscious diners. As a result, sushi has become an essential in many diets around the world, driving increased demand for Japanese restaurants. Along with it the rise of sushi's popularity is also supported by its versatility and adaptability. Sushi can be customized to suit various tastes and dietary needs, including vegetarian and gluten-free options. This flexibility allows sushi to cater to a wide range of consumer preferences, further enhancing its appeal. The introduction of innovative sushi rolls and fusion creations has also helped to attract a diverse audience, from traditionalists to those seeking novel culinary experiences. This adaptability has facilitated the expansion of sushi offerings in both traditional Japanese restaurants and new, contemporary dining establishments. In addition the mainstream acceptance of sushi has also played a crucial role in its market influence. Sushi has become a common fixture in cities around the world, from New York and London to Sydney and Tokyo. Its presence in popular media, including television shows, social media, and food blogs, has elevated sushi to a prominent position in North America food culture. This increased visibility has led to a broader acceptance of sushi as a mainstream dining option, attracting customers who may not have previously considered Japanese cuisine.
For Instance,
- In 2024, according to World Metrics, the North America sushi market has experienced substantial growth, with the industry valued at over USD 27 billion. This surge highlights the increasing popularity of sushi, driving a significant rise in the number of Japanese restaurants and contributing to the expansion of Japanese dining experiences worldwide
The Recognition of Japanese Cuisine as a UNESCO Intangible Cultural Heritage
The designation of Japanese cuisine as a UNESCO intangible cultural heritage highlights its traditional practices, unique preparation methods, and cultural significance. This acknowledgment not only elevates the profile of Japanese food but also generates heightened North America interest. Consumers are increasingly drawn to Japanese cuisine due to its rich history, authenticity, and the craftsmanship associated with its preparation. As a result, there is a growing demand for authentic Japanese dining experiences, which directly benefits Japanese restaurants worldwide.
The UNESCO recognition also enhances the North America appeal of Japanese cuisine by positioning it as a symbol of cultural sophistication and culinary excellence. This status attracts food enthusiasts and cultural tourists who seek to experience the authentic flavors and traditional techniques that are now internationally celebrated. Japanese restaurants, therefore, benefit from increased foot traffic and consumer interest driven by this prestigious endorsement. Furthermore, the North America focus on preserving intangible cultural heritage aligns with broader trends in cultural tourism and experiential dining. As travelers become more interested in immersing themselves in local traditions and cultural practices, Japanese cuisine’s UNESCO status makes it a compelling choice. Restaurants that offer traditional Japanese dishes and emphasize their heritage connection are likely to attract both international tourists and local consumers who are eager to engage with culturally significant culinary experiences.
For instance,
- In February 2024, according to an article published by the Star Advertiser, the North America interest in Japan’s traditional cuisine, recognized as a UNESCO intangible cultural heritage, continues to rise. The recognition of Japanese cuisine by UNESCO enhances its prestige and appeal, encouraging more diners to explore and appreciate its cultural and historical significance, which in turn fuels the growth and popularity of Japanese dining establishments across the globe
Opportunities
- Innovation in Menu Offerings
Innovation in menu offerings presents a significant opportunity for the North America Japanese restaurant market, possessing growth and capturing new customer segments. As the dining landscape evolves, Japanese restaurants have the chance to differentiate themselves by embracing creative and diverse menu options that appeal to modern consumers. One of the key opportunities lies in the adaptation of traditional Japanese dishes to contemporary tastes and dietary preferences. For example sushi, traditionally consisting of raw fish and rice, has evolved to include a variety of ingredients and styles, such as vegetarian rolls, fusion creations, and even sushi burritos. This innovation allows Japanese restaurants to cater to a broader audience, including those with dietary restrictions or a preference for unique flavor combinations. By offering diverse and inventive menu items, restaurants can attract a wider range of customers and increase their market appeal.
Another opportunity for menu innovation is the integration of North America culinary trends with Japanese cuisine. Japanese restaurants are increasingly incorporating elements from other culinary traditions, resulting in exciting new dishes that blend flavors and techniques. For instance the fusion of Japanese and Mediterranean ingredients can create unique dishes like sushi with hummus or miso-glazed lamb. These cross-cultural innovations not only attract adventurous eaters but also position Japanese restaurants as trendsetters in the North America dining scene.
For instance,
- In 2018, according to the Economic Times, the Japanese restaurant market saw significant innovation with the introduction of sushi doughnuts and sushi burritos. These novel creations, which blend traditional sushi ingredients with new formats, such as a doughnut-shaped sushi or a burrito-style wrap, reflect a growing trend towards inventive menu offerings
Collaboration With Local Cultural Events and Festivals
Collaboration with local cultural events and festivals represents a significant opportunity for the North America Japanese restaurant market, fostering growth and expanding market reach. These collaborations allow Japanese restaurants to enhance their visibility, engage with diverse audiences, and strengthen their brand presence in both established and emerging markets.
Participating in cultural events and festivals enables Japanese restaurants to introduce their cuisine to new customer segments. Events such as food festivals, cultural fairs, and community celebrations attract large and varied audiences, providing a platform for restaurants to showcase their offerings. For instance, a Japanese restaurant setting up a booth at a multicultural food festival can reach attendees who may be unfamiliar with Japanese cuisine. By offering sample dishes or special event menus, restaurants can attract potential customers, generate interest, and encourage them to visit the restaurant for a full dining experience. These collaborations help Japanese restaurants build brand recognition and establish a positive reputation within the community. When restaurants align themselves with popular local events, they benefit from the event's promotional efforts, including marketing materials, social media mentions, and local media coverage. This association can boost the restaurant's visibility and credibility, leading to increased interest and foot traffic. For instance, a Japanese restaurant partnering with a prominent local cultural festival may be featured in event advertisements and receive mentions in local news outlets, boosting its profile among potential diners.
Restraints/Challenges
- High Cost of Ingredients for Japanese Cuisine
Japanese cuisine, known for its emphasis on fresh and high-quality ingredients, often relies on specialized items such as premium-grade sushi-grade fish, rare vegetables, and imported condiments. Such as, ingredients like bluefin tuna, used in high-end sushi, and seasonal items such as Matsutake mushrooms, are not only expensive but also subject to fluctuations in availability and price. The high cost of these ingredients impacts the overall cost structure of Japanese restaurants, leading to increased menu prices and potentially reduced consumer demand. The high costs of ingredients can particularly strain smaller or independent Japanese restaurants. These establishments may struggle to absorb the cost increases without significantly raising menu prices, which could discourage budget-conscious customers. Additionally, the volatility in ingredient prices can lead to inconsistent menu pricing and availability. For instance, fluctuations in the North America market for seafood due to overfishing, environmental changes, or supply chain disruptions can cause sudden increases in costs.
The impact of high ingredient costs extends beyond the restaurant level to affect consumer perceptions and behavior. When menu prices rise due to increased ingredient costs, consumers may perceive the restaurant as less affordable or value-for-money. This perception can lead to decreased support and lower overall sales. Moreover, the high cost of authentic Japanese ingredients can limit the ability of restaurants to offer a diverse menu, potentially reducing their appeal to a broader audience.
- Intense Competition from Italian and Chinese Cuisine
The North America Japanese restaurant market faces significant challenges due to intense competition from Italian and Chinese cuisines. Both Italian and Chinese dining options are deeply entrenched in North America food culture, presenting formidable rivals to Japanese restaurants as they vie for consumer attention and market share. One primary challenge is the saturation of Italian and Chinese cuisines in the North America dining market. Italian cuisine, with its diverse range of dishes such as pasta, pizza, and risotto, and Chinese cuisine, known for its extensive variety including dim sum, noodles, and stir-fries, are widely available and deeply entrenched in many countries. This widespread availability creates a high level of competition for Japanese restaurants, which must differentiate
themselves to capture consumer interest. The prevalence of these cuisines means that Japanese restaurants face the difficulty of standing out in a crowded market where familiar and popular options dominate.
Along with it, the cost of entry and operational challenges associated with maintaining a Japanese restaurant can be significant challenge. Italian and Chinese restaurants often benefit from economies of scale due to their larger presence and established supply chains. In contrast, Japanese restaurants may face higher costs for sourcing authentic ingredients and specialized equipment, which can impact their pricing and profitability. For instance, high-quality sushi-grade fish and premium soy sauces are expensive and require careful handling which may increases operational costs. This disparity in operational efficiency can make it difficult for Japanese
restaurants to compete on price, especially in markets where cost is a key consideration for consumers.
Impact and Current Market Scenario of Raw Material Shortage and Shipping Delays
Data Bridge Market Research offers a high-level analysis of the market and delivers information by keeping in account the impact and current market environment of raw material shortage and shipping delays. This translates into assessing strategic possibilities, creating effective action plans, and assisting businesses in making important decisions.
Apart from the standard report, we also offer in-depth analysis of the procurement level from forecasted shipping delays, distributor mapping by region, commodity analysis, production analysis, price mapping trends, sourcing, category performance analysis, supply chain risk management solutions, advanced benchmarking, and other services for procurement and strategic support.
Expected Impact of Economic Slowdown on the Pricing and Availability of Products
Wenn die Wirtschaftstätigkeit nachlässt, leiden auch die Branchen darunter. Die prognostizierten Auswirkungen des Konjunkturabschwungs auf die Preisgestaltung und Verfügbarkeit der Produkte werden in den von DBMR bereitgestellten Markteinblickberichten und Informationsdiensten berücksichtigt. Damit sind unsere Kunden ihren Konkurrenten in der Regel immer einen Schritt voraus, können ihre Umsätze und Erträge prognostizieren und ihre Gewinn- und Verlustaufwendungen abschätzen.
Marktumfang Nordamerika
Der Markt ist in fünf bemerkenswerte Segmente unterteilt, basierend auf Küchenart, Serviceart, Restaurantkategorie, Restaurantmodell und Vertriebskanal. Das Wachstum in diesen Segmenten hilft Ihnen bei der Analyse von dürftigen Wachstumssegmenten in den Branchen und bietet den Benutzern einen wertvollen Marktüberblick und Markteinblicke, die ihnen dabei helfen, strategische Entscheidungen zur Identifizierung der wichtigsten Marktanwendungen zu treffen.
Regionale Analyse des nordamerikanischen Marktes
Der Markt ist basierend auf Küchenart, Serviceart, Restaurantkategorie, Restaurantmodell und Vertriebskanal in fünf wichtige Segmente unterteilt .
Die vom Markt abgedeckten Länder sind die USA, Kanada und Mexiko.
Die USA dominieren den Markt aufgrund ihrer gut ausgebauten Infrastruktur und fortschrittlichen Verarbeitungstechnologie. Es wird erwartet, dass die im Vergleich zu anderen Regionen höheren Investitionen in diesem Sektor das Marktwachstum weiter ankurbeln werden.
Der Länderteil des Berichts enthält auch individuelle marktbeeinflussende Faktoren und Änderungen der Regulierung auf dem Inlandsmarkt, die sich auf die aktuellen und zukünftigen Trends des Marktes auswirken. Datenpunkte wie Downstream- und Upstream-Wertschöpfungskettenanalysen, technische Trends und Porters Fünf-Kräfte-Analyse sowie Fallstudien sind einige der Hinweise, die zur Prognose des Marktszenarios für einzelne Länder verwendet werden. Auch die Präsenz und Verfügbarkeit nordamerikanischer Marken und ihre Herausforderungen aufgrund großer oder geringer Konkurrenz durch lokale und inländische Marken, im
Traditionelle japanische Küche
- Traditionelle japanische Küche, nach Küchenart
- Sushi
- Sushi, nach Art
- Fließband
- Ohne Förderband
- Sushi, nach Kette
- Lokale Restaurants
- Internationale Kette
- Sushi, nach Einrichtung
- Schnell-Service
- Full-Service-Restaurants
- Take-Away-Theken/Verkaufsstellen
- Sushi, nach Art
- Ramen
- Ramen, von Restaurant Mode
- Wegbringen
- Lieferung nach Hause
- Im Restaurant essen
- Ramen, nach Einrichtung
- Schnell-Service
- Full-Service-Restaurants
- Take-Away-Theken/Verkaufsstellen
- Ramen, von Restaurant Mode
- Tempura
- Tempura, von Restaurant Mode
- Wegbringen
- Lieferung nach Hause
- Im Restaurant essen
- Tempura, nach Einrichtung
- Schnell-Service
- Full-Service-Restaurants
- Take-Away-Theken/Verkaufsstellen
- Tempura, von Restaurant Mode
- Sashimi
- Sashimi, von Restaurant Mode
- Wegbringen
- Lieferung nach Hause
- Im Restaurant essen
- Sashimi, nach Einrichtung
- Schnell-Service
- Full-Service-Restaurants
- Take-Away-Theken/Verkaufsstellen
- Sashimi, von Restaurant Mode
- Kaiseki
- Kaiseki, von Restaurant Mode
- Wegbringen
- Lieferung nach Hause
- Im Restaurant essen
- Kaiseki, nach Einrichtung
- Schnell-Service
- Full-Service-Restaurants
- Take-Away-Theken/Verkaufsstellen
- Kaiseki, von Restaurant Mode
- Udon/Soba
- Udon/Soba, von Restaurant Mode
- Wegbringen
- Lieferung nach Hause
- Im Restaurant essen
- Udon/Soba, nach Betrieb
- Schnell-Service
- Full-Service-Restaurants
- Take-Away-Theken/Verkaufsstellen
- Udon/Soba, von Restaurant Mode
- Sonstiges
- Andere, nach Restaurantmodus
- Wegbringen
- Lieferung nach Hause
- Im Restaurant essen
- Andere, nach Einrichtung
- Schnell-Service
- Full-Service-Restaurants
- Take-Away-Theken/Verkaufsstellen
- Andere, nach Restaurantmodus
- Sushi
Spezialitäten der japanischen Küche
- Spezialitäten der japanischen Küche, nach Art
- Yakitori
- Teppanyaki
- Sonstiges
- Spezialitäten der japanischen Küche, nach Restaurant Mode
- Wegbringen
- Lieferung nach Hause
- Im Restaurant essen
- Spezialitäten der japanischen Küche, nach Restaurant Mode
- Schnell-Service
- Full-Service-Restaurants
- Take-Away-Theken/Verkaufsstellen
- Moderne japanische Küche
- Moderne japanische Küche, nach Art
- Japanische Fusion-Küche
- Zeitgenössische japanische Gerichte
- Moderne japanische Küche, nach Art
- Moderne japanische Küche, von Restaurant Mode
- Wegbringen
- Lieferung nach Hause
- Im Restaurant essen
- Moderne japanische Küche, nach Einrichtung
- Schnell-Service
- Full-Service-Restaurants
- Take-Away-Theken/Verkaufsstellen
Diensttyp
- Schnellrestaurants (QSR)
- Full-Service-Restaurants
- Take-Away-Theken/Verkaufsstellen
Restaurantkategorie
- Eigenständige Restaurants
- Ketten-/Franchise-Modell
Restaurantmodell
- Wegbringen
- Lieferung nach Hause
- Im Restaurant essen
Vertriebskanal
- Physische Verkaufsstellen
- Online-Lieferservice für Restaurants/Ghost Kitchen
Bei der Prognoseanalyse der Länderdaten werden Aspekte der Inlandszölle und Handelsrouten berücksichtigt.
Marktanteil japanischer Restaurants in Nordamerika
Die Wettbewerbslandschaft des Marktes liefert Einzelheiten zu den Wettbewerbern. Zu den enthaltenen Einzelheiten gehören Unternehmensübersicht, Unternehmensfinanzen, erzielter Umsatz, Marktpotenzial, Investitionen in Forschung und Entwicklung, neue Marktinitiativen, Präsenz in Nordamerika, Produktionsstandorte und -anlagen, Produktionskapazitäten, Stärken und Schwächen des Unternehmens, Produkteinführung, Produktbreite und -umfang, Anwendungsdominanz. Die oben angegebenen Datenpunkte beziehen sich nur auf den Fokus der Unternehmen in Bezug auf den Markt.
Die Marktführer für japanische Restaurants in Nordamerika sind:
- Katsu-Ya Group, Inc (USA)
- Wokcano Asian Restaurant & Bar. (USA),
- 893 Ryōtei Berlin (Deutschland),
- Japanisches Restaurant Chiba (USA)
- Tsujita Artisan Nudel (Japan)
- Sushi Den (USA)
- Florilège (Japan)
- Kaiten Zushi (USA)
- Kura Sushi USA (USA)
- Narisawa (Japan)
- RE&S (Singapur)
- Sazenka (Japan)
- Sushi A Go (USA)
- Sushi Gen Enterprises (USA)
- Sushi Nozawa Group (USA)
- Sushiya (Indien)
- Takami Sushi & Robata Restaurant (USA)
- Tatsu Ramen LLC (USA)
- Yamashiro Hollywood (USA)
Neueste Entwicklungen auf dem nordamerikanischen japanischen Restaurantmarkt
- Im Mai 2024 hat Sushi Den die Wiedereinführung seines mit Spannung erwarteten Mittagsservices angekündigt. Darüber hinaus hat OTOTO, ein Neuzugang zu Sushi Den und Izakaya Den, einen köstlichen Sonntagsbrunch von 11:00 bis 14:00 Uhr eingeführt. Das Unternehmen freut sich darauf, dieses neue Kapitel mit seinen Kunden zu teilen und gemeinsam die frischen Angebote der Saison zu genießen.
- Im Mai 2024 startete Kura Sushi USA vom 1. Mai bis 30. Juni 2024 eine Bikkura Pon-Aktion zum Thema Dragon Ball Super. Die Zusammenarbeit umfasste exklusive Dragon Ball Super-Preise, darunter limitierte Schlüsselanhänger aus Acryl und Emaille-Anstecker. Ein seltener, im Dunkeln leuchtender Goku-Schlüsselanhänger war in begrenzter Stückzahl erhältlich. Vom 5. bis 9. Juni erhielten Rewards-Mitglieder bei einem Restaurantbesuch im Wert von 70 USD ein Dragon Ball Super-T-Shirt mit Grafik. Ein Dragon Ball Super-Flaschenset mit Strohhalm und Schlüsselband war ab dem 1. Juni für 16,00 USD erhältlich. Das Bikkura Pon-Preissystem belohnte die Gäste für jeweils 15 genossene Teller mit Preisen zum Thema Dragon Ball Super
- In December 2023, Kura Sushi USA, Inc. has introduced ecopon, the world’s first plastic-free, biodegradable paper capsule, for its Bikkura Pon prizes. Developed by K2 Station Co., Ltd., Rengo Co., Ltd., and Daiho Industrial Co., Ltd., ecopon capsules are made from starch and paper pulp, reducing CO2 emissions by a third compared to polypropylene. The new capsules will debut with a Peanuts® Bikkura Pon collaboration from Dec. 1, 2024, to Jan. 31, 2025. This initiative reflects Kura Sushi’s commitment to sustainability, following their transition to paper straws and other eco-friendly practices. For more information, visit kurasushi.com/sustainability
- In October 2023, Kura Sushi USA, Inc. has partnered with Peanuts Worldwide LLC for a special Bikkura Pon promotion running from Dec. 1, 2024, to Jan. 31, 2025. Diners can enjoy exclusive Peanuts-themed prizes, including figurine keychains, can badges, and microfiber cloths featuring characters like Snoopy and Charlie Brown. For every 15 sushi plates, guests will receive a Peanuts x Kura Sushi prize, with a rare Snoopy Figurine Keychain available only through the prize system. Rewards Members spending $70 from Jan. 3-7, 2024, will get a Peanuts-inspired cup set. Kura Sushi is also using ecopon’s biodegradable capsules for this promotion
SKU-
Erhalten Sie Online-Zugriff auf den Bericht zur weltweit ersten Market Intelligence Cloud

- Interaktives Datenanalyse-Dashboard
- Unternehmensanalyse-Dashboard für Chancen mit hohem Wachstumspotenzial
- Zugriff für Research-Analysten für Anpassungen und Abfragen
- Konkurrenzanalyse mit interaktivem Dashboard
- Aktuelle Nachrichten, Updates und Trendanalyse
- Nutzen Sie die Leistungsfähigkeit der Benchmark-Analyse für eine umfassende Konkurrenzverfolgung
Inhaltsverzeichnis
1 EINLEITUNG
1.1 ZIELE DER STUDIE
1.2 MARKTDEFINITION
1.3 ÜBERBLICK
1.4 EINSCHRÄNKUNGEN
1.5 ABGEDECKTE MÄRKTE
2 MARKTSEGMENTIERUNG
2.1 ABGEDECKTE MÄRKTE
2.2 GEOGRAFISCHER UMFANG
2.3 YEARS CONSIDERED FOR THE STUDY
2.4 CURRENCY AND PRICING
2.5 DBMR TRIPOD DATA VALIDATION MODEL
2.6 MULTIVARIATE MODELING
2.7 PRIMARY INTERVIEWS WITH KEY OPINION LEADERS
2.8 DBMR MARKET POSITION GRID
2.9 DBMR VENDOR SHARE ANALYSIS
2.1 SECONDARY SOURCES
2.11 ASSUMPTIONS
3 EXECUTIVE SUMMARY
4 PREMIUM INSIGHTS
4.1 SUPPLY CHAIN ANALYSIS
4.1.1 RAW MATERIAL SOURCING
4.1.2 PROCESSING & PACKAGING
4.1.3 LOGISTICS & DISTRIBUTION
4.1.4 RESTAURANT OPERATIONS
4.1.5 IMPORTANCE OF LOGISTICS SERVICE PROVIDERS FOR THE NORTH AMERICA JAPANESE RESTAURANT MARKET
4.2 VENDOR SELECTION CRITERIA
4.2.1 INGREDIENT QUALITY AND AUTHENTICITY
4.2.2 RELIABILITY AND SUPPLY CHAIN EFFICIENCY
4.2.3 COMPLIANCE WITH FOOD SAFETY AND REGULATORY STANDARDS
4.2.4 COST COMPETITIVENESS AND PRICING STABILITY
4.2.5 SUSTAINABILITY AND ETHICAL SOURCING PRACTICES
4.2.6 TECHNOLOGICAL INTEGRATION AND ORDERING EFFICIENCY
4.3 FACTORS INFLUENCING PURCHASING DECISION OF END USERS IN THE NORTH AMERICA JAPANESE RESTAURANT MARKET
4.3.1 AUTHENTICITY AND CULTURAL EXPERIENCE
4.3.2 QUALITY AND FRESHNESS OF INGREDIENTS
4.3.3 MENU VARIETY AND DIETARY PREFERENCES
4.3.4 PRICING AND VALUE FOR MONEY
4.3.5 AMBIENCE AND RESTAURANT DESIGN
4.3.6 BRAND REPUTATION AND REVIEWS
4.3.7 CONVENIENCE AND ACCESSIBILITY
4.3.8 CUSTOMER SERVICE AND HOSPITALITY
4.3.9 HEALTH AND SAFETY CONCERNS
4.3.10 CULTURAL TRENDS AND POPULARITY
4.3.11 CONCLUSION
4.4 GROWTH STRATEGIES ADOPTED BY KEY MARKET PLAYERS IN THE NORTH AMERICA JAPANESE RESTAURANT MARKET
4.4.1 EXPANSION THROUGH FRANCHISING
4.4.2 MENU INNOVATION AND DIVERSIFICATION
4.4.3 DIGITAL TRANSFORMATION AND ONLINE PRESENCE
4.4.4 STRATEGIC PARTNERSHIPS AND COLLABORATIONS
4.4.5 SUSTAINABLE PRACTICES AND ETHICAL SOURCING
4.4.6 PREMIUMIZATION AND FINE DINING CONCEPTS
4.4.7 GEOGRAPHIC EXPANSION INTO EMERGING MARKETS
4.4.8 LOYALTY PROGRAMS AND CUSTOMER ENGAGEMENT
4.4.9 TECHNOLOGY-DRIVEN EFFICIENCY
4.4.10 HEALTH AND WELLNESS-FOCUSED OFFERINGS
4.4.11 CONCLUSION
4.5 INDUSTRY TRENDS AND FUTURE PERSPECTIVE OF THE NORTH AMERICA JAPANESE RESTAURANT MARKET
4.5.1 RISING POPULARITY OF AUTHENTIC AND REGIONAL JAPANESE CUISINE
4.5.2 GROWTH OF FAST-CASUAL AND TAKEAWAY CONCEPTS
4.5.3 INCREASED FOCUS ON SUSTAINABILITY AND ETHICAL SOURCING
4.5.4 DIGITAL TRANSFORMATION AND SMART RESTAURANT TECHNOLOGY
4.5.5 EXPANSION INTO EMERGING MARKETS
4.5.6 HEALTH AND WELLNESS-DRIVEN MENUS
4.5.7 INFLUENCE OF JAPANESE POP CULTURE ON FOOD TRENDS
4.5.8 PERSONALIZATION AND CUSTOMIZATION
4.5.9 ALCOHOL PAIRING AND SAKE CULTURE EXPANSION
4.5.10 FUTURE OUTLOOK: THE EVOLUTION OF THE JAPANESE RESTAURANT MARKET
4.5.11 CONCLUSION
4.6 TECHNOLOGICAL ADVANCEMENT OF THE NORTH AMERICA JAPANESE RESTAURANT MARKET
4.6.1 AUTOMATION AND ROBOTICS
4.6.2 AI AND SMART ORDERING SYSTEMS
4.6.3 DIGITAL PAYMENT AND CONTACTLESS SOLUTIONS
4.6.4 SMART KITCHENS AND IOT INTEGRATION
4.6.5 SUSTAINABLE AND ECO-FRIENDLY INNOVATIONS
4.6.6 CONCLUSION
5 REGULATION COVERAGE
6 MARKET OVERVIEW
6.1 DRIVERS
6.1.1 INCREASING AWARENESS OF HEALTH BENEFITS
6.1.2 THE INCREASE IN POPULARITY OF THE DISH SUSHI
6.1.3 Die japanische Küche, die als immaterielles Kulturerbe der UNESCO anerkannt ist, steigert das Interesse der nordamerikanischen Verbraucher an der japanischen Küche
6.2 EINSCHRÄNKUNGEN
6.2.1 Lebensmittelverunreinigung, die die Sicherheit und Qualität des Produkts gefährdet
6.2.2 Hohe Kosten für Zutaten in der japanischen Küche
6.3 CHANCEN
6.3.1 INNOVATION IM SPEISEKARTENANGEBOT
6.3.2 ZUSAMMENARBEIT MIT LOKALEN KULTURELLEN VERANSTALTUNGEN UND FESTIVALS
6.4 HERAUSFORDERUNGEN
6.4.1 STARKER WETTBEWERB DURCH DIE ITALIENISCHE UND CHINESISCHE KÜCHE
6.4.2 AUTHENTIZITÄTSWAHRUNG UND ARBEITSKRÄFTEMANGEL
7. NORDAMERIKANISCHER JAPANISCHER RESTAURANTMARKT, NACH KÜCHENART
7.1 ÜBERSICHT
7.2 TRADITIONELLE JAPANISCHE KÜCHE
7.2.1 SUSHI
7.2.2 RAMEN
7.2.3 TEMPURA
7.2.4 SASHIMI
7.2.5 KAISEKI
7.2.6 UDON/SOBA
7.2.7 SONSTIGES
7.3 SPEZIALITÄTEN DER JAPANISCHEN KÜCHE
7.4 MODERNE JAPANISCHE KÜCHE
8. NORDAMERIKANISCHER MARKT FÜR JAPANISCHE RESTAURANTS, NACH SERVICEART
8.1 ÜBERSICHT
8.2 SCHNELLSERVICE-RESTAURANTS (QSR)
8.3 VOLLSERVICE-RESTAURANTS
8.4 Theken/Verkaufsstellen zum Mitnehmen
9. NORDAMERIKANISCHER JAPANISCHER RESTAURANTMARKT, NACH RESTAURANTTYP
9.1 ÜBERSICHT
9.2 EIGENSTÄNDIGES RESTAURANT
9.3 KETTEN-/FRANCHISE-MODELL
10 Nordamerikanischer japanischer Restaurantmarkt, nach Restaurantmodell
10.1 ÜBERSICHT
10.2 ZUM MITNEHMEN
10.3 HAUSLIEFERUNG
10.4 ESSEN IM RESTAURANT
11 NORDAMERIKANISCHER JAPANISCHER RESTAURANTMARKT, NACH VERTRIEBSKANAL
11.1 ÜBERSICHT
11.2 PHYSIKALISCHE STECKDOSEN
11.3 LIEFERUNG ONLINE RESTAURANTS/GHOST KITCHEN
12. Nordamerikanischer japanischer Restaurantmarkt nach Regionen
12.1 NORDAMERIKA
12.1.1 USA
12.1.2 KANADA
12.1.3 MEXIKO
13 Nordamerikanischer japanischer Restaurantmarkt: Unternehmenslandschaft
13.1 UNTERNEHMENSAKTIENANALYSE: NORDAMERIKA
14 SWOT-ANALYSE
15 FIRMENPROFILE
15.1 KATSU-YA GROUP, INC.
15.1.1 UNTERNEHMENSÜBERSICHT
15.1.2 UNTERNEHMENSAKTIENANALYSE
15.1.3 PRODUKTPORTFOLIO
15.1.4 JÜNGSTE ENTWICKLUNGEN
15.2 WOKCANO ASIATISCHES RESTAURANT & BAR.
15.2.1 UNTERNEHMENSÜBERSICHT
15.2.2 UNTERNEHMENSAKTIENANALYSE
15.2.3 PRODUKTPORTFOLIO
15.2.4 JÜNGSTE ENTWICKLUNGEN
15.3 893 RYŌTEI BERLIN
15.3.1 UNTERNEHMENSÜBERSICHT
15.3.2 UNTERNEHMENSAKTIENANALYSE
15.3.3 PRODUKTPORTFOLIO
15.3.4 JÜNGSTE ENTWICKLUNG
15.4 CHIBA JAPANESE RESTAURANT
15.4.1 UNTERNEHMENSÜBERSICHT
15.4.2 UNTERNEHMENSAKTIENANALYSE
15.4.3 PRODUKTPORTFOLIO
15.4.4 JÜNGSTE ENTWICKLUNG
15,5 TSUJITA-HANDWERKLICHE NUDELN.
15.5.1 UNTERNEHMENSÜBERSICHT
15.5.2 UNTERNEHMENSAKTIENANALYSE
15.5.3 PRODUKTPORTFOLIO
15.5.4 JÜNGSTE ENTWICKLUNG
15.6 FLORILÈGE
15.6.1 UNTERNEHMENSÜBERSICHT
15.6.2 PRODUKTPORTFOLIO
15.6.3 JÜNGSTE ENTWICKLUNG
15.7 KAITEN ZUSHI
15.7.1 UNTERNEHMENSÜBERSICHT
15.7.2 PRODUKTPORTFOLIO
15.7.3 JÜNGSTE ENTWICKLUNG
15.8 KURA SUSHI USA
15.8.1 UNTERNEHMENSÜBERSICHT
15.8.2 Umsatzanalyse
15.8.3 PRODUKTPORTFOLIO
15.8.4 JÜNGSTE ENTWICKLUNGEN
15.9 MY CONCIERGE JAPAN
15.9.1 UNTERNEHMENSÜBERSICHT
15.9.2 PRODUKTPORTFOLIO
15.9.3 JÜNGSTE ENTWICKLUNG
15.1 NARISAWA
15.10.1 UNTERNEHMENSÜBERSICHT
15.10.2 PRODUKTPORTFOLIO
15.10.3 JÜNGSTE ENTWICKLUNG
15.11 RE&S
15.11.1 UNTERNEHMENSÜBERSICHT
15.11.2 Umsatzanalyse
15.11.3 MARKENPORTFOLIO
15.11.4 NEUESTE ENTWICKLUNG
15.12 SAZENKA
15.12.1 UNTERNEHMENSÜBERSICHT
15.12.2 PRODUKTPORTFOLIO
15.12.3 NEUESTE ENTWICKLUNGEN
15.13 SEZZANE
15.13.1 UNTERNEHMENSÜBERSICHT
15.13.2 PRODUKTPORTFOLIO
15.13.3 AKTUELLE NACHRICHTEN
15.14 SUSHI A GO GO
15.14.1 UNTERNEHMENSÜBERSICHT
15.14.2 PRODUKTPORTFOLIO
15.14.3 JÜNGSTE ENTWICKLUNG
15.15 SUSHI DEN
15.15.1 UNTERNEHMENSÜBERSICHT
15.15.2 PRODUKTPORTFOLIO
15.15.3 NEUESTE ENTWICKLUNG
15.16 SUSHI GEN ENTERPRISES
15.16.1 UNTERNEHMENSÜBERSICHT
15.16.2 PRODUKTPORTFOLIO
15.16.3 JÜNGSTE ENTWICKLUNGEN
15.17 SUSHI NOZAWA GROUP
15.17.1 UNTERNEHMENSÜBERSICHT
15.17.2 PRODUKTPORTFOLIO
15.17.3 JÜNGSTE ENTWICKLUNGEN
15.18 SUSHIYA
15.18.1 UNTERNEHMENSÜBERSICHT
15.18.2 PRODUKTPORTFOLIO
15.18.3 JÜNGSTE ENTWICKLUNGEN
15.19 TAKAMI SUSHI & ROBATA RESTAURANT
15.19.1 UNTERNEHMENSÜBERSICHT
15.19.2 PRODUKTPORTFOLIO
15.19.3 NEUESTE ENTWICKLUNG
15.2 TATSU RAMEN LLC
15.20.1 UNTERNEHMENSÜBERSICHT
15.20.2 PRODUKTPORTFOLIO
15.20.3 JÜNGSTE ENTWICKLUNGEN
15.21 YAMASHIRO HOLLYWOOD
15.21.1 UNTERNEHMENSÜBERSICHT
15.21.2 PRODUKTPORTFOLIO
15.21.3 NEUESTE ENTWICKLUNGEN
16 FRAGEBOGEN
17 VERWANDTE BERICHTE
Tabellenverzeichnis
TABELLE 1 REGULIERUNGSABDECKUNG
TABELLE 2: NORDAMERIKANISCHER MARKT FÜR JAPANISCHE RESTAURANTS, NACH KÜCHENART, 2018–2032 (TAUSEND USD)
TABELLE 3: TRADITIONELLE JAPANISCHE KÜCHE IM JAPANISCHEN RESTAURANTMARKT IN NORDAMERIKA, NACH REGION, 2018–2032 (TAUSEND USD)
TABELLE 4: TRADITIONELLE JAPANISCHE KÜCHE IM JAPANISCHEN RESTAURANTMARKT IN NORDAMERIKA, NACH ART, 2018–2032 (TAUSEND USD)
TABELLE 5: SUSHI IM NORDAMERIKANISCHEN RESTAURANTMARKT, NACH ART, 2018–2032 (TAUSEND USD)
TABELLE 6: SUSHI IM JAPANISCHEN RESTAURANTMARKT IN NORDAMERIKA, NACH KETTE, 2018–2032 (TAUSEND USD)
TABELLE 7: SUSHI IM JAPANISCHEN RESTAURANTMARKT IN NORDAMERIKA, NACH RESTAURANTMODUS, 2018–2032 (TAUSEND USD)
TABELLE 8: SUSHI IM JAPANISCHEN RESTAURANTMARKT IN NORDAMERIKA, NACH BETRIEBSSTÄTTEN, 2018–2032 (TAUSEND USD)
TABELLE 9: RAMEN IN NORDAMERIKA AUF DEM JAPANISCHEN RESTAURANTMARKT, NACH RESTAURANTMODUS, 2018–2032 (TAUSEND USD)
TABELLE 10: RAMEN IN NORDAMERIKA AUF DEM JAPANISCHEN RESTAURANTMARKT, NACH BETRIEBSSTÄTTEN, 2018–2032 (TAUSEND USD)
TABELLE 11: TEMPURA IM NORDAMERIKANISCHEN RESTAURANTMARKT, NACH RESTAURANTART, 2018–2032 (TAUSEND USD)
TABELLE 12: TEMPURA IM MARKT DER JAPANISCHEN RESTAURANTS IN NORDAMERIKA, NACH BETRIEBSSTÄTTEN, 2018–2032 (TAUSEND USD)
TABELLE 13: SASHIMI IM JAPANISCHEN RESTAURANTMARKT IN NORDAMERIKA, NACH RESTAURANTART, 2018–2032 (TAUSEND USD)
TABELLE 14: SASHIMI IM JAPANISCHEN RESTAURANTMARKT IN NORDAMERIKA, NACH BETRIEBSSTÄTTEN, 2018–2032 (TAUSEND USD)
TABELLE 15: KAISEKI IM JAPANISCHEN RESTAURANTMARKT IN NORDAMERIKA, NACH RESTAURANTMODUS, 2018–2032 (TAUSEND USD)
TABELLE 16: KAISEKI IM JAPANISCHEN RESTAURANTMARKT IN NORDAMERIKA, NACH BETRIEBSART, 2018–2032 (TAUSEND USD)
TABELLE 17: UDON/SOBA IN NORDAMERIKA AUF DEM JAPANISCHEN RESTAURANTMARKT, NACH RESTAURANTART, 2018–2032 (TAUSEND USD)
TABELLE 18: UDON/SOBA IN NORDAMERIKA AUF DEM JAPANISCHEN RESTAURANTMARKT, NACH BETRIEBSART, 2018–2032 (TAUSEND USD)
TABELLE 19: ANDERE UNTERNEHMEN IM JAPANISCHEN RESTAURANTMARKT IN NORDAMERIKA, NACH RESTAURANTART, 2018–2032 (TAUSEND USD)
TABELLE 20: ANDERE UNTERNEHMEN IM JAPANISCHEN RESTAURANTMARKT IN NORDAMERIKA, NACH BETRIEBSART, 2018–2032 (TAUSEND USD)
TABELLE 21: JAPANISCHE SPEZIALITÄTENKÜCHE IM JAPANISCHEN RESTAURANTMARKT IN NORDAMERIKA, NACH REGION, 2018–2032 (TAUSEND USD)
TABELLE 22: JAPANISCHE SPEZIALITÄTENKÜCHE IM MARKT DER JAPANISCHEN RESTAURANTS IN NORDAMERIKA, NACH ART, 2018–2032 (TAUSEND USD)
TABELLE 23: JAPANISCHE SPEZIALKÜCHE IM JAPANISCHEN RESTAURANTMARKT IN NORDAMERIKA, NACH RESTAURANTART, 2018–2032 (TAUSEND USD)
TABELLE 24: JAPANISCHE SPEZIALITÄTEN IN NORDAMERIKA AUF DEM MARKT FÜR JAPANISCHE RESTAURANTS, NACH BETRIEBSART, 2018–2032 (TAUSEND USD)
TABELLE 25: MODERNE JAPANISCHE KÜCHE IM JAPANISCHEN RESTAURANTMARKT IN NORDAMERIKA, NACH REGION, 2018–2032 (TAUSEND USD)
TABELLE 26: MODERNE JAPANISCHE KÜCHE IM JAPANISCHEN RESTAURANTMARKT IN NORDAMERIKA, NACH ART, 2018–2032 (TAUSEND USD)
TABELLE 27: MODERNE JAPANISCHE KÜCHE IN NORDAMERIKA IM JAPANISCHEN RESTAURANTMARKT, NACH RESTAURANTART, 2018–2032 (TAUSEND USD)
TABELLE 28 NORDAMERIKANISCHE MODERNE JAPANISCHE KÜCHE IM MARKT DER JAPANISCHEN RESTAURANTS, NACH BETRIEBSART, 2018–2032 (TAUSEND USD)
TABELLE 29: NORDAMERIKANISCHER MARKT FÜR JAPANISCHE RESTAURANTS, NACH SERVICEART, 2018–2032 (TAUSEND USD)
TABELLE 30: NORDAMERIKANISCHE SCHNELLSERVICE-RESTAURANTS (QSR) AUF DEM JAPANISCHEN RESTAURANTMARKT, NACH REGION, 2018–2032 (TAUSEND USD)
TABELLE 31: NORDAMERIKANISCHER VOLLSERVICE-MARKT FÜR JAPANISCHE RESTAURANTS, NACH REGION, 2018–2032 (TAUSEND USD)
TABELLE 32: TAKE-OUT-THEKEN/-OUTLETS IM JAPANISCHEN RESTAURANTMARKT IN NORDAMERIKA, NACH REGION, 2018–2032 (TAUSEND USD)
TABELLE 33: NORDAMERIKANISCHER MARKT FÜR JAPANISCHE RESTAURANTS, NACH RESTAURANKTATEGORIE, 2018–2032 (TAUSEND USD)
TABELLE 34: NORDAMERIKANISCHE STANDALONE-RESTAURANTS AUF DEM JAPANISCHEN RESTAURANTMARKT, NACH REGION, 2018–2032 (TAUSEND USD)
TABELLE 35: NORDAMERIKANISCHES KETTEN-/FRANCHISE-MODELL IM JAPANISCHEN RESTAURANTMARKT, NACH REGION, 2018–2032 (TAUSEND USD)
TABELLE 36: NORDAMERIKANISCHER MARKT FÜR JAPANISCHE RESTAURANTS, NACH RESTAURANTMODELL, 2018–2032 (TAUSEND USD)
TABELLE 37: NORDAMERIKANISCHER MARKT FÜR TAKEAWAY-GERICHTE IM JAPANISCHEN RESTAURANT, NACH REGION, 2018–2032 (TAUSEND USD)
TABELLE 38: HAUSLIEFERUNG IM JAPANISCHEN RESTAURANTMARKT IN NORDAMERIKA, NACH REGION, 2018–2032 (TAUSEND USD)
TABELLE 39: NORDAMERIKANISCHER MARKT FÜR RESTAURANTS IM JAPANISCHEN RESTAURANT, NACH REGION, 2018–2032 (TAUSEND USD)
TABELLE 40: NORDAMERIKANISCHER MARKT FÜR JAPANISCHE RESTAURANTS, NACH VERTRIEBSKANAL, 2018–2032 (TAUSEND USD)
TABELLE 41: NORDAMERIKANISCHE VERKAUFSSTELLEN IM JAPANISCHEN RESTAURANTMARKT, NACH REGION, 2018–2032 (TAUSEND USD)
TABELLE 42: NORDAMERIKANISCHE ONLINE-LIEFERRESTAURANTS/GHOST KITCHEN AUF DEM JAPANISCHEN RESTAURANTMARKT, NACH REGION, 2018–2032 (TAUSEND USD)
TABELLE 43: NORDAMERIKANISCHER MARKT FÜR JAPANISCHE RESTAURANTS, NACH LÄNDERN, 2018–2032 (TAUSEND USD)
TABELLE 44: NORDAMERIKANISCHER MARKT FÜR JAPANISCHE RESTAURANTS, NACH KÜCHENART, 2018–2032 (TAUSEND USD)
TABELLE 45: TRADITIONELLE JAPANISCHE KÜCHE IM JAPANISCHEN RESTAURANTMARKT IN NORDAMERIKA, NACH ART, 2018–2032 (TAUSEND USD)
TABELLE 46: SUSHI IM JAPANISCHEN RESTAURANTMARKT IN NORDAMERIKA, NACH ART, 2018–2032 (TAUSEND USD)
TABELLE 47: SUSHI IM JAPANISCHEN RESTAURANTMARKT IN NORDAMERIKA, NACH KETTE, 2018–2032 (TAUSEND USD)
TABELLE 48 NORDAMERIKANISCHER SUSHI-MARKT IM JAPANISCHEN RESTAURANT, NACH RESTAURANTART, 2018–2032 (TAUSEND USD)
TABELLE 49: SUSHI IM JAPANISCHEN RESTAURANTMARKT IN NORDAMERIKA, NACH BETRIEBSSTÄTTEN, 2018–2032 (TAUSEND USD)
TABELLE 50: NORDAMERIKANISCHE RAMEN AUF DEM JAPANISCHEN RESTAURANTMARKT, NACH RESTAURANTMODUS, 2018–2032 (TAUSEND USD)
TABELLE 51: RAMEN IN NORDAMERIKA AUF DEM JAPANISCHEN RESTAURANTMARKT, NACH BETRIEBSSTÄTTEN, 2018–2032 (TAUSEND USD)
TABELLE 52: TEMPURA IM NORDAMERIKANISCHEN RESTAURANTMARKT, NACH RESTAURANTART, 2018–2032 (TAUSEND USD)
TABELLE 53 TEMPURA IM MARKT DER JAPANISCHEN RESTAURANTS IN NORDAMERIKA, NACH BETRIEBSART, 2018–2032 (TAUSEND USD)
TABELLE 54: SASHIMI IN NORDAMERIKA AUF DEM JAPANISCHEN RESTAURANTMARKT, NACH RESTAURANTART, 2018–2032 (TAUSEND USD)
TABELLE 55: SASHIMI IM JAPANISCHEN RESTAURANTMARKT IN NORDAMERIKA, NACH BETRIEBSSTÄTTEN, 2018–2032 (TAUSEND USD)
TABELLE 56: KAISEKI IN NORDAMERIKA IM JAPANISCHEN RESTAURANTMARKT, NACH RESTAURANTMODUS, 2018–2032 (TAUSEND USD)
TABELLE 57: KAISEKI IM JAPANISCHEN RESTAURANTMARKT IN NORDAMERIKA, NACH BETRIEBSART, 2018–2032 (TAUSEND USD)
TABELLE 58: UDON/SOBA IN NORDAMERIKA AUF DEM JAPANISCHEN RESTAURANTMARKT, NACH RESTAURANTART, 2018–2032 (TAUSEND USD)
TABELLE 59: UDON/SOBA IN NORDAMERIKA AUF DEM JAPANISCHEN RESTAURANTMARKT, NACH BETRIEBSART, 2018–2032 (TAUSEND USD)
TABELLE 60 NORDAMERIKANISCHE ANDERE UNTERNEHMEN IM JAPANISCHEN RESTAURANTMARKT, NACH RESTAURANTART, 2018–2032 (TAUSEND USD)
TABELLE 61 NORDAMERIKANISCHE ANDERE UNTERNEHMEN IM JAPANISCHEN RESTAURANTMARKT, NACH BETRIEBSART, 2018–2032 (TAUSEND USD)
TABELLE 62: JAPANISCHE SPEZIALITÄTENKÜCHE IM MARKT DER JAPANISCHEN RESTAURANTS IN NORDAMERIKA, NACH ART, 2018–2032 (TAUSEND USD)
TABELLE 63: JAPANISCHE SPEZIALITÄTENKÜCHE IM JAPANISCHEN RESTAURANTMARKT IN NORDAMERIKA, NACH RESTAURANTART, 2018–2032 (TAUSEND USD)
TABELLE 64: JAPANISCHE SPEZIALITÄTEN IN NORDAMERIKA AUF DEM MARKT FÜR JAPANISCHE RESTAURANTS, NACH BETRIEBSART, 2018–2032 (TAUSEND USD)
TABELLE 65: MODERNE JAPANISCHE KÜCHE IM JAPANISCHEN RESTAURANTMARKT IN NORDAMERIKA, NACH ART, 2018–2032 (TAUSEND USD)
TABELLE 66: MODERNE JAPANISCHE KÜCHE IN NORDAMERIKA IM JAPANISCHEN RESTAURANTMARKT, NACH RESTAURANTART, 2018–2032 (TAUSEND USD)
TABELLE 67: MODERNE JAPANISCHE KÜCHE IN NORDAMERIKA IM JAPANISCHEN RESTAURANTMARKT, NACH BETRIEBSART, 2018–2032 (TAUSEND USD)
TABELLE 68: NORDAMERIKANISCHER MARKT FÜR JAPANISCHE RESTAURANTS, NACH SERVICEART, 2018–2032 (TAUSEND USD)
TABELLE 69: NORDAMERIKANISCHER MARKT FÜR JAPANISCHE RESTAURANTS, NACH RESTAURANKTATEGORIE, 2018–2032 (TAUSEND USD)
TABELLE 70: NORDAMERIKANISCHER MARKT FÜR JAPANISCHE RESTAURANTS, NACH RESTAURANTMODELL, 2018–2032 (TAUSEND USD)
TABELLE 71: NORDAMERIKANISCHER MARKT FÜR JAPANISCHE RESTAURANTS, NACH VERTRIEBSKANAL, 2018–2032 (TAUSEND USD)
TABELLE 72: US-MARKT FÜR JAPANISCHE RESTAURANTS, NACH KÜCHENART, 2018–2032 (TAUSEND USD)
TABELLE 73 TRADITIONELLE JAPANISCHE KÜCHE IM MARKT DER JAPANISCHEN RESTAURANTS IN DEN USA, NACH ART, 2018–2032 (TAUSEND USD)
TABELLE 74 US-SUSHI IM JAPANISCHEN RESTAURANTMARKT, NACH ART, 2018–2032 (TAUSEND USD)
TABELLE 75: US-SUSHI IM JAPANISCHEN RESTAURANTMARKT, NACH KETTE, 2018–2032 (TAUSEND USD)
TABELLE 76 US-SUSHI IM JAPANISCHEN RESTAURANTMARKT, NACH RESTAURANTMODUS, 2018–2032 (TAUSEND USD)
TABELLE 77 US-SUSHI IM JAPANISCHEN RESTAURANTMARKT, NACH BETRIEBSSTÄTTEN, 2018–2032 (TAUSEND USD)
TABELLE 78 US-RAMEN AUF DEM JAPANISCHEN RESTAURANTMARKT, NACH RESTAURANTMODUS, 2018–2032 (TAUSEND USD)
TABELLE 79 US-RAMEN AUF DEM JAPANISCHEN RESTAURANTMARKT, NACH BETRIEBSSTÄTTEN, 2018–2032 (TAUSEND USD)
TABELLE 80 US-TEMPURA IM JAPANISCHEN RESTAURANTMARKT, NACH RESTAURANTMODUS, 2018–2032 (TAUSEND USD)
TABELLE 81 US-TEMPURA IM JAPANISCHEN RESTAURANTMARKT, NACH BETRIEBSART, 2018–2032 (TAUSEND USD)
TABELLE 82 US-SASHIMI IM JAPANISCHEN RESTAURANTMARKT, NACH RESTAURANTMODUS, 2018–2032 (TAUSEND USD)
TABELLE 83 US-SASHIMI IM JAPANISCHEN RESTAURANTMARKT, NACH BETRIEBSSTÄTTEN, 2018–2032 (TAUSEND USD)
TABELLE 84 US-KAISEKI IM JAPANISCHEN RESTAURANTMARKT, NACH RESTAURANTMODUS, 2018–2032 (TAUSEND USD)
TABELLE 85: US-KAISEKI IM JAPANISCHEN RESTAURANTMARKT, NACH BETRIEBSART, 2018–2032 (TAUSEND USD)
TABELLE 86 US-amerikanischer UDON/SOBA IM JAPANISCHEN RESTAURANTMARKT, NACH RESTAURANTART, 2018–2032 (TAUSEND USD)
TABLE 87 U.S. UDON/SOBA IN JAPANESE RESTAURANT MARKET, BY ESTABLISHMENT, 2018-2032 (USD THOUSAND)
TABLE 88 U.S. OTHERS IN JAPANESE RESTAURANT MARKET, BY RESTAURANT MODE, 2018-2032 (USD THOUSAND)
TABLE 89 U.S. OTHERS IN JAPANESE RESTAURANT MARKET, BY ESTABLISHMENT, 2018-2032 (USD THOUSAND)
TABLE 90 U.S. SPECIALTY JAPANESE CUISINE IN JAPANESE RESTAURANT MARKET, BY TYPE, 2018-2032 (USD THOUSAND)
TABLE 91 U.S. SPECIALTY JAPANESE CUISINE IN JAPANESE RESTAURANT MARKET, BY RESTAURANT MODE, 2018-2032 (USD THOUSAND)
TABLE 92 U.S. SPECIALTY JAPANESE IN JAPANESE RESTAURANT MARKET, BY ESTABLISHMENT, 2018-2032 (USD THOUSAND)
TABLE 93 U.S. MODERN JAPANESE CUISINE IN JAPANESE RESTAURANT MARKET, BY TYPE, 2018-2032 (USD THOUSAND)
TABLE 94 U.S. MODERN JAPANESE CUISINE IN JAPANESE RESTAURANT MARKET, BY RESTAURANT MODE, 2018-2032 (USD THOUSAND)
TABLE 95 U.S. MODERN JAPANESE CUISINE IN JAPANESE RESTAURANT MARKET, BY ESTABLISHMENT, 2018-2032 (USD THOUSAND)
TABLE 96 U.S. JAPANESE RESTAURANT MARKET, BY SERVICE TYPE, 2018-2032 (USD THOUSAND)
TABLE 97 U.S. JAPANESE RESTAURANT MARKET, BY RESTAURANT CATEGORY, 2018-2032 (USD THOUSAND)
TABLE 98 U.S. JAPANESE RESTAURANT MARKET, BY RESTAURANT MODEL, 2018-2032 (USD THOUSAND)
TABLE 99 U.S. JAPANESE RESTAURANT MARKET, BY SALES CHANNEL, 2018-2032 (USD THOUSAND)
TABLE 100 CANADA JAPANESE RESTAURANT MARKET, BY CUISINE TYPE, 2018-2032 (USD THOUSAND)
TABLE 101 CANADA TRADITIONAL JAPANESE CUISINE IN JAPANESE RESTAURANT MARKET, BY TYPE, 2018-2032 (USD THOUSAND)
TABLE 102 CANADA SUSHI IN JAPANESE RESTAURANT MARKET, BY TYPE, 2018-2032 (USD THOUSAND)
TABLE 103 CANADA SUSHI IN JAPANESE RESTAURANT MARKET, BY CHAIN, 2018-2032 (USD THOUSAND)
TABLE 104 CANADA SUSHI IN JAPANESE RESTAURANT MARKET, BY RESTAURANT MODE, 2018-2032 (USD THOUSAND)
TABLE 105 CANADA SUSHI IN JAPANESE RESTAURANT MARKET, BY ESTABLISHMENT, 2018-2032 (USD THOUSAND)
TABLE 106 CANADA RAMEN IN JAPANESE RESTAURANT MARKET, BY RESTAURANT MODE, 2018-2032 (USD THOUSAND)
TABLE 107 CANADA RAMEN IN JAPANESE RESTAURANT MARKET, BY ESTABLISHMENT, 2018-2032 (USD THOUSAND)
TABLE 108 CANADA TEMPURA IN JAPANESE RESTAURANT MARKET, BY RESTAURANT MODE, 2018-2032 (USD THOUSAND)
TABLE 109 CANADA TEMPURA IN JAPANESE RESTAURANT MARKET, BY ESTABLISHMENT, 2018-2032 (USD THOUSAND)
TABLE 110 CANADA SASHIMI IN JAPANESE RESTAURANT MARKET, BY RESTAURANT MODE, 2018-2032 (USD THOUSAND)
TABLE 111 CANADA SASHIMI IN JAPANESE RESTAURANT MARKET, BY ESTABLISHMENT, 2018-2032 (USD THOUSAND)
TABLE 112 CANADA KAISEKI IN JAPANESE RESTAURANT MARKET, BY RESTAURANT MODE, 2018-2032 (USD THOUSAND)
TABLE 113 CANADA KAISEKI IN JAPANESE RESTAURANT MARKET, BY ESTABLISHMENT, 2018-2032 (USD THOUSAND)
TABLE 114 CANADA UDON/SOBA IN JAPANESE RESTAURANT MARKET, BY RESTAURANT MODE, 2018-2032 (USD THOUSAND)
TABLE 115 CANADA UDON/SOBA IN JAPANESE RESTAURANT MARKET, BY ESTABLISHMENT, 2018-2032 (USD THOUSAND)
TABLE 116 CANADA OTHERS IN JAPANESE RESTAURANT MARKET, BY RESTAURANT MODE, 2018-2032 (USD THOUSAND)
TABELLE 117 KANADA ANDERE UNTERNEHMEN IM JAPANISCHEN RESTAURANTMARKT, NACH BETRIEBSART, 2018–2032 (TAUSEND USD)
TABELLE 118 KANADISCHE SPEZIALITÄTEN DER JAPANISCHEN KÜCHE IM MARKT DER JAPANISCHEN RESTAURANTS, NACH ART, 2018–2032 (TAUSEND USD)
TABELLE 119 KANADISCHE SPEZIALITÄTEN DER JAPANISCHEN KÜCHE IM JAPANISCHEN RESTAURANTMARKT, NACH RESTAURANTART, 2018–2032 (TAUSEND USD)
TABELLE 120 KANADISCHE JAPANISCHE SPEZIALITÄTEN IM MARKT DER JAPANISCHEN RESTAURANTS, NACH BETRIEBSART, 2018–2032 (TAUSEND USD)
TABELLE 121: MODERNE JAPANISCHE KÜCHE IM JAPANISCHEN RESTAURANTMARKT IN KANADA, NACH ART, 2018–2032 (TAUSEND USD)
TABELLE 122: MODERNE JAPANISCHE KÜCHE IM JAPANISCHEN RESTAURANTMARKT IN KANADA, NACH RESTAURANTART, 2018–2032 (TAUSEND USD)
TABELLE 123: MODERNE JAPANISCHE KÜCHE IM JAPANISCHEN RESTAURANTMARKT IN KANADA, NACH BETRIEBSART, 2018–2032 (TAUSEND USD)
TABELLE 124: KANADISCHER MARKT FÜR JAPANISCHE RESTAURANTS, NACH SERVICEART, 2018–2032 (TAUSEND USD)
TABELLE 125: KANADISCHER JAPANISCHER RESTAURANTMARKT, NACH RESTAURANTKATEGORIE, 2018–2032 (TAUSEND USD)
TABELLE 126: JAPANISCHER RESTAURANTMARKT IN KANADA, NACH RESTAURANTMODELL, 2018–2032 (TAUSEND USD)
TABELLE 127: KANADISCHER MARKT FÜR JAPANISCHE RESTAURANTS, NACH VERTRIEBSKANAL, 2018–2032 (TAUSEND USD)
TABELLE 128 MEXIKO: JAPANISCHER RESTAURANTMARKT NACH KÜCHENART, 2018–2032 (TAUSEND USD)
TABELLE 129: TRADITIONELLE JAPANISCHE KÜCHE IN MEXIKA AUF DEM MARKT FÜR JAPANISCHE RESTAURANTS, NACH ART, 2018–2032 (TAUSEND USD)
TABELLE 130 MEXIKANISCHES SUSHI AUF DEM MARKT FÜR JAPANISCHE RESTAURANTS, NACH ART, 2018–2032 (TAUSEND USD)
TABELLE 131 MEXIKANISCHES SUSHI IM JAPANISCHEN RESTAURANTMARKT, NACH KETTE, 2018–2032 (TAUSEND USD)
TABELLE 132 MEXIKANISCHES SUSHI AUF DEM JAPANISCHEN RESTAURANTMARKT, NACH RESTAURANTMODUS, 2018–2032 (TAUSEND USD)
TABELLE 133 MEXIKANISCHES SUSHI AUF DEM JAPANISCHEN RESTAURANTMARKT, NACH BETRIEBSSTÄTTEN, 2018–2032 (TAUSEND USD)
TABELLE 134 MEXIKANISCHE RAMEN AUF DEM JAPANISCHEN RESTAURANTMARKT, NACH RESTAURANTMODUS, 2018–2032 (TAUSEND USD)
TABELLE 135 MEXICO RAMEN AUF DEM JAPANISCHEN RESTAURANTMARKT, NACH BETRIEBSSTÄTTEN, 2018–2032 (TAUSEND USD)
TABELLE 136 MEXICO TEMPURA IM JAPANISCHEN RESTAURANTMARKT, NACH RESTAURANTART, 2018–2032 (TAUSEND USD)
TABELLE 137 MEXICO TEMPURA AUF DEM MARKT FÜR JAPANISCHE RESTAURANTS, NACH BETRIEBSSTÄTTEN, 2018–2032 (TAUSEND USD)
TABELLE 138 MEXIKANISCHES SASHIMI AUF DEM JAPANISCHEN RESTAURANTMARKT, NACH RESTAURANTMODUS, 2018–2032 (TAUSEND USD)
TABELLE 139 MEXIKANISCHES SASHIMI AUF DEM JAPANISCHEN RESTAURANTMARKT, NACH BETRIEBSSTÄTTEN, 2018–2032 (TAUSEND USD)
TABELLE 140 MEXICO KAISEKI AUF DEM JAPANISCHEN RESTAURANTMARKT, NACH RESTAURANTMODUS, 2018–2032 (TAUSEND USD)
TABELLE 141 MEXICO KAISEKI IM JAPANISCHEN RESTAURANTMARKT, NACH BETRIEBSART, 2018–2032 (TAUSEND USD)
TABELLE 142 MEXIKANISCHE UDON/SOBA AUF DEM JAPANISCHEN RESTAURANTMARKT, NACH RESTAURANTART, 2018–2032 (TAUSEND USD)
TABELLE 143 MEXIKANISCHE UDON/SOBA AUF DEM JAPANISCHEN RESTAURANTMARKT, NACH BETRIEBSSTÄTTEN, 2018–2032 (TAUSEND USD)
TABELLE 144 MEXIKO: ANDERE UNTERNEHMEN IM JAPANISCHEN RESTAURANTMARKT, NACH RESTAURANTART, 2018–2032 (TAUSEND USD)
TABELLE 145 MEXIKO: ANDERE UNTERNEHMEN IM JAPANISCHEN RESTAURANTMARKT, NACH BETRIEBSART, 2018–2032 (TAUSEND USD)
TABELLE 146 MEXIKANISCHE SPEZIALITÄTEN DER JAPANISCHEN KÜCHE IM MARKT DER JAPANISCHEN RESTAURANTS, NACH ART, 2018–2032 (TAUSEND USD)
TABELLE 147 MEXIKANISCHE SPEZIALITÄTEN DER JAPANISCHEN KÜCHE IM JAPANISCHEN RESTAURANTMARKT, NACH RESTAURANTART, 2018–2032 (TAUSEND USD)
TABELLE 148 MEXIKANISCHE JAPANISCHE SPEZIALITÄTEN AUF DEM MARKT FÜR JAPANISCHE RESTAURANTS, NACH BETRIEBSART, 2018–2032 (TAUSEND USD)
TABELLE 149: MODERNE JAPANISCHE KÜCHE IN MEXIKO AUF DEM MARKT FÜR JAPANISCHE RESTAURANTS, NACH ART, 2018–2032 (TAUSEND USD)
TABELLE 150 MEXIKO: MODERNE JAPANISCHE KÜCHE IM JAPANISCHEN RESTAURANTMARKT, NACH RESTAURANTMODUS, 2018–2032 (TAUSEND USD)
TABELLE 151 MEXIKO: MODERNE JAPANISCHE KÜCHE IM JAPANISCHEN RESTAURANTMARKT, NACH BETRIEBSART, 2018–2032 (TAUSEND USD)
TABELLE 152: MEXIKO-MARKT FÜR JAPANISCHE RESTAURANTS, NACH SERVICEART, 2018–2032 (TAUSEND USD)
TABELLE 153 MEXIKO: JAPANISCHER RESTAURANTMARKT, NACH RESTAURANTTYP, 2018–2032 (TAUSEND USD)
TABELLE 154 MEXIKO: JAPANISCHER RESTAURANTMARKT, NACH RESTAURANTMODELL, 2018–2032 (TAUSEND USD)
TABELLE 155: MEXIKO-JAPANISCHER RESTAURANTMARKT, NACH VERTRIEBSKANAL, 2018–2032 (TAUSEND USD)
Abbildungsverzeichnis
ABBILDUNG 1: NORDAMERIKANISCHER JAPANISCHER RESTAURANTMARKT
ABBILDUNG 2: NORDAMERIKANISCHER MARKT FÜR JAPANISCHE RESTAURANTS: DATENTRIANGULATION
ABBILDUNG 3: NORDAMERIKANISCHER MARKT FÜR JAPANISCHE RESTAURANTS: DROC-ANALYSE
ABBILDUNG 4: NORDAMERIKANISCHER MARKT FÜR JAPANISCHE RESTAURANTS: NORDAMERIKA VS. REGIONALE MARKTANALYSE
ABBILDUNG 5: NORDAMERIKANISCHER MARKT FÜR JAPANISCHE RESTAURANTS: UNTERNEHMENSFORSCHUNGSANALYSE
ABBILDUNG 6: JAPANISCHER RESTAURANTMARKT IN NORDAMERIKA: MULTIVARIATE MODELLIERUNG
ABBILDUNG 7: JAPANISCHER RESTAURANTMARKT IN NORDAMERIKA: DEMOGRAFISCHE INTERVIEWS
ABBILDUNG 8: NORDAMERIKANISCHER MARKT FÜR JAPANISCHE RESTAURANTS: DBMR-MARKTPOSITIONSRASTER
ABBILDUNG 9: NORDAMERIKANISCHER MARKT FÜR JAPANISCHE RESTAURANTS: ANALYSE DER ANBIETERANTEILE
ABBILDUNG 10 NORDAMERIKANISCHER MARKT FÜR JAPANISCHE RESTAURANTS: SEGMENTIERUNG
ABBILDUNG 11 DER NORDAMERIKANISCHE MARKT FÜR JAPANISCHE RESTAURANTS BESTEHT AUS DREI SEGMENTEN: NACH KÜCHENART, 2024
ABBILDUNG 12 ZUSAMMENFASSUNG
ABBILDUNG 13 STRATEGISCHE ENTSCHEIDUNGEN
ABBILDUNG 14 DAS STEIGENDE BEWUSSTSEIN FÜR GESUNDHEITLICHE VORTEILE WIRD DEN NORDAMERIKANISCHEN MARKT FÜR JAPANISCHE RESTAURANTS IM PROGNOSEZEITRAUM VORAUSSICHTLICH ANTREIBEN
ABBILDUNG 15: Das Segment der traditionellen japanischen Küche wird voraussichtlich 2025 und 2032 den größten Anteil am nordamerikanischen Markt für japanische Restaurants ausmachen.
ABBILDUNG 16 LIEFERKETTENANALYSE – NORDAMERIKANISCHER JAPANISCHER RESTAURANTMARKT
ABBILDUNG 17 LIEFERANTENAUSWAHLKRITERIEN
ABBILDUNG 18 TREIBER, EINSCHRÄNKUNGEN, CHANCEN UND HERAUSFORDERUNGEN DES NORDAMERIKANISCHEN MARKTES FÜR JAPANISCHE RESTAURANTS
ABBILDUNG 19 NORDAMERIKANISCHER MARKT FÜR JAPANISCHE RESTAURANTS: NACH KÜCHENART, 2024
ABBILDUNG 20 NORDAMERIKANISCHER MARKT FÜR JAPANISCHE RESTAURANTS: NACH SERVICEART, 2024
ABBILDUNG 21 NORDAMERIKANISCHER MARKT FÜR JAPANISCHE RESTAURANTS: NACH RESTAURANTCATEGORIE, 2024
ABBILDUNG 22 NORDAMERIKANISCHER MARKT FÜR JAPANISCHE RESTAURANTS: NACH RESTAURANTMODELL, 2024
ABBILDUNG 23 NORDAMERIKANISCHER MARKT FÜR JAPANISCHE RESTAURANTS: NACH VERTRIEBSKANAL, 2024
ABBILDUNG 24 NORDAMERIKANISCHER MARKT FÜR JAPANISCHE RESTAURANTS: ÜBERSICHT, 2024
ABBILDUNG 25 NORDAMERIKANISCHER MARKT FÜR JAPANISCHE RESTAURANTS: UNTERNEHMENSANTEIL, 2024 (%)
Forschungsmethodik
Die Datenerfassung und Basisjahresanalyse werden mithilfe von Datenerfassungsmodulen mit großen Stichprobengrößen durchgeführt. Die Phase umfasst das Erhalten von Marktinformationen oder verwandten Daten aus verschiedenen Quellen und Strategien. Sie umfasst die Prüfung und Planung aller aus der Vergangenheit im Voraus erfassten Daten. Sie umfasst auch die Prüfung von Informationsinkonsistenzen, die in verschiedenen Informationsquellen auftreten. Die Marktdaten werden mithilfe von marktstatistischen und kohärenten Modellen analysiert und geschätzt. Darüber hinaus sind Marktanteilsanalyse und Schlüsseltrendanalyse die wichtigsten Erfolgsfaktoren im Marktbericht. Um mehr zu erfahren, fordern Sie bitte einen Analystenanruf an oder geben Sie Ihre Anfrage ein.
Die wichtigste Forschungsmethodik, die vom DBMR-Forschungsteam verwendet wird, ist die Datentriangulation, die Data Mining, die Analyse der Auswirkungen von Datenvariablen auf den Markt und die primäre (Branchenexperten-)Validierung umfasst. Zu den Datenmodellen gehören ein Lieferantenpositionierungsraster, eine Marktzeitlinienanalyse, ein Marktüberblick und -leitfaden, ein Firmenpositionierungsraster, eine Patentanalyse, eine Preisanalyse, eine Firmenmarktanteilsanalyse, Messstandards, eine globale versus eine regionale und Lieferantenanteilsanalyse. Um mehr über die Forschungsmethodik zu erfahren, senden Sie eine Anfrage an unsere Branchenexperten.
Anpassung möglich
Data Bridge Market Research ist ein führendes Unternehmen in der fortgeschrittenen formativen Forschung. Wir sind stolz darauf, unseren bestehenden und neuen Kunden Daten und Analysen zu bieten, die zu ihren Zielen passen. Der Bericht kann angepasst werden, um Preistrendanalysen von Zielmarken, Marktverständnis für zusätzliche Länder (fordern Sie die Länderliste an), Daten zu klinischen Studienergebnissen, Literaturübersicht, Analysen des Marktes für aufgearbeitete Produkte und Produktbasis einzuschließen. Marktanalysen von Zielkonkurrenten können von technologiebasierten Analysen bis hin zu Marktportfoliostrategien analysiert werden. Wir können so viele Wettbewerber hinzufügen, wie Sie Daten in dem von Ihnen gewünschten Format und Datenstil benötigen. Unser Analystenteam kann Ihnen auch Daten in groben Excel-Rohdateien und Pivot-Tabellen (Fact Book) bereitstellen oder Sie bei der Erstellung von Präsentationen aus den im Bericht verfügbaren Datensätzen unterstützen.

