Mercado europeo de tecnología de conferencias portátil: tendencias de la industria y pronóstico hasta 2029

Solicitud de índiceSolicitud de índice Hable con el analistaHable con el analista Informe de muestra gratuitoInforme de muestra gratuito Consultar antes de comprarConsultar antes Comprar ahoraComprar ahora

Mercado europeo de tecnología de conferencias portátil: tendencias de la industria y pronóstico hasta 2029

  • ICT
  • Published Report
  • Jan 2022
  • Europe
  • 350 Páginas
  • Número de tablas: 284
  • Número de figuras: 25
  • Author : Megha Gupta

Supera los desafíos arancelarios con una consultoría ágil de la cadena de suministro

El análisis del ecosistema de la cadena de suministro ahora forma parte de los informes de DBMR

Mercado europeo de tecnología de conferencias portátiles, por oferta (hardware, software y servicios), tipo de conferencia ( audioconferencia y videoconferencia ), modo de implementación (local y en la nube ), tamaño de la organización (pequeña y mediana organización y gran organización), aplicación (consumidor y empresa), uso final (corporativo, educación, atención médica, gobierno y defensa, banca, servicios financieros y seguros (BSFI), medios y entretenimiento y otros), país (Alemania, Reino Unido, Francia, Italia, España, Rusia, Países Bajos, Bélgica, Suiza, Turquía y resto de Europa), tendencias de la industria y pronóstico hasta 2029

Mercado europeo de tecnología de conferencias portátil

Análisis y perspectivas del mercado : mercado europeo de tecnología de conferencias portátil

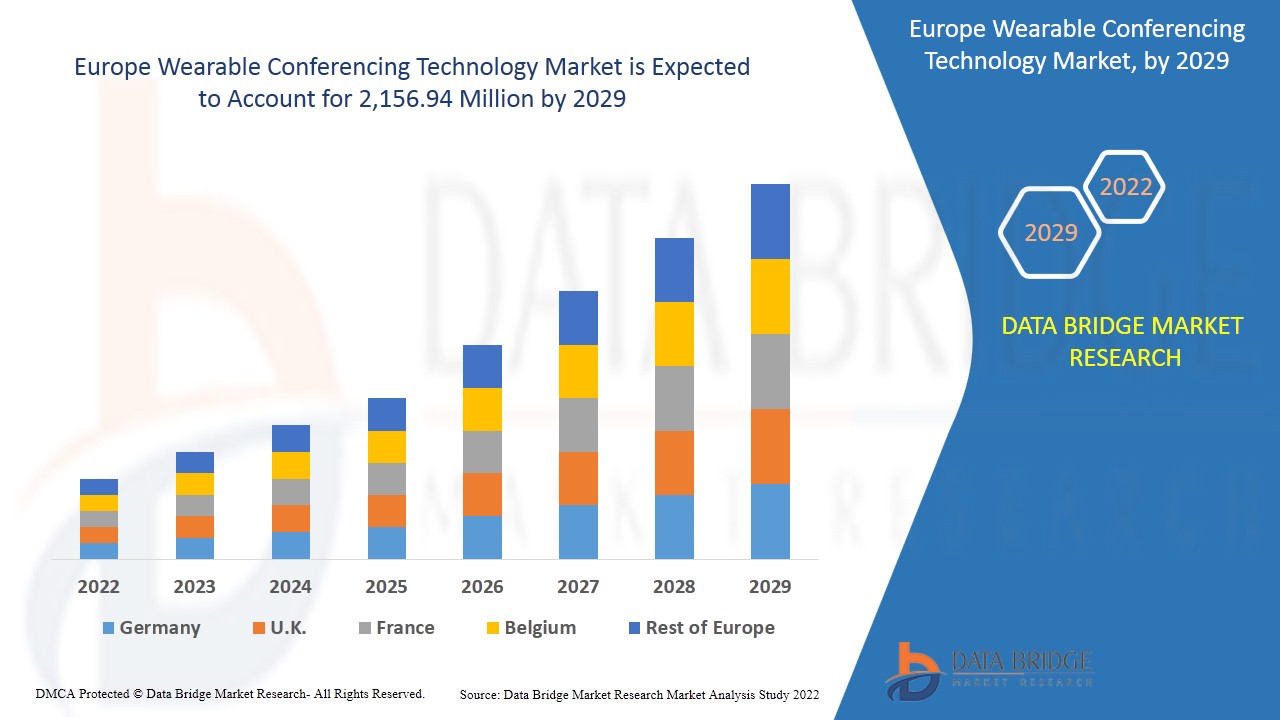
Se espera que el mercado europeo de tecnología de conferencias portátil gane crecimiento de mercado en el período de pronóstico de 2022 a 2029. Data Bridge Market Research analiza que el mercado está creciendo con una CAGR del 12,7% en el período de pronóstico de 2022 a 2029 y se espera que alcance los USD 2156,94 millones para 2029. El creciente enfoque y la adopción de la cultura del trabajo remoto están impulsando el mercado europeo de tecnología de conferencias portátil.

La tecnología portátil, a menudo conocida como "wearables", es una clase de dispositivos electrónicos que se pueden llevar sobre el cuerpo. Los gadgets son dispositivos de manos libres con aplicaciones prácticas que funcionan con microprocesadores y tienen la capacidad de enviar y recibir datos a través de Internet. La cooperación en tiempo real entre varios dispositivos es posible con las soluciones de conferencias. Los participantes pueden unirse a un único lugar digital utilizando sus dispositivos móviles, portátiles o computadoras personales (PC) mediante una plataforma de conferencias. Los usuarios pueden utilizar una conexión a Internet para acceder a tecnologías de conferencias que se suministran como software como servicio (SaaS). Una plataforma de conferencias web también se puede suministrar localmente, utilizando las capacidades del centro de datos de una organización. Por lo tanto, es una tecnología que se utiliza en dispositivos como Google Glasses o Microsoft HoloLens para la aplicación de conferencias y colaboración a través de medios de audio o vídeo. Actualmente, este mercado tiene amplias aplicaciones en el mundo corporativo para colaboraciones profesionales y en los sectores educativos y de formación.

El creciente interés y la adopción de una cultura de trabajo a distancia actúan como un factor impulsor del mercado europeo de tecnología de conferencias con dispositivos portátiles. La naturaleza intermitente de la energía eólica ha demostrado ser un desafío. Sin embargo, se espera que el aumento de diversas decisiones estratégicas, como las asociaciones, brinde oportunidades para el mercado europeo de tecnología de conferencias con dispositivos portátiles. El alto costo de la infraestructura para conferencias puede resultar un freno para el mercado.

El informe sobre el mercado de tecnología de conferencias portátil en Europa proporciona detalles sobre la participación de mercado, los nuevos desarrollos y el análisis de la cartera de productos, el impacto de los actores del mercado nacional y localizado, analiza las oportunidades en términos de segmentos de ingresos emergentes, cambios en las regulaciones del mercado, aprobaciones de productos, decisiones estratégicas, lanzamientos de productos, expansiones geográficas e innovaciones tecnológicas en el mercado. Para comprender el análisis y el escenario del mercado de tecnología de conferencias portátil en Europa, comuníquese con Data Bridge Market Research para obtener un informe de analista; nuestro equipo lo ayudará a crear una solución de impacto en los ingresos para lograr su objetivo deseado.

Mercado europeo de tecnología de conferencias portátil

Alcance y tamaño del mercado de tecnología de conferencias portátil en Europa

El mercado europeo de tecnología de conferencias portátil está segmentado en función de la oferta, el tipo de conferencia, el modo de implementación, el tamaño de la organización, la aplicación y el uso final. El crecimiento entre segmentos le ayuda a analizar nichos de crecimiento y estrategias para abordar el mercado y determinar sus áreas de aplicación principales y la diferencia en sus mercados objetivo.

  • Según la oferta, el mercado europeo de tecnología de conferencias portátil se segmenta en hardware, software y servicios. El hardware se subdivide en cámaras, micrófonos y otros. Además, los servicios se subdividen en servicios gestionados y servicios profesionales. En 2022, se espera que el hardware domine el mercado europeo de tecnología de conferencias portátil, ya que ofrece funciones como colaboraciones en directo en la fabricación y proporciona una plataforma para ejecutar el software.
  • Según el tipo de conferencia, el mercado europeo de tecnología de conferencias portátiles se segmenta en audioconferencias y videoconferencias . En 2022, se espera que el segmento de las videoconferencias domine, ya que ofrece reuniones virtuales y colaboración a nivel mundial, lo que mejora el alcance de la empresa para realizar mejor las reuniones con ayuda visual.
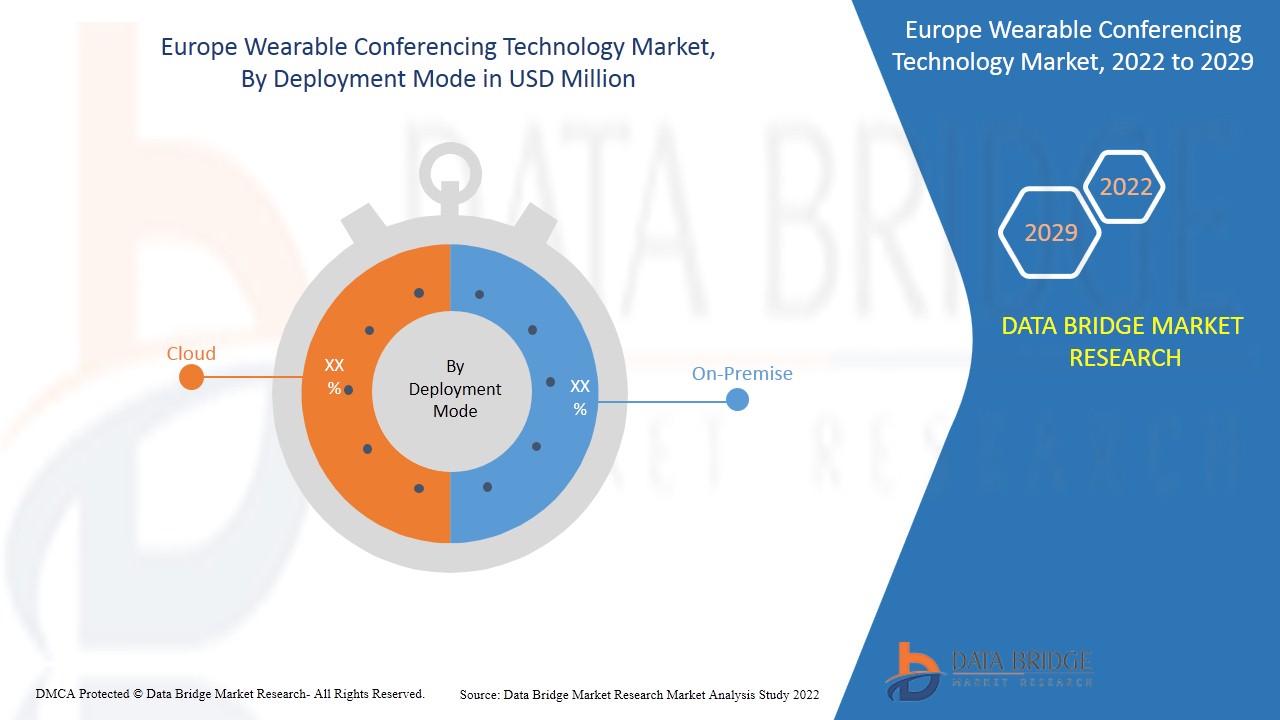
  • Según el modo de implementación, el mercado europeo de tecnología de conferencias portátil se segmenta en local y en la nube. En 2022, se prevé que el segmento local domine el mercado, ya que ayuda a brindar seguridad y privacidad a la infraestructura de la empresa. También ayuda a grabar videos de forma segura para futuras referencias, lo que aumenta su demanda en el mercado.
  • Según el tamaño de la organización, el mercado europeo de tecnología de conferencias portátil se segmenta en pequeñas y medianas organizaciones y grandes organizaciones. En 2022, se prevé que el segmento de las grandes organizaciones domine el mercado, ya que la solución ayuda a la empresa a avanzar de manera más eficiente hacia sus objetivos mejorando la productividad y optimizando las operaciones.
  • Según la aplicación, el mercado europeo de tecnología de conferencias portátil se segmenta en consumidores y empresas. En 2022, se prevé que el segmento empresarial domine el mercado, ya que la solución ayuda a los empleados a trabajar de forma remota con facilidad y a completar sus operaciones empresariales.
  • Según el uso final, el mercado europeo de tecnología de conferencias ponible se segmenta en corporativo, educación, atención médica , gobierno y defensa, banca, servicios financieros y seguros (BSFI), medios y entretenimiento, entre otros. Todos los segmentos se subdividen a su vez por modo de implementación y tamaño de la organización. El modo de implementación incluye las instalaciones locales y la nube. El tamaño de la organización incluye organizaciones pequeñas y medianas y organizaciones grandes. En 2022, se prevé que el segmento corporativo domine el mercado, ya que las soluciones de conferencias ayudan a los empleados a colaborar y trabajar en proyectos con eficiencia y en tiempo real.     

Análisis a nivel de país del mercado europeo de tecnología de conferencias portátil

Se analiza el mercado europeo de tecnología de conferencias portátiles y el tamaño del mercado que ofrece, el tipo de conferencia, el modo de implementación, el tamaño de la organización, la aplicación y el uso final como se mencionó anteriormente.

Los países incluidos en el informe sobre el mercado europeo de tecnología de conferencias portátil son Alemania, Reino Unido, Francia, Italia, España, Rusia, Países Bajos, Bélgica, Suiza, Turquía y el resto de Europa. Alemania domina el mercado europeo de tecnología de conferencias portátil debido a la alta demanda de las grandes empresas que tienen instalaciones de fabricación remotas repartidas por todo el mundo y requieren asistencia remota. El Reino Unido ocupa el segundo lugar con la creciente demanda de nuevas aplicaciones como la atención sanitaria y la educación para proporcionar formación de forma remota. Francia ocupa el tercer lugar con la investigación tecnológica en la industria de la atención sanitaria y la demanda en las instalaciones de fabricación remotas.

La sección de países del informe también proporciona factores de impacto individuales en el mercado y cambios en la regulación en el mercado a nivel nacional que afectan las tendencias actuales y futuras del mercado. Los puntos de datos como nuevas ventas, ventas de reemplazo, demografía del país, leyes regulatorias y aranceles de importación y exportación son algunos de los principales indicadores utilizados para pronosticar el escenario del mercado para países individuales. Además, la presencia y disponibilidad de marcas europeas y sus desafíos enfrentados debido a la competencia grande o escasa de las marcas locales y nacionales, el impacto de los canales de venta se consideran al proporcionar un análisis de pronóstico de los datos del país.

La creciente penetración de dispositivos inteligentes y servicios de Internet está impulsando el crecimiento del mercado europeo de tecnología de conferencias portátil

El mercado europeo de tecnología de conferencias portátil también le ofrece un análisis detallado del mercado para el crecimiento de cada país en un mercado en particular. Además, proporciona información detallada sobre la estrategia de los actores del mercado y su presencia geográfica. Los datos están disponibles para el período histórico de 2011 a 2020.

Análisis del panorama competitivo y de la cuota de mercado de la tecnología de conferencias portátil en Europa

El panorama competitivo del mercado europeo de tecnología de conferencias portátil ofrece información detallada por competidor. Los detalles incluidos son una descripción general de la empresa, las finanzas de la empresa, los ingresos generados, el potencial de mercado, la inversión en investigación y desarrollo, las nuevas iniciativas de mercado, los sitios e instalaciones de producción, las fortalezas y debilidades de la empresa, el lanzamiento de productos, los procesos de prueba de productos, las aprobaciones de productos, las patentes, la amplitud y la extensión de los productos, el dominio de las aplicaciones y la curva de supervivencia de la tecnología. Los puntos de datos anteriores proporcionados solo están relacionados con el enfoque de la empresa en relación con el mercado europeo de tecnología de conferencias portátil.

Las principales empresas que se dedican a la tecnología de conferencias portátil en Europa son Logitech, Vuzix Corporation, Vidyo, Inc., Ricoh, Zoom Video Communications, Inc., Microsoft, LogMeIn, Inc., RealWear, Inc., DIALPAD, INC., Google (una subsidiaria de Alphabet Inc.), Chironix, Seiko Epson Corporation, Iristick, Robert Bosch GmbH, ezTalks, HTC Corporation, Sony Corporation, Lenovo, EON Reality, TeamViewer, entre otras empresas nacionales. Los analistas de DBMR comprenden las fortalezas competitivas y brindan un análisis competitivo para cada competidor por separado.

Numerosos contratos y acuerdos son iniciados también por empresas de todo el mundo, lo que acelera el mercado europeo de tecnología de conferencias portátil.

Por ejemplo,

  • En octubre de 2021, LogMeIn, Inc. lanzó GoToConnect Legal, una nueva versión de su plataforma de comunicaciones unificadas como servicio (UCaaS). La plataforma está diseñada para satisfacer las demandas de los profesionales del derecho al facilitar la colaboración con clientes y colegas con el fin de maximizar las horas facturables. La solución permitirá minimizar el tiempo no facturado, maximizar los ingresos, gestionar las regulaciones de los organismos gubernamentales y mantener una alta seguridad en su práctica. De esta forma, la empresa ayudará a brindar servicios de alta calidad y fácilmente facturables a sus clientes.
  • En diciembre de 2021, Vidyo, Inc. presentó nuevas interfaces de VidyoRoom Solutions, incluidas tres nuevas experiencias de videoconferencia en la oficina diseñadas para brindar el mejor entorno de colaboración para equipos híbridos. Las nuevas interfaces para salas de reuniones pequeñas, salas de reuniones y salas de juntas, que incluyen controles de conferencias y soporte para experiencias inmersivas, serán cada vez más vitales a medida que los empleados intenten regresar a la oficina después de la pandemia, mientras que otros continúan trabajando de forma remota. Con esto, la empresa podrá brindar una experiencia fácil de usar a sus clientes.


SKU-

Obtenga acceso en línea al informe sobre la primera nube de inteligencia de mercado del mundo

  • Panel de análisis de datos interactivo
  • Panel de análisis de empresas para oportunidades con alto potencial de crecimiento
  • Acceso de analista de investigación para personalización y consultas
  • Análisis de la competencia con panel interactivo
  • Últimas noticias, actualizaciones y análisis de tendencias
  • Aproveche el poder del análisis de referencia para un seguimiento integral de la competencia
Solicitud de demostración

Tabla de contenido

  1. introduction
    1. OBJECTIVES OF THE STUDY
    2. MARKET DEFINITION
    3. OVERVIEW OF Europe Wearable conferencing technology Market
    4. Currency and Pricing
    5. LIMITATIONS
    6. MARKETS COVERED
  2. MARKET SEGMENTATION
    1. MARKETS COVERED
    2. geographicAL scope
    3. years considered for the study
    4. DBMR TRIPOD DATA VALIDATION MODEL
    5. primary interviews with key opinion leaders
    6. DBMR MARKET POSITION GRID
    7. vendor share analysis
    8. Multivariate Modeling
    9. type timeline curve
    10. MARKET APPLICATION COVERAGE GRID
    11. secondary sourcEs
    12. assumptions
  3. EXECUTIVE SUMMARY
  4. premium insights
  5. market overview
    1. drivers
      1. surging focus and adoption of remote working culture
      2. INCREASING PENETRATION OF SMART DEVICES AND INTERNET SERVICES
      3. RISE IN ADOPTION OF conferencing technology BY EDUCATIONAL INSTITUTES
    2. RESTRAINTS
      1. high cost of conferencing infrastructure
      2. LOSS OF DATA AND PRIVACY
    3. OPPORTUNITIES
      1. INCREASE IN VARIOUS STRATEGIC DECISIONS SUCH AS PARTNERSHIP AND ACQUISITION
      2. RISE IN Initiatives by government
    4. Challenges
      1. EUROPE ECONOMIC SLOWDOWN LIMITS
      2. Electronic components are pushing smart glasses boundAries
  6. IMPACT ANALYSIS OF COVID-19 on Europe Wearable conferencing technology market
    1. ANALYSIS ON IMPACT OF COVID-19 ON THE MARKET
    2. Strategic decision by manufacturers and government initiatives after covid-19
    3. Impact on demand
    4. PRICE IMPACT
    5. Impact on supply chain
    6. Conclusion
  7. Europe Wearable conferencing technology Market, BY offering
    1. overview
    2. Hardware
      1. Camera
      2. Microphone
      3. Others
    3. Software
    4. Services
      1. Managed Services
      2. Professional Services
  8. Europe Wearable conferencing technology Market, BY conferencing type
    1. overview
    2. Video Conferencing
    3. Audio Conferencing
  9. Europe Wearable conferencing technology Market, BY deployment mode
    1. overview
    2. on-premise
    3. cloud
  10. Europe Wearable conferencing technology Market, BY organization size
    1. overview
    2. large organization
    3. small & medium organization
  11. Europe Wearable conferencing technology Market, BY application
    1. overview
    2. enterprise
    3. consumer
  12. Europe Wearable conferencing technology Market, BY end use
    1. overview
    2. Corporate
      1. Market By deployment mode
        1. ON-PREMISE
        2. CLOUD
      2. Market By organization size
        1. LARGE ORGANIZATION
        2. SMALL & MEDIUM ORGANIZATION
    3. Education
      1. MARKET BY DEPLOYMENT MODE
        1. ON-PREMISE
        2. CLOUD
      2. MARKET BY organization size
        1. LARGE ORGANIZATION
        2. SMALL & MEDIUM ORGANIZATION
    4. Healthcare
      1. MARKET BY DEPLOYMENT MODE
        1. ON-PREMISE
        2. CLOUD
      2. MARKET BY organization size
        1. LARGE ORGANIZATION
        2. SMALL & MEDIUM ORGANIZATION
    5. Government and Defense
      1. MARKET BY DEPLOYMENT MODE
        1. ON-PREMISE
        2. CLOUD
      2. MARKET BY organization size
        1. LARGE ORGANIZATION
        2. SMALL & MEDIUM ORGANIZATION
    6. Media and Entertainment
      1. MARKET BY DEPLOYMENT MODE
        1. ON-PREMISE
        2. CLOUD
      2. MARKET BY organization size
        1. LARGE ORGANIZATION
        2. SMALL & MEDIUM ORGANIZATION
    7. Banking, Financial Services and Insurance (BFSI)
      1. MARKET BY DEPLOYMENT MODE
        1. ON-PREMISE
        2. CLOUD
      2. MARKET BY organization size
        1. LARGE ORGANIZATION
        2. SMALL & MEDIUM ORGANIZATION
    8. Other
      1. MARKET BY DEPLOYMENT MODE
        1. ON-PREMISE
        2. CLOUD
      2. MARKET BY organization size
        1. LARGE ORGANIZATION
        2. SMALL & MEDIUM ORGANIZATION
  13. Europe Wearable conferencing technology Market, by REGION
    1. EUROPE
      1. germany
      2. u.k.
      3. france
      4. italy
      5. spain
      6. russia
      7. netherlands
      8. belgium
      9. switzerland
      10. turkey
      11. rest of europe
  14. EUROPE Wearable conferencing technology market: COMPANY landscape
    1. company share analysis: EUROPE
  15. swot analysis
  16. Company profile
    1. GOOGLE (A SUBSIDIARY OF ALPHABET INC.)
      1. COMPANY SNAPSHOT
      2. REVENUE ANALYSIS
      3. company share analysis
      4. PRODUCT PORTFOLIO
      5. RECENT DEVELOPMENTS
    2. MICROSOFT
      1. COMPANY SNAPSHOT
      2. REVENUE ANALYSIS
      3. company share analysis
      4. PRODUCT PORTFOLIO
      5. RECENT DEVELOPMENTS
    3. LENEVO
      1. COMPANY SNAPSHOT
      2. REVENUE ANALYSIS
      3. company share analysis
      4. PRODUCT PORTFOLIO
      5. RECENT DEVELOPMENT
    4. RICOH
      1. COMPANY SNAPSHOT
      2. REVENUE ANALYSIS
      3. company share analysis
      4. PRODUCT PORTFOLIO
      5. RECENT DEVELOPMENTS
    5. SEIKO EPSON CORPORATION
      1. COMPANY SNAPSHOT
      2. REVENUE ANALYSIS
      3. PRODUCT PORTFOLIO
      4. RECENT DEVELOPMENTS
    6. CHIRONIX
      1. COMPANY SNAPSHOT
      2. PRODUCT PORTFOLIO
      3. RECENT DEVELOPMENT
    7. DIALPAD, INC.
      1. COMPANY SNAPSHOT
      2. PRODUCT PORTFOLIO
      3. RECENT DEVELOPMENT
    8. EON REALITY
      1. COMPANY SNAPSHOT
      2. PRODUCT PORTFOLIO
      3. RECENT DEVELOPMENTS
    9. EZTALKS
      1. COMPANY SNAPSHOT
      2. PRODUCT PORTFOLIO
      3. RECENT DEVELOPMENT
    10. HTC CORPORATION
      1. COMPANY PROFILE
      2. REVENUE ANALYSIS
      3. PRODUCT PORTFOLIO
      4. RECENT DEVELOPMENTS
    11. IRISTICK
      1. COMPANY SNAPSHOT
      2. PRODUCT PORTFOLIO
      3. RECENT DEVELOPMENT
    12. LOGITECH
      1. COMPANY SNAPSHOT
      2. REVENUE ANALYSIS
      3. PRODUCT PORTFOLIO
      4. RECENT DEVELOPMENTS
    13. LOGMEIN, INC.
      1. COMPANY SNAPSHOT
      2. PRODUCT PORTFOLIO
      3. RECENT DEVELOPMENTS
    14. REALWEAR, INC.
      1. COMPANY SNAPSHOT
      2. PRODUCT PORTFOLIO
      3. RECENT DEVELOPMENT
    15. ROBERT BOSCH GMBH
      1. COMPANY SNAPSHOT
      2. REVENUE ANALYSIS
      3. PRODUCT PORTFOLIO
      4. RECENT DEVELOPMENT
    16. SONY CORPORATION
      1. COMPANY SNAPSHOT
      2. REVENUE ANALYSIS
      3. PRODUCT PORTFOLIO
      4. RECENT DEVELOPMENTS
    17. TEAMVIEWER
      1. COMPANY SNAPSHOT
      2. REVNUE ANALYSIS
      3. PRODUCT PORTFOLIO
      4. RECENT DEVELOPMENTS
    18. VIDYO, INC.
      1. COMPANY SNAPSHOT
      2. PRODUCT PORTFOLIO
      3. RECENT DEVELOPMENTS
    19. VUZIX CORPORATION
      1. COMPANY SNAPSHOT
      2. REVENUE ANALYSIS
      3. PRODUCT PORTFOLIO
      4. RECENT DEVELOPMENT
    20. ZOOM VIDEO COMMUNICATIONS, INC.
      1. COMPANY SNAPSHOT
      2. REVENUE ANALYSIS
      3. company share analysis
      4. PRODUCT PORTFOLIO
      5. RECENT DEVELOPMENTS
  17. questionnaire
  18. related reports

Lista de Tablas

TABLE 1 Europe Wearable conferencing technology Market, BY offering, 2020-2029 (USD Million)

TABLE 2 Europe Hardware in wearable conferencing technology Market, By region, 2020-2029 (USD Million)

TABLE 3 Europe Hardware in wearable conferencing technology Market, By Type, 2020-2029 (USD Million)

TABLE 4 Europe Software in wearable conferencing technology Market, By region, 2020-2029 (USD Million)

TABLE 5 Europe Services in wearable conferencing technology Market, By region, 2020-2029 (USD Million)

TABLE 6 Europe Services in wearable conferencing technology Market, By Type, 2020-2029 (USD Million)

TABLE 7 Europe Wearable conferencing technology Market, BY conferencing type, 2020-2029 (USD Million)

TABLE 8 Europe Video Conferencing in wearable conferencing technology Market, By region, 2020-2029 (USD Million)

TABLE 9 Europe Audio Conferencing in wearable conferencing technology Market, By region, 2020-2029 (USD Million)

TABLE 10 Europe Wearable conferencing technology Market, BY deployment mode, 2020-2029 (USD Million)

TABLE 11 Europe on-premise in wearable conferencing technology Market, By region, 2020-2029 (USD Million)

TABLE 12 Europe cloud in wearable conferencing technology Market, By region, 2020-2029 (USD Million)

TABLE 13 Europe Wearable conferencing technology Market, BY organization size, 2020-2029 (USD Million)

TABLE 14 Europe large organization in wearable conferencing technology Market, By region, 2020-2029 (USD Million)

TABLE 15 Europe small & medium organization in wearable conferencing technology Market, By Region, 2020-2029 (USD Million)

TABLE 16 Europe Wearable conferencing technology Market, BY application, 2020-2029 (USD Million)

TABLE 17 Europe enterprise in wearable conferencing technology Market, By region, 2020-2029 (USD Million)

TABLE 18 Europe consumer in wearable conferencing technology Market, By region, 2020-2029 (USD Million)

TABLE 19 Europe Wearable conferencing technology Market, BY end use, 2020-2029 (USD Million)

TABLE 20 Europe Corporate in wearable conferencing technology Market, By region, 2020-2029 (USD Million)

TABLE 21 Europe Corporate in wearable conferencing technology Market, By Deployment Mode, 2020-2029 (USD Million)

TABLE 22 Europe Corporate in wearable conferencing technology Market, By Organization Size, 2020-2029 (USD Million)

TABLE 23 Europe Education in wearable conferencing technology Market, By region, 2020-2029 (USD Million)

TABLE 24 Europe Education in wearable conferencing technology Market, By Deployment Mode, 2020-2029 (USD Million)

TABLE 25 Europe Education in wearable conferencing technology Market, By Organization Size, 2020-2029 (USD Million)

TABLE 26 Europe Healthcare in wearable conferencing technology Market, By region, 2020-2029 (USD Million)

TABLE 27 Europe Healthcare in wearable conferencing technology Market, By deployment mode, 2020-2029 (USD Million)

TABLE 28 Europe Healthcare in wearable conferencing technology Market, By organization size, 2020-2029 (USD Million)

TABLE 29 Europe Government and Defense in wearable conferencing technology Market, By region, 2020-2029 (USD Million)

TABLE 30 Europe Government and Defense in wearable conferencing technology Market, By deployment mode, 2020-2029 (USD Million)

TABLE 31 Europe Government and Defense in wearable conferencing technology Market, By organization size, 2020-2029 (USD Million)

TABLE 32 Europe Media and Entertainment in wearable conferencing technology Market, By region, 2020-2029 (USD Million)

TABLE 33 Europe Media and Entertainment in wearable conferencing technology Market, By Deployment Mode, 2020-2029 (USD Million)

TABLE 34 Europe Media and Entertainment in wearable conferencing technology Market, By Organization Size, 2020-2029 (USD Million)

TABLE 35 Europe Banking, Financial Services and Insurance (BFSI) in wearable conferencing technology Market, By region, 2020-2029 (USD Million)

TABLE 36 Europe Banking, Financial Services and Insurance (BFSI) in wearable conferencing technology Market, By deployment mode, 2020-2029 (USD Million)

TABLE 37 Europe Banking, Financial Services and Insurance (BFSI) in wearable conferencing technology Market, By organization size, 2020-2029 (USD Million)

TABLE 38 Europe Other in wearable conferencing technology Market, By region, 2020-2029 (USD Million)

TABLE 39 Europe Other in wearable conferencing technology Market, By deployment mode, 2020-2029 (USD Million)

TABLE 40 Europe Other in wearable conferencing technology Market, By Organization Size, 2020-2029 (USD Million)

TABLE 41 Europe Wearable Conferencing Technology Market, By Country, 2020-2029 (USD Million)

TABLE 42 Europe Wearable Conferencing Technology Market, By offering, 2020-2029 (USD Million)

TABLE 43 Europe hardware in Wearable Conferencing Technology Market, By Type, 2020-2029 (USD Million)

TABLE 44 Europe Services in Wearable Conferencing Technology Market, By type, 2020-2029 (USD Million)

TABLE 45 Europe Wearable Conferencing Technology Market, By Conferencing type, 2020-2029 (USD Million)

TABLE 46 Europe Wearable Conferencing Technology Market, By deployment mode, 2020-2029 (USD Million)

TABLE 47 Europe Wearable Conferencing Technology Market, By organization size, 2020-2029 (USD Million)

TABLE 48 Europe Wearable Conferencing Technology Market, By application, 2020-2029 (USD Million)

TABLE 49 Europe Wearable Conferencing Technology Market, By end use, 2020-2029 (USD Million)

TABLE 50 Europe corporate in Wearable Conferencing Technology Market, By deployment mode, 2020-2029 (USD Million)

TABLE 51 Europe corporate in Wearable Conferencing Technology Market, By organization size, 2020-2029 (USD Million)

TABLE 52 Europe education in Wearable Conferencing Technology Market, By deployment mode, 2020-2029 (USD Million)

TABLE 53 Europe education in Wearable Conferencing Technology Market, By organization size, 2020-2029 (USD Million)

TABLE 54 Europe healthcare in Wearable Conferencing Technology Market, By deployment mode, 2020-2029 (USD Million)

TABLE 55 Europe healthcare in Wearable Conferencing Technology Market, By organization size, 2020-2029 (USD Million)

TABLE 56 Europe government and defense in Wearable Conferencing Technology Market, By deployment mode, 2020-2029 (USD Million)

TABLE 57 Europe government and defense in Wearable Conferencing Technology Market, By organization size, 2020-2029 (USD Million)

TABLE 58 Europe media and entertainment in Wearable Conferencing Technology Market, By deployment mode, 2020-2029 (USD Million)

TABLE 59 Europe media and entertainment in Wearable Conferencing Technology Market, By organization size, 2020-2029 (USD Million)

TABLE 60 Europe banking, financial services and insurance (Bfsi) in Wearable Conferencing Technology Market, By deployment mode, 2020-2029 (USD Million)

TABLE 61 Europe BANKING, FINANCIAL SERVICES AND INSURANCE (BFSI) in Wearable Conferencing Technology Market, By organization size, 2020-2029 (USD Million)

TABLE 62 Europe other in Wearable Conferencing Technology Market, By deployment mode, 2020-2029 (USD Million)

TABLE 63 Europe other in Wearable Conferencing Technology Market, By organization size, 2020-2029 (USD Million)

TABLE 64 germany Wearable Conferencing Technology Market, By offering, 2020-2029 (USD Million)

TABLE 65 GERMANY hardware in Wearable Conferencing Technology Market, By Type, 2020-2029 (USD Million)

TABLE 66 GERMANY Services in Wearable Conferencing Technology Market, By type, 2020-2029 (USD Million)

TABLE 67 GERMANY Wearable Conferencing Technology Market, By Conferencing type, 2020-2029 (USD Million)

TABLE 68 GERMANY Wearable Conferencing Technology Market, By deployment mode, 2020-2029 (USD Million)

TABLE 69 GERMANY Wearable Conferencing Technology Market, By organization size, 2020-2029 (USD Million)

TABLE 70 GERMANY Wearable Conferencing Technology Market, By application, 2020-2029 (USD Million)

TABLE 71 GERMANY Wearable Conferencing Technology Market, By end use, 2020-2029 (USD Million)

TABLE 72 GERMANY corporate in Wearable Conferencing Technology Market, By deployment mode, 2020-2029 (USD Million)

TABLE 73 GERMANY corporate in Wearable Conferencing Technology Market, By organization size, 2020-2029 (USD Million)

TABLE 74 GERMANY education in Wearable Conferencing Technology Market, By deployment mode, 2020-2029 (USD Million)

TABLE 75 GERMANY education in Wearable Conferencing Technology Market, By organization size, 2020-2029 (USD Million)

TABLE 76 GERMANY healthcare in Wearable Conferencing Technology Market, By deployment mode, 2020-2029 (USD Million)

TABLE 77 GERMANY healthcare in Wearable Conferencing Technology Market, By organization size, 2020-2029 (USD Million)

TABLE 78 GERMANY government and defense in Wearable Conferencing Technology Market, By deployment mode, 2020-2029 (USD Million)

TABLE 79 GERMANY government and defense in Wearable Conferencing Technology Market, By organization size, 2020-2029 (USD Million)

TABLE 80 GERMANY media and entertainment in Wearable Conferencing Technology Market, By deployment mode, 2020-2029 (USD Million)

TABLE 81 GERMANY media and entertainment in Wearable Conferencing Technology Market, By organization size, 2020-2029 (USD Million)

TABLE 82 GERMANY banking, financial services and insurance (Bfsi) in Wearable Conferencing Technology Market, By deployment mode, 2020-2029 (USD Million)

TABLE 83 GERMANY BANKING, FINANCIAL SERVICES AND INSURANCE (BFSI) in Wearable Conferencing Technology Market, By organization size, 2020-2029 (USD Million)

TABLE 84 GERMANY other in Wearable Conferencing Technology Market, By deployment mode, 2020-2029 (USD Million)

TABLE 85 GERMANY Other in Wearable Conferencing Technology Market, By organization size, 2020-2029 (USD Million)

TABLE 86 U.K. Wearable Conferencing Technology Market, By offering, 2020-2029 (USD Million)

TABLE 87 U.K. hardware in Wearable Conferencing Technology Market, By Type, 2020-2029 (USD Million)

TABLE 88 U.K. Services in Wearable Conferencing Technology Market, By type, 2020-2029 (USD Million)

TABLE 89 U.K. Wearable Conferencing Technology Market, By Conferencing type, 2020-2029 (USD Million)

TABLE 90 U.K. Wearable Conferencing Technology Market, By deployment mode, 2020-2029 (USD Million)

TABLE 91 U.K. Wearable Conferencing Technology Market, By organization size, 2020-2029 (USD Million)

TABLE 92 U.K. Wearable Conferencing Technology Market, By application, 2020-2029 (USD Million)

TABLE 93 U.K. Wearable Conferencing Technology Market, By end use, 2020-2029 (USD Million)

TABLE 94 U.K. corporate in Wearable Conferencing Technology Market, By deployment mode, 2020-2029 (USD Million)

TABLE 95 U.K. corporate in Wearable Conferencing Technology Market, By organization size, 2020-2029 (USD Million)

TABLE 96 U.K. education in Wearable Conferencing Technology Market, By deployment mode, 2020-2029 (USD Million)

TABLE 97 U.K. education in Wearable Conferencing Technology Market, By organization size, 2020-2029 (USD Million)

TABLE 98 U.K. healthcare in Wearable Conferencing Technology Market, By deployment mode, 2020-2029 (USD Million)

TABLE 99 U.K. healthcare in Wearable Conferencing Technology Market, By organization size, 2020-2029 (USD Million)

TABLE 100 U.K. government and defense in Wearable Conferencing Technology Market, By deployment mode, 2020-2029 (USD Million)

TABLE 101 U.K. government and defense in Wearable Conferencing Technology Market, By organization size, 2020-2029 (USD Million)

TABLE 102 U.K. media and entertainment in Wearable Conferencing Technology Market, By deployment mode, 2020-2029 (USD Million)

TABLE 103 U.K. media and entertainment in Wearable Conferencing Technology Market, By organization size, 2020-2029 (USD Million)

TABLE 104 U.K. banking, financial services and insurance (Bfsi) in Wearable Conferencing Technology Market, By deployment mode, 2020-2029 (USD Million)

TABLE 105 U.K. BANKING, FINANCIAL SERVICES AND INSURANCE (BFSI) in Wearable Conferencing Technology Market, By organization size, 2020-2029 (USD Million)

TABLE 106 U.K. other in Wearable Conferencing Technology Market, By deployment mode, 2020-2029 (USD Million)

TABLE 107 U.K. Other in Wearable Conferencing Technology Market, By organization size, 2020-2029 (USD Million)

TABLE 108 France Wearable Conferencing Technology Market, By offering, 2020-2029 (USD Million)

TABLE 109 France hardware in Wearable Conferencing Technology Market, By Type, 2020-2029 (USD Million)

TABLE 110 France Services in Wearable Conferencing Technology Market, By type, 2020-2029 (USD Million)

TABLE 111 France Wearable Conferencing Technology Market, By Conferencing type, 2020-2029 (USD Million)

TABLE 112 France Wearable Conferencing Technology Market, By deployment mode, 2020-2029 (USD Million)

TABLE 113 France Wearable Conferencing Technology Market, By organization size, 2020-2029 (USD Million)

TABLE 114 France Wearable Conferencing Technology Market, By application, 2020-2029 (USD Million)

TABLE 115 France Wearable Conferencing Technology Market, By end use, 2020-2029 (USD Million)

TABLE 116 France corporate in Wearable Conferencing Technology Market, By deployment mode, 2020-2029 (USD Million)

TABLE 117 France corporate in Wearable Conferencing Technology Market, By organization size, 2020-2029 (USD Million)

TABLE 118 France education in Wearable Conferencing Technology Market, By deployment mode, 2020-2029 (USD Million)

TABLE 119 France education in Wearable Conferencing Technology Market, By organization size, 2020-2029 (USD Million)

TABLE 120 France healthcare in Wearable Conferencing Technology Market, By deployment mode, 2020-2029 (USD Million)

TABLE 121 France healthcare in Wearable Conferencing Technology Market, By organization size, 2020-2029 (USD Million)

TABLE 122 France government and defense in Wearable Conferencing Technology Market, By deployment mode, 2020-2029 (USD Million)

TABLE 123 France government and defense in Wearable Conferencing Technology Market, By organization size, 2020-2029 (USD Million)

TABLE 124 France media and entertainment in Wearable Conferencing Technology Market, By deployment mode, 2020-2029 (USD Million)

TABLE 125 France media and entertainment Wearable Conferencing Technology Market, By organization size, 2020-2029 (USD Million)

TABLE 126 France banking, financial services and insurance (Bfsi) in Wearable Conferencing Technology Market, By deployment mode, 2020-2029 (USD Million)

TABLE 127 France BANKING, FINANCIAL SERVICES AND INSURANCE (BFSI) in Wearable Conferencing Technology Market, By organization size, 2020-2029 (USD Million)

TABLE 128 France other in Wearable Conferencing Technology Market, By deployment mode, 2020-2029 (USD Million)

TABLE 129 France Other in Wearable Conferencing Technology Market, By organization size, 2020-2029 (USD Million)

TABLE 130 Italy Wearable Conferencing Technology Market, By offering, 2020-2029 (USD Million)

TABLE 131 Italy hardware in Wearable Conferencing Technology Market, By Type, 2020-2029 (USD Million)

TABLE 132 Italy Services in Wearable Conferencing Technology Market, By type, 2020-2029 (USD Million)

TABLE 133 Italy Wearable Conferencing Technology Market, By Conferencing type, 2020-2029 (USD Million)

TABLE 134 Italy Wearable Conferencing Technology Market, By deployment mode, 2020-2029 (USD Million)

TABLE 135 Italy Wearable Conferencing Technology Market, By organization size, 2020-2029 (USD Million)

TABLE 136 Italy Wearable Conferencing Technology Market, By application, 2020-2029 (USD Million)

TABLE 137 Italy Wearable Conferencing Technology Market, By end use, 2020-2029 (USD Million)

TABLE 138 Italy corporate in Wearable Conferencing Technology Market, By deployment mode, 2020-2029 (USD Million)

TABLE 139 Italy corporate in Wearable Conferencing Technology Market, By organization size, 2020-2029 (USD Million)

TABLE 140 Italy education in Wearable Conferencing Technology Market, By deployment mode, 2020-2029 (USD Million)

TABLE 141 Italy education in Wearable Conferencing Technology Market, By organization size, 2020-2029 (USD Million)

TABLE 142 Italy healthcare in Wearable Conferencing Technology Market, By deployment mode, 2020-2029 (USD Million)

TABLE 143 Italy healthcare in Wearable Conferencing Technology Market, By organization size, 2020-2029 (USD Million)

TABLE 144 Italy government and defense in Wearable Conferencing Technology Market, By deployment mode, 2020-2029 (USD Million)

TABLE 145 Italy government and defense in Wearable Conferencing Technology Market, By organization size, 2020-2029 (USD Million)

TABLE 146 Italy media and entertainment in Wearable Conferencing Technology Market, By deployment mode, 2020-2029 (USD Million)

TABLE 147 Italy media and entertainment in Wearable Conferencing Technology Market, By organization size, 2020-2029 (USD Million)

TABLE 148 Italy banking, financial services and insurance (Bfsi) in Wearable Conferencing Technology Market, By deployment mode, 2020-2029 (USD Million)

TABLE 149 Italy BANKING, FINANCIAL SERVICES AND INSURANCE (BFSI) in Wearable Conferencing Technology Market, By organization size, 2020-2029 (USD Million)

TABLE 150 Italy other in Wearable Conferencing Technology Market, By deployment mode, 2020-2029 (USD Million)

TABLE 151 Italy Other in Wearable Conferencing Technology Market, By organization size, 2020-2029 (USD Million)

TABLE 152 Spain Wearable Conferencing Technology Market, By offering, 2020-2029 (USD Million)

TABLE 153 Spain hardware in Wearable Conferencing Technology Market, By Type, 2020-2029 (USD Million)

TABLE 154 Spain Services in Wearable Conferencing Technology Market, By type, 2020-2029 (USD Million)

TABLE 155 Spain Wearable Conferencing Technology Market, By Conferencing type, 2020-2029 (USD Million)

TABLE 156 Spain Wearable Conferencing Technology Market, By deployment mode, 2020-2029 (USD Million)

TABLE 157 Spain Wearable Conferencing Technology Market, By organization size, 2020-2029 (USD Million)

TABLE 158 Spain Wearable Conferencing Technology Market, By application, 2020-2029 (USD Million)

TABLE 159 Spain Wearable Conferencing Technology Market, By end use, 2020-2029 (USD Million)

TABLE 160 Spain corporate in Wearable Conferencing Technology Market, By deployment mode, 2020-2029 (USD Million)

TABLE 161 Spain corporate in Wearable Conferencing Technology Market, By organization size, 2020-2029 (USD Million)

TABLE 162 Spain education in Wearable Conferencing Technology Market, By deployment mode, 2020-2029 (USD Million)

TABLE 163 Spain education in Wearable Conferencing Technology Market, By organization size, 2020-2029 (USD Million)

TABLE 164 Spain healthcare in Wearable Conferencing Technology Market, By deployment mode, 2020-2029 (USD Million)

TABLE 165 Spain healthcare in Wearable Conferencing Technology Market, By organization size, 2020-2029 (USD Million)

TABLE 166 Spain government and defense in Wearable Conferencing Technology Market, By deployment mode, 2020-2029 (USD Million)

TABLE 167 Spain government and defense in Wearable Conferencing Technology Market, By organization size, 2020-2029 (USD Million)

TABLE 168 Spain media and entertainment in Wearable Conferencing Technology Market, By deployment mode, 2020-2029 (USD Million)

TABLE 169 Spain media and entertainment in Wearable Conferencing Technology Market, By organization size, 2020-2029 (USD Million)

TABLE 170 Spain banking, financial services and insurance (Bfsi) in Wearable Conferencing Technology Market, By deployment mode, 2020-2029 (USD Million)

TABLE 171 Spain BANKING, FINANCIAL SERVICES AND INSURANCE (BFSI) in Wearable Conferencing Technology Market, By organization size, 2020-2029 (USD Million)

TABLE 172 Spain other in Wearable Conferencing Technology Market, By deployment mode, 2020-2029 (USD Million)

TABLE 173 Spain Other in Wearable Conferencing Technology Market, By organization size, 2020-2029 (USD Million)

TABLE 174 Russia Wearable Conferencing Technology Market, By offering, 2020-2029 (USD Million)

TABLE 175 Russia hardware in Wearable Conferencing Technology Market, By Type, 2020-2029 (USD Million)

TABLE 176 Russia Services in Wearable Conferencing Technology Market, By type, 2020-2029 (USD Million)

TABLE 177 Russia Wearable Conferencing Technology Market, By Conferencing type, 2020-2029 (USD Million)

TABLE 178 Russia Wearable Conferencing Technology Market, By deployment mode, 2020-2029 (USD Million)

TABLE 179 Russia Wearable Conferencing Technology Market, By organization size, 2020-2029 (USD Million)

TABLE 180 Russia Wearable Conferencing Technology Market, By application, 2020-2029 (USD Million)

TABLE 181 Russia Wearable Conferencing Technology Market, By end use, 2020-2029 (USD Million)

TABLE 182 Russia corporate in Wearable Conferencing Technology Market, By deployment mode, 2020-2029 (USD Million)

TABLE 183 Russia corporate in Wearable Conferencing Technology Market, By organization size, 2020-2029 (USD Million)

TABLE 184 Russia education in Wearable Conferencing Technology Market, By deployment mode, 2020-2029 (USD Million)

TABLE 185 Russia education in Wearable Conferencing Technology Market, By organization size, 2020-2029 (USD Million)

TABLE 186 Russia healthcare in Wearable Conferencing Technology Market, By deployment mode, 2020-2029 (USD Million)

TABLE 187 Russia healthcare in Wearable Conferencing Technology Market, By organization size, 2020-2029 (USD Million)

TABLE 188 Russia government and defense in Wearable Conferencing Technology Market, By deployment mode, 2020-2029 (USD Million)

TABLE 189 Russia government and defense in Wearable Conferencing Technology Market, By organization size, 2020-2029 (USD Million)

TABLE 190 Russia media and entertainment in Wearable Conferencing Technology Market, By deployment mode, 2020-2029 (USD Million)

TABLE 191 Russia media and entertainment in Wearable Conferencing Technology Market, By organization size, 2020-2029 (USD Million)

TABLE 192 Russia banking, financial services and insurance (Bfsi) in Wearable Conferencing Technology Market, By deployment mode, 2020-2029 (USD Million)

TABLE 193 Russia BANKING, FINANCIAL SERVICES AND INSURANCE (BFSI) in Wearable Conferencing Technology Market, By organization size, 2020-2029 (USD Million)

TABLE 194 Russia other in Wearable Conferencing Technology Market, By deployment mode, 2020-2029 (USD Million)

TABLE 195 Russia Other in Wearable Conferencing Technology Market, By organization size, 2020-2029 (USD Million)

TABLE 196 Netherlands Wearable Conferencing Technology Market, By offering, 2020-2029 (USD Million)

TABLE 197 Netherlands hardware in Wearable Conferencing Technology Market, By Type, 2020-2029 (USD Million)

TABLE 198 Netherlands Services in Wearable Conferencing Technology Market, By type, 2020-2029 (USD Million)

TABLE 199 Netherlands Wearable Conferencing Technology Market, By Conferencing type, 2020-2029 (USD Million)

TABLE 200 Netherlands Wearable Conferencing Technology Market, By deployment mode, 2020-2029 (USD Million)

TABLE 201 Netherlands Wearable Conferencing Technology Market, By organization size, 2020-2029 (USD Million)

TABLE 202 Netherlands Wearable Conferencing Technology Market, By application, 2020-2029 (USD Million)

TABLE 203 Netherlands Wearable Conferencing Technology Market, By end use, 2020-2029 (USD Million)

TABLE 204 Netherlands corporate in Wearable Conferencing Technology Market, By deployment mode, 2020-2029 (USD Million)

TABLE 205 Netherlands corporate in Wearable Conferencing Technology Market, By organization size, 2020-2029 (USD Million)

TABLE 206 Netherlands education in Wearable Conferencing Technology Market, By deployment mode, 2020-2029 (USD Million)

TABLE 207 Netherlands education in Wearable Conferencing Technology Market, By organization size, 2020-2029 (USD Million)

TABLE 208 Netherlands healthcare in Wearable Conferencing Technology Market, By deployment mode, 2020-2029 (USD Million)

TABLE 209 Netherlands healthcare in Wearable Conferencing Technology Market, By organization size, 2020-2029 (USD Million)

TABLE 210 Netherlands government and defense in Wearable Conferencing Technology Market, By deployment mode, 2020-2029 (USD Million)

TABLE 211 Netherlands government and defense in Wearable Conferencing Technology Market, By organization size, 2020-2029 (USD Million)

TABLE 212 Netherlands media and entertainment in Wearable Conferencing Technology Market, By deployment mode, 2020-2029 (USD Million)

TABLE 213 Netherlands media and entertainment in Wearable Conferencing Technology Market, By organization size, 2020-2029 (USD Million)

TABLE 214 Netherlands banking, financial services and insurance (Bfsi) in Wearable Conferencing Technology Market, By deployment mode, 2020-2029 (USD Million)

TABLE 215 Netherlands BANKING, FINANCIAL SERVICES AND INSURANCE (BFSI) in Wearable Conferencing Technology Market, By organization size, 2020-2029 (USD Million)

TABLE 216 Netherlands other in Wearable Conferencing Technology Market, By deployment mode, 2020-2029 (USD Million)

TABLE 217 Netherlands Other in Wearable Conferencing Technology Market, By organization size, 2020-2029 (USD Million)

TABLE 218 Belgium Wearable Conferencing Technology Market, By offering, 2020-2029 (USD Million)

TABLE 219 Belgium hardware in Wearable Conferencing Technology Market, By Type, 2020-2029 (USD Million)

TABLE 220 Belgium Services in Wearable Conferencing Technology Market, By type, 2020-2029 (USD Million)

TABLE 221 Belgium Wearable Conferencing Technology Market, By Conferencing type, 2020-2029 (USD Million)

TABLE 222 Belgium Wearable Conferencing Technology Market, By deployment mode, 2020-2029 (USD Million)

TABLE 223 Belgium Wearable Conferencing Technology Market, By organization size, 2020-2029 (USD Million)

TABLE 224 Belgium Wearable Conferencing Technology Market, By application, 2020-2029 (USD Million)

TABLE 225 Belgium Wearable Conferencing Technology Market, By end use, 2020-2029 (USD Million)

TABLE 226 Belgium corporate in Wearable Conferencing Technology Market, By deployment mode, 2020-2029 (USD Million)

TABLE 227 Belgium corporate in Wearable Conferencing Technology Market, By organization size, 2020-2029 (USD Million)

TABLE 228 Belgium education in Wearable Conferencing Technology Market, By deployment mode, 2020-2029 (USD Million)

TABLE 229 Belgium education in Wearable Conferencing Technology Market, By organization size, 2020-2029 (USD Million)

TABLE 230 Belgium healthcare in Wearable Conferencing Technology Market, By deployment mode, 2020-2029 (USD Million)

TABLE 231 Belgium healthcare in Wearable Conferencing Technology Market, By organization size, 2020-2029 (USD Million)

TABLE 232 Belgium government and defense in Wearable Conferencing Technology Market, By deployment mode, 2020-2029 (USD Million)

TABLE 233 Belgium government and defense in Wearable Conferencing Technology Market, By organization size, 2020-2029 (USD Million)

TABLE 234 Belgium media and entertainment in Wearable Conferencing Technology Market, By deployment mode, 2020-2029 (USD Million)

TABLE 235 Belgium media and entertainment in Wearable Conferencing Technology Market, By organization size, 2020-2029 (USD Million)

TABLE 236 Belgium banking, financial services and insurance (Bfsi) in Wearable Conferencing Technology Market, By deployment mode, 2020-2029 (USD Million)

TABLE 237 Belgium BANKING, FINANCIAL SERVICES AND INSURANCE (BFSI) in Wearable Conferencing Technology Market, By organization size, 2020-2029 (USD Million)

TABLE 238 Belgium other in Wearable Conferencing Technology Market, By deployment mode, 2020-2029 (USD Million)

TABLE 239 Belgium Other in Wearable Conferencing Technology Market, By organization size, 2020-2029 (USD Million)

TABLE 240 Switzerland Wearable Conferencing Technology Market, By offering, 2020-2029 (USD Million)

TABLE 241 Switzerland hardware in Wearable Conferencing Technology Market, By Type, 2020-2029 (USD Million)

TABLE 242 Switzerland Services in Wearable Conferencing Technology Market, By type, 2020-2029 (USD Million)

TABLE 243 Switzerland Wearable Conferencing Technology Market, By Conferencing type, 2020-2029 (USD Million)

TABLE 244 Switzerland Wearable Conferencing Technology Market, By deployment mode, 2020-2029 (USD Million)

TABLE 245 Switzerland Wearable Conferencing Technology Market, By organization size, 2020-2029 (USD Million)

TABLE 246 Switzerland Wearable Conferencing Technology Market, By application, 2020-2029 (USD Million)

TABLE 247 Switzerland Wearable Conferencing Technology Market, By end use, 2020-2029 (USD Million)

TABLE 248 Switzerland corporate in Wearable Conferencing Technology Market, By deployment mode, 2020-2029 (USD Million)

TABLE 249 Switzerland corporate in Wearable Conferencing Technology Market, By organization size, 2020-2029 (USD Million)

TABLE 250 Switzerland education in Wearable Conferencing Technology Market, By deployment mode, 2020-2029 (USD Million)

TABLE 251 Switzerland education in Wearable Conferencing Technology Market, By organization size, 2020-2029 (USD Million)

TABLE 252 Switzerland healthcare in Wearable Conferencing Technology Market, By deployment mode, 2020-2029 (USD Million)

TABLE 253 Switzerland healthcare in Wearable Conferencing Technology Market, By organization size, 2020-2029 (USD Million)

TABLE 254 Switzerland government and defense in Wearable Conferencing Technology Market, By deployment mode, 2020-2029 (USD Million)

TABLE 255 Switzerland government and defense in Wearable Conferencing Technology Market, By organization size, 2020-2029 (USD Million)

TABLE 256 Switzerland media and entertainment in Wearable Conferencing Technology Market, By deployment mode, 2020-2029 (USD Million)

TABLE 257 Switzerland media and entertainment in Wearable Conferencing Technology Market, By organization size, 2020-2029 (USD Million)

TABLE 258 Switzerland banking, financial services and insurance (Bfsi) in Wearable Conferencing Technology Market, By deployment mode, 2020-2029 (USD Million)

TABLE 259 Switzerland BANKING, FINANCIAL SERVICES AND INSURANCE (BFSI) in Wearable Conferencing Technology Market, By organization size, 2020-2029 (USD Million)

TABLE 260 Switzerland other in Wearable Conferencing Technology Market, By deployment mode, 2020-2029 (USD Million)

TABLE 261 Switzerland Other in Wearable Conferencing Technology Market, By organization size, 2020-2029 (USD Million)

TABLE 262 Turkey Wearable Conferencing Technology Market, By offering, 2020-2029 (USD Million)

TABLE 263 Turkey hardware in Wearable Conferencing Technology Market, By Type, 2020-2029 (USD Million)

TABLE 264 Turkey Services in Wearable Conferencing Technology Market, By type, 2020-2029 (USD Million)

TABLE 265 Turkey Wearable Conferencing Technology Market, By Conferencing type, 2020-2029 (USD Million)

TABLE 266 Turkey Wearable Conferencing Technology Market, By deployment mode, 2020-2029 (USD Million)

TABLE 267 Turkey Wearable Conferencing Technology Market, By organization size, 2020-2029 (USD Million)

TABLE 268 Turkey Wearable Conferencing Technology Market, By application, 2020-2029 (USD Million)

TABLE 269 Turkey Wearable Conferencing Technology Market, By end use, 2020-2029 (USD Million)

TABLE 270 Turkey corporate in Wearable Conferencing Technology Market, By deployment mode, 2020-2029 (USD Million)

TABLE 271 Turkey corporate in Wearable Conferencing Technology Market, By organization size, 2020-2029 (USD Million)

TABLE 272 Turkey education in Wearable Conferencing Technology Market, By deployment mode, 2020-2029 (USD Million)

TABLE 273 Turkey education in Wearable Conferencing Technology Market, By organization size, 2020-2029 (USD Million)

TABLE 274 Turkey healthcare in Wearable Conferencing Technology Market, By deployment mode, 2020-2029 (USD Million)

TABLE 275 Turkey healthcare in Wearable Conferencing Technology Market, By organization size, 2020-2029 (USD Million)

TABLE 276 Turkey government and defense in Wearable Conferencing Technology Market, By deployment mode, 2020-2029 (USD Million)

TABLE 277 Turkey government and defense in Wearable Conferencing Technology Market, By organization size, 2020-2029 (USD Million)

TABLE 278 Turkey media and entertainment in Wearable Conferencing Technology Market, By deployment mode, 2020-2029 (USD Million)

TABLE 279 Turkey media and entertainment in Wearable Conferencing Technology Market, By organization size, 2020-2029 (USD Million)

TABLE 280 Turkey banking, financial services and insurance (Bfsi) in Wearable Conferencing Technology Market, By deployment mode, 2020-2029 (USD Million)

TABLE 281 Turkey BANKING, FINANCIAL SERVICES AND INSURANCE (BFSI) in Wearable Conferencing Technology Market, By organization size, 2020-2029 (USD Million)

TABLE 282 Turkey other in Wearable Conferencing Technology Market, By deployment mode, 2020-2029 (USD Million)

TABLE 283 Turkey Other in Wearable Conferencing Technology Market, By organization size, 2020-2029 (USD Million)

TABLE 284 Rest of Europe Wearable Conferencing Technology Market, By offering, 2020-2029 (USD Million)

Lista de figuras

FIGURE 1 Europe Wearable conferencing technology Market: segmentation

FIGURE 2 Europe Wearable conferencing technology Market: data triangulation

FIGURE 3 Europe Wearable conferencing technology market: DROC ANALYSIS

FIGURE 4 Europe Wearable conferencing technology Market: EUROPE VS REGIONAL MARKET ANALYSIS

FIGURE 5 Europe Wearable conferencing technology Market: COMPANY RESEARCH ANALYSIS

FIGURE 6 Europe Wearable conferencing technology Market: INTERVIEW DEMOGRAPHICS

FIGURE 7 Europe Wearable conferencing technology Market: DBMR MARKET POSITION GRID

FIGURE 8 Europe Wearable conferencing technology Market: vendor share analysis

FIGURE 9 Europe Wearable conferencing technology Market: MARKET APPLICATION COVERAGE GRID

FIGURE 10 Europe Wearable conferencing technology market: SEGMENTATION

FIGURE 11 Rising preference for remote working is EXPECTED TO DRIVE EUROPE WEARABLE CONFERENCING TECHNOLOGY MARKETIN THE FORECAST PERIOD OF 2022 TO 2029

FIGURE 12 TYPE segment is expected to account for the largest share of Europe Wearable conferencing technology marketin 2022 & 2029

FIGURE 13 DRIVERS, RESTRAINTS, OPPORTUNITIES, AND CHALLENGEs OF Europe WEARABLE CONFERENCING TECHNOLOGY Market

FIGURE 14 Europe Wearable conferencing technology Market: BY offering, 2021

FIGURE 15 Europe Wearable conferencing technology Market: BY conferencing type, 2021

FIGURE 16 Europe Wearable conferencing technology Market: BY deployment mode, 2021

FIGURE 17 Europe Wearable conferencing technology Market: BY organization size, 2021

FIGURE 18 Europe Wearable conferencing technology Market: BY application, 2021

FIGURE 19 Europe Wearable conferencing technology Market: BY end use, 2021

FIGURE 20 EUROPE Wearable Conferencing Technology MARKET: SNAPSHOT (2021)

FIGURE 21 EUROPE WEARABLE CONFERENCING TECHNOLOGY MARKET: by Country (2021)

FIGURE 22 EUROPE Wearable Conferencing Technology MARKET: by Country (2022 & 2029)

FIGURE 23 EUROPE Wearable Conferencing Technology MARKET: by Country (2021 & 2029)

FIGURE 24 EUROPE Wearable Conferencing Technology MARKET: by offering (2022-2029)

FIGURE 25 Europe Wearable conferencing technology Market: company share 2021 (%)

Ver información detallada Right Arrow

Metodología de investigación

La recopilación de datos y el análisis del año base se realizan utilizando módulos de recopilación de datos con muestras de gran tamaño. La etapa incluye la obtención de información de mercado o datos relacionados a través de varias fuentes y estrategias. Incluye el examen y la planificación de todos los datos adquiridos del pasado con antelación. Asimismo, abarca el examen de las inconsistencias de información observadas en diferentes fuentes de información. Los datos de mercado se analizan y estiman utilizando modelos estadísticos y coherentes de mercado. Además, el análisis de la participación de mercado y el análisis de tendencias clave son los principales factores de éxito en el informe de mercado. Para obtener más información, solicite una llamada de un analista o envíe su consulta.

La metodología de investigación clave utilizada por el equipo de investigación de DBMR es la triangulación de datos, que implica la extracción de datos, el análisis del impacto de las variables de datos en el mercado y la validación primaria (experto en la industria). Los modelos de datos incluyen cuadrícula de posicionamiento de proveedores, análisis de línea de tiempo de mercado, descripción general y guía del mercado, cuadrícula de posicionamiento de la empresa, análisis de patentes, análisis de precios, análisis de participación de mercado de la empresa, estándares de medición, análisis global versus regional y de participación de proveedores. Para obtener más información sobre la metodología de investigación, envíe una consulta para hablar con nuestros expertos de la industria.

Personalización disponible

Data Bridge Market Research es líder en investigación formativa avanzada. Nos enorgullecemos de brindar servicios a nuestros clientes existentes y nuevos con datos y análisis que coinciden y se adaptan a sus objetivos. El informe se puede personalizar para incluir análisis de tendencias de precios de marcas objetivo, comprensión del mercado de países adicionales (solicite la lista de países), datos de resultados de ensayos clínicos, revisión de literatura, análisis de mercado renovado y base de productos. El análisis de mercado de competidores objetivo se puede analizar desde análisis basados ​​en tecnología hasta estrategias de cartera de mercado. Podemos agregar tantos competidores sobre los que necesite datos en el formato y estilo de datos que esté buscando. Nuestro equipo de analistas también puede proporcionarle datos en archivos de Excel sin procesar, tablas dinámicas (libro de datos) o puede ayudarlo a crear presentaciones a partir de los conjuntos de datos disponibles en el informe.

Testimonial