
Asia Pacific Invisible Orthodontics Market
Market Size in USD Billion
 USD
1.18 Billion
USD
2.58 Billion
2025
2033
USD
1.18 Billion
USD
2.58 Billion
2025
2033
| 2026 - 2033 | |
| USD 1.18 Billion | |
| USD 2.58 Billion | |
| % | |
|
Asia-Pacific Invisible Orthodontics Market Overview
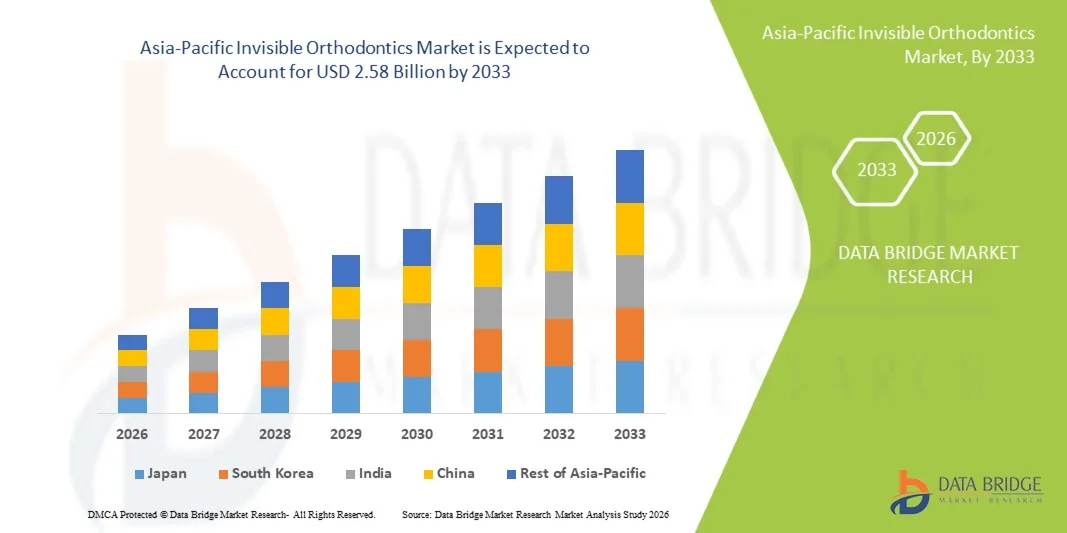
The Asia-Pacific invisible orthodontics market was valued at USD 1.18 billion in 2025 and is projected to reach USD 2.58 billion by 2033, growing at a CAGR of 10.30% from 2026 to 2033. The market is witnessing steady expansion driven by rising demand for aesthetic dental treatments, increasing orthodontic awareness among young adults, and rapid adoption of advanced clear aligner technologies across urban populations.
The growing prevalence of malocclusion and dental misalignment, combined with increasing disposable income and expanding access to private dental care services, is significantly boosting market adoption. In addition, technological advancements in 3D scanning, AI-based treatment planning, and customized aligner manufacturing are enhancing treatment efficiency and patient comfort. The shift toward minimally invasive and discreet orthodontic solutions, supported by a growing number of dental clinics and specialist orthodontists across Asia-Pacific, is further accelerating market growth.
Key Market Trends & Insights
- China is expected to dominate the Asia-Pacific invisible orthodontics market in 2025, accounting for 38.6% of the regional revenue share, supported by a large urban patient base, rapid expansion of private dental clinics, and strong adoption of digital clear aligner technologies.
- The Products segment led the market with a 71.6% share in 2025, driven by the strong demand for clear aligner systems, scanners, and 3D-printed orthodontic devices.
- India is projected to be the fastest-growing country from 2026 to 2033, with an estimated CAGR of 9.1%, fueled by increasing orthodontic awareness, growing disposable income, and rapid expansion of organized dental care infrastructure in urban and semi-urban areas.
- Services are the fastest-growing products and services type, projected to register a CAGR of 9.4%, reflecting the surge in demand for teledentistry consultations, digital treatment planning, and remote monitoring services
- The Teenagers segment dominated the age group category with a 54.8% revenue share in 2025, led by high cosmetic awareness, peer influence, and increasing demand for aesthetically discreet orthodontic solutions.
- Malocclusion accounted for 46.3% of the market, preferred by the high prevalence of misaligned teeth across Asia-Pacific populations.
- The Crowding segment is the fastest-growing application category, with a CAGR of 9.8%, driven by increasing dietary changes, jaw size reduction trends, and late orthodontic interventions.
Market Size & Forecast
- Global Market Value (2025): USD 1.18 Billion
- Expected Market Value (2033): USD 2.58 Billion
- Forecast CAGR (2026–2033): 10.30%
- Leading Country in 2025: China
- Fastest Growing Country: India
Report Scope and Asia-Pacific Invisible Orthodontics Market Segmentation
|
Attributes |
Asia-Pacific Invisible Orthodontics Key Market Insights |
|
Segments Covered |
|
|
Countries Covered |
Asia-Pacific · China · Japan · India · South Korea · Singapore · Malaysia · Australia · Thailand · Indonesia · Philippines · Rest of Asia-Pacific |
|
Key Market Players |
· Align Technology, Inc. (U.S.) · Straumann Group (Switzerland) · 3M (U.S.) · Dentsply Sirona Inc. (U.S.) · Envista Holdings Corporation (U.S.) · Henry Schein, Inc. (U.S.) · SmileDirectClub, Inc. (U.S.) · Institut Straumann AG (Switzerland) · Planmeca Oy (Finland) · GC Corporation (Japan) · Shofu Inc. (Japan) · Ormco Corporation (U.S.) · American Orthodontics Corporation (U.S.) · TP Orthodontics, Inc. (U.S.) · DB Orthodontics Limited (U.K.) · Great Lakes Dental Technologies (U.S.) · BioHorizons, Inc. (U.S.) · Angelalign Technology Inc. (China) · Modern Dental Group Limited (Hong Kong) · Ivoclar Vivadent AG (Liechtenstein) |
|
Market Opportunities |
· Expansion of teledentistry and remote orthodontic monitoring platforms · Rising medical tourism for cosmetic dentistry · Increasing partnerships between global aligner manufacturers and local dental clinic chains |
|
Value Added Data Infosets |
In addition to the insights on market scenarios such as market value, growth rate, segmentation, geographical coverage, and major players, the market reports curated by the Data Bridge Market Research also include in-depth expert analysis, patient epidemiology, pipeline analysis, pricing analysis, and regulatory framework. |
Asia-Pacific Invisible Orthodontics Market Trends
Trend: Rising Adoption of Digital Orthodontics & Clear Aligner Aesthetics
Patients across major Asia-Pacific countries are increasingly shifting toward invisible orthodontic solutions due to rising cosmetic awareness, improved digital dental workflows, and faster treatment customization enabled by AI-based treatment planning and 3D scanning technologies. Dental clinics and orthodontic chains are integrating end-to-end digital aligner platforms that allow virtual consultation, automated treatment simulation, and precise tooth movement prediction, significantly improving patient experience and treatment predictability. For instance, urban dental chains in China and India are widely adopting intraoral scanning systems and cloud-based aligner tracking platforms to streamline case management and reduce chair time while improving treatment outcomes.
Asia-Pacific Invisible Orthodontics Market Dynamics
Key Market Driver: Rising Demand for Aesthetic Dentistry and Digital Dental Care Expansion
The increasing demand for aesthetically driven dental treatments, combined with rapid expansion of organized dental clinics and growing disposable incomes, is significantly driving the adoption of invisible orthodontics across key Asia-Pacific countries. The penetration of digital dentistry tools such as 3D printing, AI-driven diagnostics, and teledentistry-supported consultations is further accelerating treatment accessibility and efficiency, especially among urban populations and young adults. For instance, orthodontic clinics in South Korea and Japan are increasingly offering fully digital clear aligner workflows, from scanning to delivery, to meet growing patient expectations for fast and discreet treatment options.
Key Restraint/Challenge: High Treatment Cost and Limited Insurance Coverage
Despite strong demand growth, the relatively high cost of clear aligner treatments compared to traditional braces remains a major barrier in several Asia-Pacific countries, particularly in price-sensitive markets such as India and Southeast Asia. Limited insurance coverage for cosmetic orthodontic procedures further restricts affordability, leading to slower adoption in semi-urban and rural areas. In addition, the dependence on multiple treatment cycles and follow-up visits increases the overall financial burden on patients, limiting market penetration beyond higher-income groups.
For instance, in India and Thailand, many patients still prefer conventional braces due to lower upfront costs and partial absence of reimbursement support for cosmetic dental procedures.
Key Market Opportunity: Expansion of Direct-to-Consumer Aligners and AI-Enabled Treatment Platforms
The integration of AI-powered orthodontic planning and direct-to-consumer (DTC) aligner delivery models presents a significant growth opportunity across Asia-Pacific, enabling more scalable, accessible, and cost-efficient treatment pathways. These platforms reduce dependency on traditional clinic visits by offering remote monitoring, virtual consultations, and digitally managed treatment progress tracking, thereby expanding reach into underserved regions. For instance, emerging dental startups in China and India are launching teledentistry-enabled aligner services that combine AI-based scanning apps with home impression kits to provide affordable and convenient orthodontic solutions for a broader patient base.
Asia-Pacific Invisible Orthodontics Market Scope
The Asia-Pacific invisible orthodontics market is segmented on the basis of products and services, age group, application, end user, and distribution channel.
- By Products and Services
On the basis of products and services, the Asia-Pacific invisible orthodontics market is segmented into products and services. The Products segment dominated the market with a 71.6% share in 2025, driven by strong demand for clear aligner systems, scanners, and 3D-printed orthodontic devices. These products form the core of treatment delivery, enabling precise tooth movement and improved aesthetic outcomes for patients across urban dental markets. Increasing adoption of digital orthodontics and CAD/CAM-based aligner manufacturing is further strengthening product dominance. High repeat purchase cycles of aligner sets also contribute to recurring revenue generation. Expanding dental clinic infrastructure across China, India, and Japan supports large-scale product deployment. Continuous innovation in biocompatible materials and AI-based treatment planning is further enhancing product efficiency.
The Services segment is expected to register the fastest growth at a CAGR of 9.4% from 2026 to 2033, driven by rising demand for teledentistry consultations, digital treatment planning, and remote monitoring services. These services improve patient convenience by reducing in-clinic visits while ensuring continuous treatment supervision. Growing adoption of subscription-based orthodontic care models is also accelerating service penetration. Dental chains are increasingly offering bundled aligner + service packages for improved patient retention. Expansion of AI-enabled remote diagnostics is further supporting growth. Rising digital transformation in dental care delivery is making services a key growth enabler.
- By Age Group
On the basis of age group, the market is segmented into adults, teenagers, and children. The Teenagers segment dominated the market with a 54.8% share in 2025, driven by high cosmetic awareness, peer influence, and increasing demand for aesthetically discreet orthodontic solutions. Teen patients represent a major target group for clear aligner manufacturers due to early correction of malocclusion and high treatment compliance. Rising social media influence and growing focus on appearance among adolescents further support demand. Schools and pediatric dental programs are increasingly promoting orthodontic screening. Expanding parental willingness to invest in dental aesthetics also strengthens this segment. Continuous product innovation tailored for growing jaws enhances treatment effectiveness.
The Adults segment is expected to witness the fastest growth at a CAGR of 10.1% from 2026 to 2033, driven by increasing late-stage orthodontic correction and rising professional appearance concerns. Working professionals prefer invisible orthodontics due to minimal lifestyle disruption and aesthetic appeal. Rising disposable income and willingness to invest in premium dental care are key growth drivers. Expanding corporate wellness and dental insurance coverage in urban areas is also supporting adoption. Increasing awareness of long-term oral health benefits is further accelerating demand. Growth in urbanization and service-sector employment is strengthening adult patient penetration.
- By Application
On the basis of application, the market is segmented into malocclusion, crowding, excessive spacing, and others. The Malocclusion segment dominated the market with a 46.3% share in 2025, driven by the high prevalence of misaligned teeth across Asia-Pacific populations. Clear aligners are widely used to correct mild to moderate malocclusion due to their effectiveness and comfort. Increasing awareness of early orthodontic intervention is further supporting demand. Rising screening programs in dental clinics and schools are contributing to higher diagnosis rates. Technological advancements in 3D simulation improve treatment accuracy for malocclusion cases. Expanding dental infrastructure in emerging economies is reinforcing segment dominance.
The Crowding segment is expected to register the fastest growth at a CAGR of 9.8% from 2026 to 2033, driven by increasing dietary changes, jaw size reduction trends, and late orthodontic interventions. Crowding cases are highly suitable for clear aligner treatment due to predictable tooth movement outcomes. Rising cosmetic concerns among urban populations are further accelerating treatment uptake. Advanced digital planning tools enable precise correction of complex crowding cases. Increasing availability of customized aligner trays enhances treatment efficiency. Growing orthodontic awareness in developing countries is also boosting segment expansion.
- By End User
On the basis of end user, the market is segmented into hospitals, dental clinics, orthodontic clinics, and others. The Dental Clinics segment dominated the market with a 58.7% share in 2025, driven by high patient inflow, strong service accessibility, and widespread availability of orthodontic treatment offerings. Dental clinics serve as the primary point of care for clear aligner consultations and follow-up treatments. Increasing adoption of digital scanning and in-house aligner planning systems is strengthening clinic efficiency. Expanding private dental networks across China, India, and South Korea supports dominance. Clinics also benefit from faster treatment turnaround times and personalized patient care. Continuous investment in dental infrastructure further reinforces market leadership.
The Orthodontic Clinics segment is expected to witness the fastest growth at a CAGR of 10.5% from 2026 to 2033, driven by specialization in advanced corrective treatments and complex orthodontic cases. These clinics offer higher precision treatment using AI-based planning and customized aligner systems. Rising patient preference for specialist care is boosting demand. Increasing availability of premium orthodontic services in urban centers is also supporting growth. Strong adoption of digital orthodontic workflows enhances treatment outcomes. Expanding referral networks from general dentists further accelerates segment development.
- By Distribution Channel
On the basis of distribution channel, the market is segmented into direct sales and third-party distributors. The Direct Sales segment dominated the market with a 63.2% share in 2025, driven by strong manufacturer-clinic partnerships and rising adoption of integrated digital orthodontic platforms. Direct sales enable better pricing control, faster delivery, and customized product offerings. Major aligner companies prefer direct engagement with dental clinics and orthodontic chains. Expansion of corporate dental networks further supports this model. Integration of digital ordering systems enhances efficiency and reduces supply chain delays. Continuous manufacturer investment in in-house ecosystems strengthens dominance.
The Third-Party Distributors segment is expected to register the fastest growth at a CAGR of 8.7% from 2026 to 2033, driven by expansion into tier-2 and tier-3 cities where direct manufacturer presence is limited. Distributors help improve product accessibility and market penetration in emerging regions. Increasing demand from smaller clinics and independent practitioners supports growth. Logistics optimization and localized supply chains enhance distribution efficiency. Rising orthodontic awareness in semi-urban markets is further accelerating adoption. Strategic partnerships between manufacturers and distributors are strengthening market reach.
Asia-Pacific Invisible Orthodontics Market Regional Analysis
China is expected to dominate the Asia-Pacific invisible orthodontics market in 2025, accounting for 38.6% of the regional revenue share, supported by a large urban patient base, rapid expansion of private dental clinics, and strong adoption of digital clear aligner technologies. The country also benefits from rising cosmetic dentistry awareness, increasing disposable income, and strong penetration of AI-based treatment planning and 3D scanning solutions. Growing investments by domestic and international orthodontic companies, along with expanding dental infrastructure in Tier-1 and Tier-2 cities, continue to strengthen China’s leadership position in the regional market.
The China Invisible Orthodontics Market Insight
The China invisible orthodontics market is growing rapidly due to a large urban population base, rising disposable incomes, and strong demand for aesthetic dental treatments among young adults. Expanding private dental clinic networks and increasing penetration of digital dentistry technologies are significantly supporting market expansion. The growing adoption of AI-based treatment planning, 3D scanning, and customized clear aligner systems is improving treatment precision and accessibility. In addition, rising awareness of dental aesthetics and strong presence of both global and domestic aligner providers continue to accelerate market growth across major cities.
India Invisible Orthodontics Market Insight
The India invisible orthodontics market is witnessing strong growth driven by increasing awareness of cosmetic dentistry, a large untreated orthodontic patient pool, and rapid expansion of organized dental care services. Rising disposable income and growing preference for aesthetic, minimally invasive dental treatments are further supporting adoption. The increasing presence of private dental chains and expansion of digital orthodontics solutions such as teledentistry and AI-based treatment planning are improving accessibility. In addition, growing penetration in Tier-2 and Tier-3 cities is significantly contributing to market expansion.
Japan Invisible Orthodontics Market Insight
The Japan invisible orthodontics market is steadily growing due to high demand for advanced aesthetic dental solutions, strong healthcare infrastructure, and widespread adoption of digital orthodontic technologies. Dental clinics are increasingly using clear aligners supported by 3D imaging and AI-driven treatment planning for precise and efficient outcomes. Rising cosmetic awareness among adults and young professionals is also driving demand for discreet orthodontic options. Furthermore, continuous technological advancements and preference for minimally invasive procedures are strengthening market adoption.
South Korea Invisible Orthodontics Market Insight
The South Korea invisible orthodontics market is expanding rapidly, driven by strong cosmetic consciousness, high demand for aesthetic treatments, and advanced dental technology adoption. Clear aligners are increasingly preferred over traditional braces due to lifestyle convenience and appearance-focused culture. The country’s well-developed dental clinic infrastructure and strong integration of digital orthodontics solutions such as 3D scanning and AI-based planning are further boosting growth. In addition, rising influence of social media and beauty standards continues to accelerate adoption among younger populations.
Asia-Pacific Invisible Orthodontics Market Share
The Asia-Pacific invisible orthodontics industry is primarily led by well-established companies, including:
- Align Technology, Inc. (U.S.)
- Straumann Group (Switzerland)
- 3M (U.S.)
- Dentsply Sirona Inc. (U.S.)
- Envista Holdings Corporation (U.S.)
- Henry Schein, Inc. (U.S.)
- SmileDirectClub, Inc. (U.S.)
- Institut Straumann AG (Switzerland)
- Planmeca Oy (Finland)
- GC Corporation (Japan)
- Shofu Inc. (Japan)
- Ormco Corporation (U.S.)
- American Orthodontics Corporation (U.S.)
- TP Orthodontics, Inc. (U.S.)
- DB Orthodontics Limited (U.K.)
- Great Lakes Dental Technologies (U.S.)
- BioHorizons, Inc. (U.S.)
- Angelalign Technology Inc. (China)
- Modern Dental Group Limited (Hong Kong)
- Ivoclar Vivadent AG (Liechtenstein)
Latest Developments in Asia-Pacific Invisible Orthodontics Market
- In December 2025, Angelalign Technology received MDR certification and CE marking for its clear aligner solutions, marking a key regulatory milestone that supports its expansion into highly regulated international markets. This certification improves trust among clinicians and accelerates adoption of its digital orthodontic solutions beyond China into broader Asia-Pacific and European markets. It also strengthens compliance credibility and supports the company’s long-term strategy of globalizing its AI-driven orthodontic ecosystem
- In August 2023, Angelalign Technology announced continued expansion of its clear aligner production and R&D capabilities, supporting higher manufacturing capacity and accelerating adoption of digital orthodontic solutions across China and Southeast Asian markets. The expansion included investment in smart manufacturing facilities, improved treatment planning systems, and scaling of clinical support networks for orthodontists. This development reflects growing regional demand for affordable and customized aligner solutions, particularly in emerging Asia-Pacific dental markets
- In October 2021, Align Technology expanded its Invisalign ecosystem in China through enhanced digital workflows and increased adoption of Invisalign treatment planning tools among orthodontists, strengthening its presence in one of the fastest-growing APAC orthodontic markets. This expansion focused on improving clinician training, increasing access to intraoral scanning systems, and improving treatment predictability through AI-assisted planning tools. The initiative supported rising demand for aesthetic dental solutions in urban China and reinforced Invisalign’s leadership in premium clear aligner treatments
- In June 2021, Angelalign Technology Inc., a leading China-based clear aligner manufacturer, successfully completed its IPO on the Hong Kong Stock Exchange, raising significant capital to expand its digital orthodontics capabilities and international footprint. The IPO strengthened its financial position to invest in advanced aligner production, AI-driven treatment planning, and global expansion across Asia-Pacific and Europe. This listing also highlighted strong investor confidence in the rapidly growing invisible orthodontics market in China and reinforced the country’s role as a global manufacturing hub for clear aligner technologies
- In February 2021, Dentsply Sirona, a global dental solutions company, completed its acquisition of Byte, a direct-to-consumer clear aligner brand, expanding its presence in digital orthodontics and strengthening its position in teledentistry-enabled aligner treatment models used across Asia-Pacific markets. The acquisition helped accelerate adoption of remote orthodontic care models, particularly among younger, tech-savvy patients seeking affordable and convenient alternatives to traditional braces. It also supported the broader shift toward digital-first orthodontic ecosystems integrating scanning, planning, and home-delivered aligners
SKU-

- Interactive Data Analysis Dashboard
- Company Analysis Dashboard for high growth potential opportunities
- Research Analyst Access for customization & queries
- Competitor Analysis with Interactive dashboard
- Latest News, Updates & Trend analysis
- Harness the Power of Benchmark Analysis for Comprehensive Competitor Tracking
Data collection and base year analysis are done using data collection modules with large sample sizes. The stage includes obtaining market information or related data through various sources and strategies. It includes examining and planning all the data acquired from the past in advance. It likewise envelops the examination of information inconsistencies seen across different information sources. The market data is analysed and estimated using market statistical and coherent models. Also, market share analysis and key trend analysis are the major success factors in the market report. To know more, please request an analyst call or drop down your inquiry.
The key research methodology used by DBMR research team is data triangulation which involves data mining, analysis of the impact of data variables on the market and primary (industry expert) validation. Data models include Vendor Positioning Grid, Market Time Line Analysis, Market Overview and Guide, Company Positioning Grid, Patent Analysis, Pricing Analysis, Company Market Share Analysis, Standards of Measurement, Global versus Regional and Vendor Share Analysis. To know more about the research methodology, drop in an inquiry to speak to our industry experts.
Data Bridge Market Research is a leader in advanced formative research. We take pride in servicing our existing and new customers with data and analysis that match and suits their goal. The report can be customized to include price trend analysis of target brands understanding the market for additional countries (ask for the list of countries), clinical trial results data, literature review, refurbished market and product base analysis. Market analysis of target competitors can be analyzed from technology-based analysis to market portfolio strategies. We can add as many competitors that you require data about in the format and data style you are looking for. Our team of analysts can also provide you data in crude raw excel files pivot tables (Fact book) or can assist you in creating presentations from the data sets available in the report.


