
Europe and Middle East Oilfield Services Market Analysis and Insights
The rising penetration of emerging technologies such as Artificial Intelligence (AI) and the Internet of Things (IoT) in the oil and gas sector has enhanced the demand for the market. Shifting focus towards unconventional energy sources such as shale gas also contributes to the market's growth. The major market players focus on various service launches and approvals during this crucial period. In addition, the growing adoption of technologies such as Enhanced Oil Recovery (EOR), especially for aging oil fields, also contributes to the rising demand for the market.
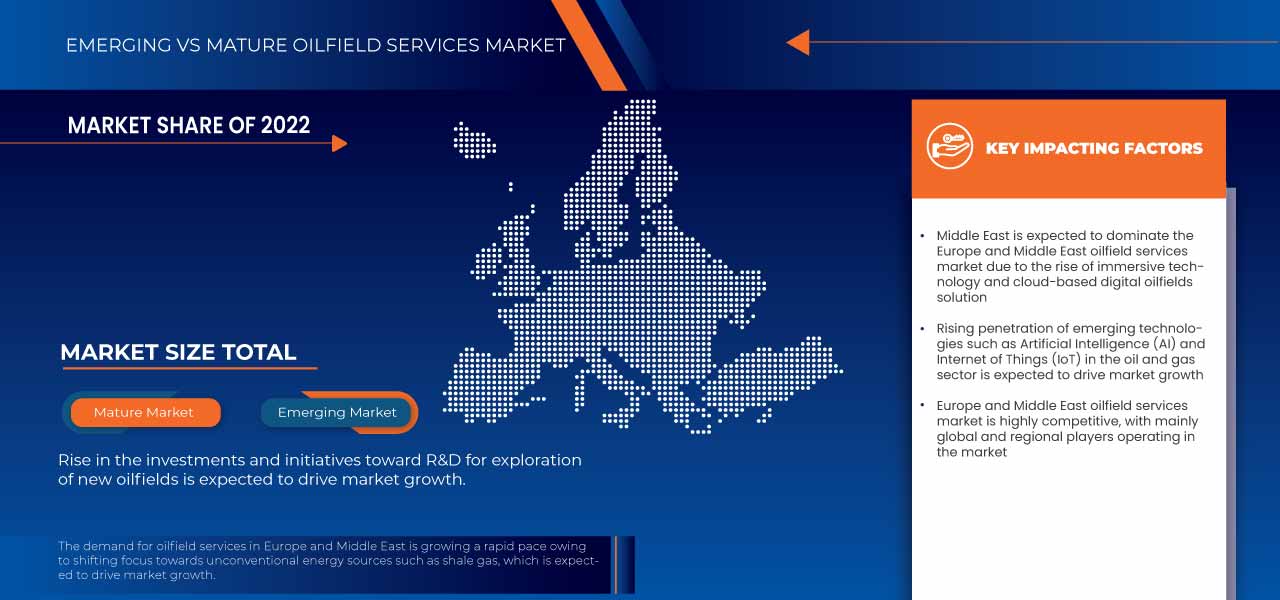
The Europe and Middle East oilfield services market is expected to grow in the forecast year due to the rise in demand for well-intervention services and operational digital oilfield solutions. The rise of immersive technology and cloud-based digital oilfields solution is further boosting market growth. However, stringent laws and regulations by various regulatory bodies are expected to restrain market growth in the forecast period.
Data Bridge Market Research analyzes that the Europe and Middle East oilfield services market is expected to reach USD 131,230.78 million by 2030, at a CAGR of 5.8% during the forecast period.
|
Report Metric |
Details |
|
Forecast Period |
2023 to 2030 |
|
Base Year |
2022 |
|
Historic Year |
2021 (Customizable to 2015-2020) |
|
Quantitative Units |
Revenue in USD Million |
|
Segments Covered |
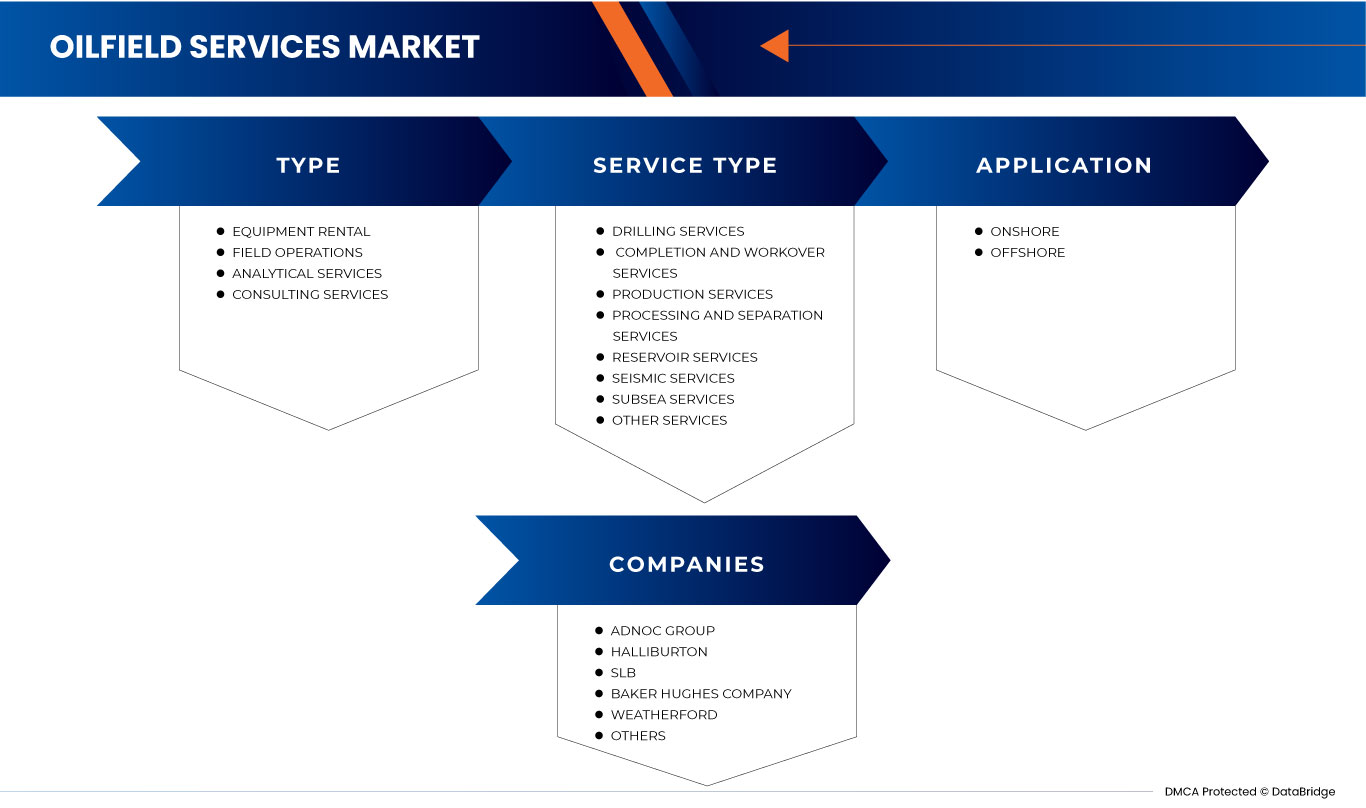
Type (Equipment Rental, Field Operations, Analytical Services, and Consulting Services), Service Type (Drilling Services, Completion and Workover Services, Production Services, Processing and Separation Services, Reservoir Services, Seismic Services, Subsea Services, and Other Services), Application (Onshore and Offshore) |
|
Countries Covered |
Russia, Norway, U.K., Denmark, Italy, Turkey, Germany, Netherlands, France, Spain, Switzerland, Belgium, Finland, Sweden, and Rest of Europe, Saudi Arabia, United Arab Emirates, Kuwait, Qatar, Oman, Bahrain, Israel, and Rest of Middle East |
|
Market Players Covered |
NAPESCO, SLB, Halliburton, Baker Hughes Company, ABB, Weatherford, Rockwell Automation, Siemens Energy, Saipem, Petrofac Limited, Oil States International, Inc., Oceaneering International, TRANSOCEAN LTD., NOV Inc., TAQA KSA, Superior Energy Services, Stark Oilfield Service Company, Middle East Oilfield Services LLC, Abu Dhabi Oilfield Services Company, and ADNOC Group among others |
Market Definition
Oilfield services refer to the range of products and services provided to the oil and gas industry to support the exploration, development, production, and transportation of oil and gas resources. Oil field services encompass a wide range of specialized activities, equipment, and expertise required at various stages of the oil and gas lifecycle. These services include seismic surveys to identify potential reservoirs, drilling of wells using specialized rigs and equipment, completion and production services to prepare wells for production, well intervention and maintenance services, wireline services for data collection and intervention operations, and environmental services for waste management and compliance. The oilfield services market refers to the industry that provides various products and services to support oil and gas exploration, drilling, production, and transportation activities.
Europe and Middle East Oilfield Services Market Dynamics
This section deals with understanding the market drivers, advantages, opportunities, restraints, and challenges. All of this is discussed in detail below:
Drivers
- Rising Penetration of Emerging Technologies Such as Artificial Intelligence (AI) and Internet of Things (IoT) in the Oil and Gas Sector
Technology plays an important role in the growth of every business, and also it helps organizations to improve the quality and work speed by supporting and enhancing operations. Companies are adopting big data analytics techniques in their businesses to improve operations and ease facility performance. Disruptive technologies such as Artificial Intelligence (AI) and the Internet of Things (IoT) are driving digital transformation across the market, thereby increasing efficiency, safety, and sustainability. The oil and gas sector has witnessed a rising penetration of emerging technologies in recent years. Technologies are transforming various aspects of the industry, from exploration and production to refining and distribution.
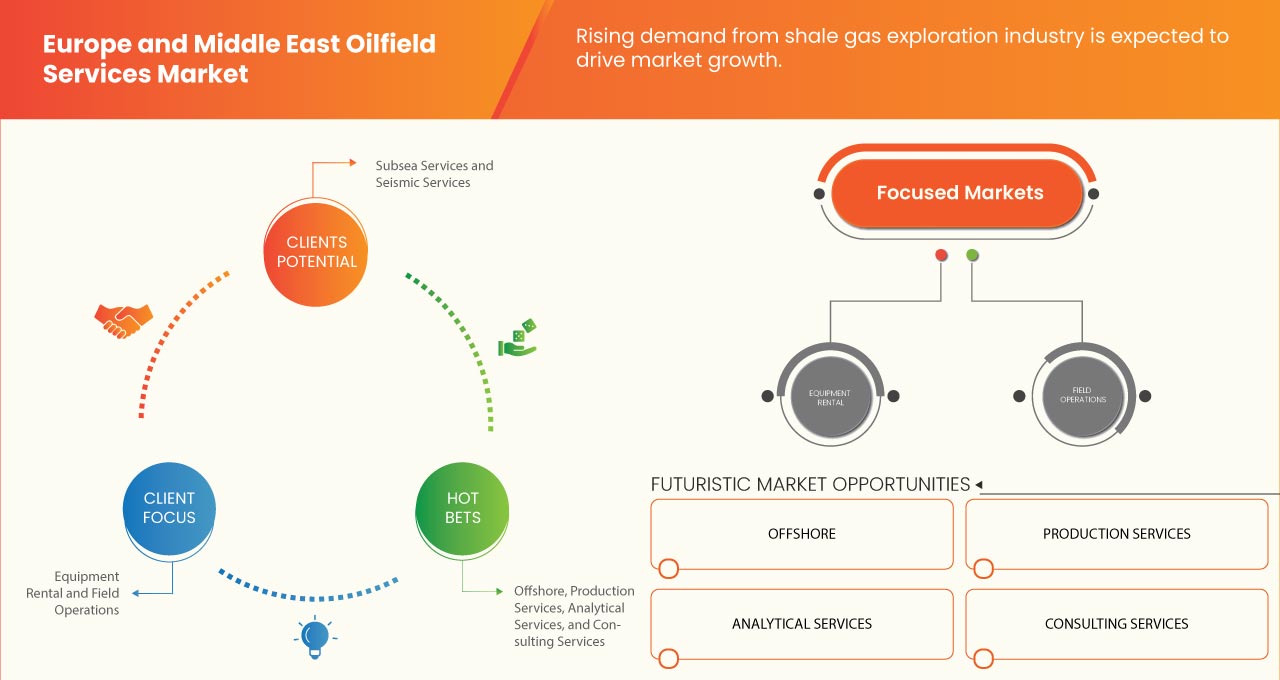
- Shifting Focus Towards Unconventional Energy Sources such as Shale Gas
Shale gas is an unconventional natural gas resource found within shale rock formations, and its exploration and extraction require specialized techniques and services provided by oil field companies. The development of advanced technologies such as horizontal drilling and hydraulic fracturing has been crucial in unlocking the vast potential of shale gas resources. Shale gas exploration involves drilling multiple wells and completing them with hydraulic fracturing. Seismic surveys are conducted to map and analyze the subsurface shale formations. This helps identify the potential shale gas reservoirs, assess their geologic characteristics, and determine the best locations for drilling. Hydraulic fracturing or fracking, is a critical technique used to extract gas from shale formations. Oil field service companies provide expertise and equipment for hydraulic fracturing operations. They design and implement fracking treatments that involve injecting water, sand, and chemicals at high pressure to create fractures in the shale rock allowing gas to flow once drilling and hydraulic fracturing is complete, cementing casing, installing production tubing, and implementing wellhead assemblies to ensure proper flow control and safety. Oil field services are involved in optimizing shale gas production by using different techniques using well stimulation, additional fracking stages, or acidizing to increase gas flow rates and improve well productivity. Production monitoring and optimization services help in maximizing the overall production from shale gas reservoirs.
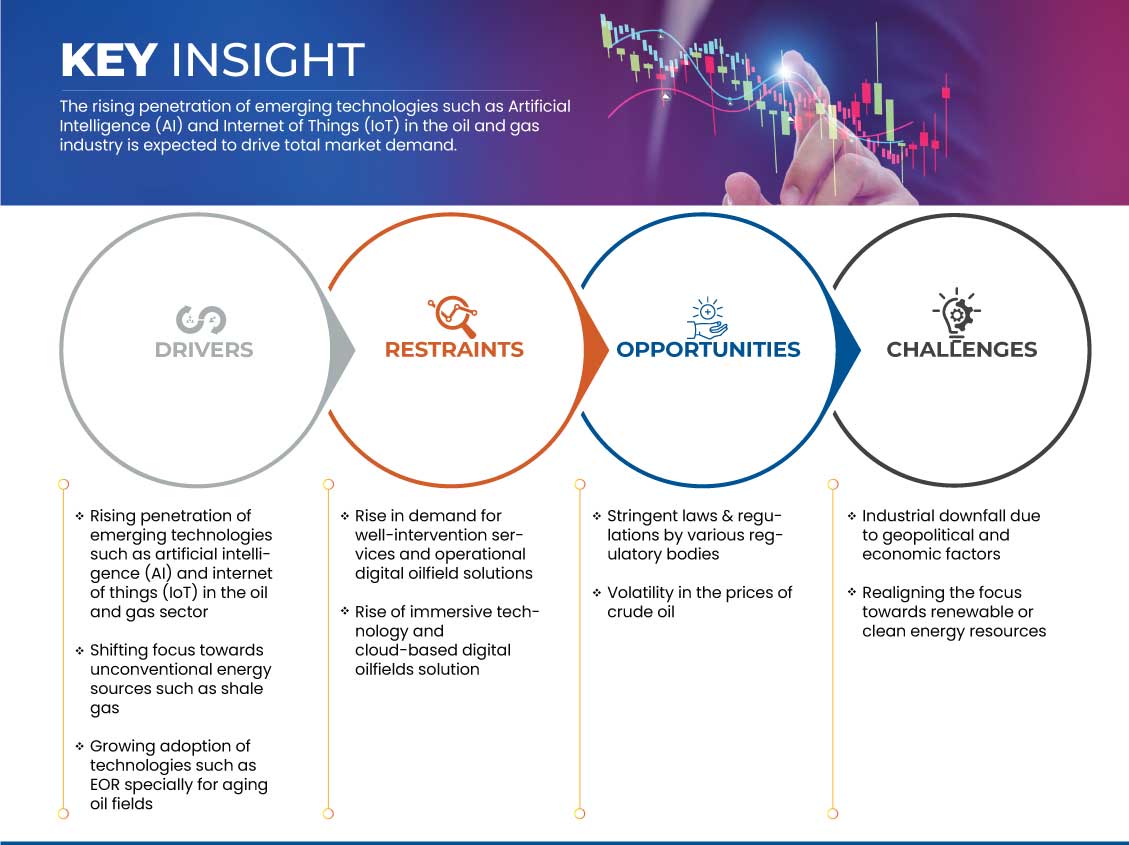
Opportunity
-
Rise in Demand for Well-Intervention Services and Operational Digital Oilfield Solutions
The rising number of mature fields in Europe and the Middle East is all because of the rising demand for primary energy, such as petroleum and natural gas, across the globe. Moreover, there is a huge shortage in primary energy supply, and most international companies are investing more in making efficient production systems. Adopting digital solutions or transforming the working process of oilfields towards digitalization will improve oil production and extraction capacity and cut down on human errors.
Many oil and gas fields worldwide are entering the mature or late-life stage, where production rates naturally decline. Well-intervention services are in demand to optimize production, improve recovery rates and extend the lifespan of these aging fields. Intervention techniques such as well stimulation, workovers, and well integrity management help address wellbore issues, enhance reservoir performance, and restore or enhance production levels. Well-intervention services play a vital role as the industry strives to maximize production efficiency. These services help identify and address production bottlenecks, optimize well-completion designs, and implement reservoir management strategies.
Challenges/Restraints
- Industrial Downfall due to Geopolitical and Economic Factors
The industrial downfall due to geopolitical and economic factors can have significant implications for the market. Geopolitical factors such as political instability, conflicts, trade disputes, and sanctions can disrupt the global oil and gas industry. Economic factors such as fluctuations in oil prices, currency devaluation, and changes in demand-supply dynamics can further impact the market. These challenges can create several potential obstacles for the market.
The production and exploration of oil in Europe and Middle East regions may be impacted by geopolitical unrest. Instability in the major oil-producing countries can lead to a decline in investment, damage to infrastructure, and supply disruptions. These worries might limit exploration and production activities, reducing the need for drilling, well completion, and maintenance services. This might be detrimental to the oilfield services industry. In addition, in the Europe and Middle East regions, financial decisions and project budgets might be influenced by economic factors such as changes in oil prices. Oil and gas companies may reduce capital expenditures as a result of volatile oil prices, which would reduce the demand for oilfield services. In addition, changes in the demand-supply dynamics of the market and currency devaluation in some Europe and Middle East countries may have an impact on the market in that region. These factors can increase operational costs for oilfield service providers and lower their profitability and competitiveness. Oil and gas exploration and production activities may decrease as a result of factors such as changes in energy consumption patterns, a greater emphasis on renewable energy sources, and policies that support the energy transition. This change may result in a decline in the demand for oilfield services, which will be difficult for service providers doing business in Europe and Middle East regions.
- Stringent Laws & Regulations by Various Regulatory Bodies
Various organizations and governments have imposed various stringent laws and regulations on the Europe and Middle East oilfield services market. These rules are intended to guarantee industry ethnicity, environmental protection, and safety. They can, however, also set restrictions on the market.
Environmental protection is one aspect of regulation that impacts the business. Governments and organizations have enacted laws to reduce and control the environmental impact of oilfield operations. This covers waste or by-product disposal rules, reducing emissions, and safeguarding natural ecosystems. Costs for oilfield service providers may rise due to the increased equipment, technological, and procedural investments necessary to comply with these laws, which can be a challenge to overcome in the near future. In addition, health and safety laws play a big part in the market. Corporations and governments impose strict regulations to safeguard employees and guarantee secure working environments. Personal protective equipment, danger identification, and emergency response planning are only a few of the topics covered by these rules. Companies may have to spend money on training initiatives, safety gear, and compliance measures to comply with these rules, which can increase operational expenses. In addition, laws and rules are in place to ensure fair competition and transparency in the oilfield services sector. These rules may increase the amount of compliance required of already-existing businesses and raise entry barriers for new firms, changing the market dynamics.
Recent Developments
- In July 2023, ABB and Microsoft collaborated to bring generative Al to industrial applications for safer, smarter, and more sustainable operations. This will help the company to accelerate the digital transformation of the industrial sector.
- In January 2023, NOV launched the Agitator ZP System to increase drilling efficiency with no pressure decrease, and they stated that this zero-pressure technology offers more flexibility for drilling projects requiring longer laterals and dual friction-reduction tools to reach challenging targets while preserving higher ROP.
Europe and Middle East Oilfield Services Market Scope
The Europe and Middle East oilfield services market is segmented into three notable segments based on type, service type, and application. The growth among segments helps you analyze niche pockets of growth and strategies to approach the market and determine your core application areas and the difference in your target markets.
Type
- Equipment Rental
- Field Operations
- Analytical Services
- Consulting Services
On the basis of type, the market is segmented into equipment rental, field operations, analytical services, and consulting services.
Service Type
- Drilling Services
- Completion and Workover Services
- Production Services
- Processing and Separation Services
- Reservoir Services
- Seismic Services
- Subsea Services
- Other Services
On the basis of service type, the market is segmented into drilling services, completion and workover services, production services, processing and separation services, reservoir services, seismic services, subsea services, and other services.
Application
- Onshore
- Offshore
On the basis of application, the market is segmented into onshore and offshore.
Europe and Middle East Oilfield Services Market Regional Analysis/Insights
The Europe and Middle East oilfield services market is segmented into three notable segments based on type, service type, and application.
The countries covered in this market report are Russia, Norway, U.K., Denmark, Italy, Turkey, Germany, Netherlands, France, Spain, Switzerland, Belgium, Finland, Sweden, and Rest of Europe, Saudi Arabia, United Arab Emirates, Kuwait, Qatar, Oman, Bahrain, Israel, and Rest of Middle East.
Middle East is expected to dominate the market due to the presence of key market players in the largest consumer market with high GDP. Saudi Arabia is expected to dominate in the Middle East region due to the rise in technological advancement and the increasing investment in various technologies. Russia is expected to dominate in the Europe region due to the strong presence of key players.
The country section of the report also provides individual market-impacting factors and changes in regulation in the market domestically that impact the current and future trends of the market. Data points such as new sales, replacement sales, country demographics, regulatory acts, and import-export tariffs are some of the major pointers used to forecast the market scenario for individual countries. Also, the presence and availability of global brands and their challenges faced due to large or scarce competition from local and domestic brands and the impact of sales channels are considered while providing forecast analysis of the country data.
Competitive Landscape and Europe and Middle East Oilfield Services Market Share Analysis
The Europe and Middle East oilfield services market competitive landscape provides details of competitors. Details included are company overview, company financials, revenue generated, market potential, investment in R&D, new market initiatives, production sites and facilities, company strengths and weaknesses, product launch, product approvals, product width and breadth, application dominance, and product type lifeline curve. The above data points provided are only related to the company's focus on the market.
Some of the major market players operating in the Europe and Middle East oilfield services market are NAPESCO, SLB, Halliburton, Baker Hughes Company, ABB, Weatherford, Rockwell Automation, Siemens Energy, Saipem, Petrofac Limited, Oil States International, Inc., Oceaneering International, TRANSOCEAN LTD., NOV Inc., TAQA KSA, Superior Energy Services, Stark Oilfield Service Company, Middle East Oilfield Services LLC, Abu Dhabi Oilfield Services Company, and ADNOC Group among others.
SKU-

- Interactive Data Analysis Dashboard
- Company Analysis Dashboard for high growth potential opportunities
- Research Analyst Access for customization & queries
- Competitor Analysis with Interactive dashboard
- Latest News, Updates & Trend analysis
- Harness the Power of Benchmark Analysis for Comprehensive Competitor Tracking
Table of Content
1 INTRODUCTION
1.1 OBJECTIVES OF THE STUDY
1.2 MARKET DEFINITION
1.3 OVERVIEW
1.4 LIMITATIONS
1.5 MARKETS COVERED
2 MARKET SEGMENTATION
2.1 MARKETS COVERED
2.2 GEOGRAPHICAL SCOPE
2.3 YEARS CONSIDERED FOR THE STUDY
2.4 CURRENCY AND PRICING
2.5 DBMR TRIPOD DATA VALIDATION MODEL
2.6 MULTIVARIATE MODELLING
2.7 TYPE LIFELINE CURVE
2.8 PRIMARY INTERVIEWS WITH KEY OPINION LEADERS
2.9 DBMR MARKET POSITION GRID
2.1 MARKET APPLICATION COVERAGE GRID
2.11 DBMR MARKET CHALLENGE MATRIX
2.12 SECONDARY SOURCES
2.13 ASSUMPTIONS
3 EXECUTIVE SUMMARY
4 PREMIUM INSIGHTS
4.1 PORTER’S FIVE FORCES: EUROPE AND MIDDLE EAST OILFIELD SERVICES MARKET
4.1.1 THREAT OF NEW ENTRANTS
4.1.2 THREAT OF SUBSTITUTES
4.1.3 CUSTOMER BARGAINING POWER
4.1.4 SUPPLIER BARGAINING POWER
4.1.5 INTERNAL COMPETITION (RIVALRY)
4.2 PESTLE ANALYSIS
4.2.1 POLITICAL FACTORS
4.2.2 ECONOMIC FACTORS
4.2.3 SOCIAL FACTORS
4.2.4 TECHNOLOGICAL FACTORS
4.2.5 LEGAL FACTORS
4.2.6 ENVIRONMENTAL FACTORS
4.3 VENDOR SELECTION CRITERIA
4.4 CLIMATE CHANGE SCENARIO
4.4.1 ENVIRONMENTAL CONCERNS
4.4.2 INDUSTRY RESPONSE
4.4.3 GOVERNMENT’S ROLE
4.4.4 ANALYST RECOMMENDATION
4.5 RAW MATERIAL COVERAGE
4.5.1 STEEL
4.5.2 ALLOYS
4.5.2.1 NICKEL ALLOYS
4.5.2.1.1 INCONEL
4.5.2.1.2 HASTELLOY
4.5.2.2 CHROMIUM-MOLYBDENUM (CR-MO) ALLOYS
4.5.2.2.1 4130 AND 4140
4.5.2.2.2 9CR AND 13CR STAINLESS STEELS
4.5.2.3 TITANIUM ALLOYS
4.5.2.3.1 GRADE 5 (TI-6AL-4V)
4.5.2.3.2 GRADE 2 (TI-CP)
4.5.3 TUNGSTEN AND COBALT
4.5.4 SYNTHETIC DIAMONDS
4.5.5 TITANIUM
4.6 SUPPLY CHAIN ANALYSIS
4.6.1 OVERVIEW
4.6.2 LOGISTIC COST SCENARIO
4.6.3 IMPORTANCE OF LOGISTICS SERVICE PROVIDERS
4.7 TECHNOLOGICAL ADVANCEMENT BY MANUFACTURERS
4.8 PRICING ANALYSIS BENCHMARKING OVERVIEW
4.8.1 DRILLING COSTS
4.8.2 WELL COMPLETION SERVICES
4.8.3 FLUIDS, CEMENTING, AND TOOLS SERVICES
5 REGULATORY FRAMEWORK AND GUIDELINES
5.1 REGULATORY FRAMEWORK AND GUIDELINES
6 MARKET OVERVIEW
6.1 DRIVERS
6.1.1 RISING PENETRATION OF EMERGING TECHNOLOGIES SUCH AS ARTIFICIAL INTELLIGENCE (AI) AND INTERNET OF THINGS (IOT) IN THE OIL AND GAS SECTOR
6.1.2 SHIFTING FOCUS TOWARDS UNCONVENTIONAL ENERGY SOURCES SUCH AS SHALE GAS
6.1.3 GROWING ADOPTION OF TECHNOLOGIES SUCH AS EOR ESPECIALLY FOR AGING OIL FIELDS
6.2 RESTRAINTS
6.2.1 STRINGENT LAWS & REGULATIONS BY VARIOUS REGULATORY BODIES
6.2.2 VOLATILITY IN THE PRICES OF CRUDE OIL
6.3 OPPORTUNITIES
6.3.1 RISE IN DEMAND FOR WELL-INTERVENTION SERVICES AND OPERATIONAL DIGITAL OILFIELD SOLUTIONS
6.3.2 RISE OF IMMERSIVE TECHNOLOGY AND CLOUD-BASED DIGITAL OILFIELDS SOLUTION
6.4 CHALLENGES
6.4.1 INDUSTRIAL DOWNFALL DUE TO GEOPOLITICAL AND ECONOMIC FACTORS
6.4.2 REALIGNING THE FOCUS TOWARDS RENEWABLE OR CLEAN ENERGY RESOURCES
7 EUROPE AND MIDDLE EAST OILFIELD SERVICES MARKET, BY REGION
7.1 OVERVIEW
7.2 MIDDLE EAST
7.2.1 SAUDI ARABIA
7.2.2 UNITED ARAB EMIRATES
7.2.3 KUWAIT
7.2.4 QATAR
7.2.5 OMAN
7.2.6 BAHRAIN
7.2.7 ISRAEL
7.2.8 REST OF MIDDLE EAST
7.3 EUROPE
7.3.1 RUSSIA
7.3.2 NORWAY
7.3.3 U.K.
7.3.4 DENMARK
7.3.5 ITALY
7.3.6 TURKEY
7.3.7 GERMANY
7.3.8 NETHERLANDS
7.3.9 FRANCE
7.3.10 SPAIN
7.3.11 SWITZERLAND
7.3.12 BELGIUM
7.3.13 FINLAND
7.3.14 SWEDEN
7.3.15 REST OF EUROPE
8 EUROPE AND MIDDLE EAST OILFIELD SERVICES MARKET: COMPANY LANDSCAPE
8.1 COMPANY SHARE ANALYSIS: EUROPE AND MIDDLE EAST
8.2 COMPANY SHARE ANALYSIS: EUROPE
8.3 COMPANY SHARE ANALYSIS: MIDDLE EAST
9 SWOT ANALYSIS
10 COMPANY PROFILES
10.1 ADNOC GROUP
10.1.1 COMPANY SNAPSHOT
10.1.2 PRODUCT PORTFOLIO
10.1.3 RECENT DEVELOPMENTS
10.2 HALLIBURTON
10.2.1 COMPANY SNAPSHOT
10.2.2 REVENUE ANALYSIS
10.2.3 PRODUCT PORTFOLIO
10.2.4 RECENT DEVELOPMENTS
10.3 SLB
10.3.1 COMPANY SNAPSHOT
10.3.2 REVENUE ANALYSIS
10.3.3 PRODUCT PORTFOLIO
10.3.4 RECENT DEVELOPMENT
10.4 BAKER HUGHES COMPANY
10.4.1 COMPANY SNAPSHOT
10.4.2 REVENUE ANALYSIS
10.4.3 PRODUCT PORTFOLIO
10.4.4 RECENT DEVELOPMENT
10.5 WEATHERFORD
10.5.1 COMPANY SNAPSHOT
10.5.2 REVENUE ANALYSIS
10.5.3 PRODUCT PORTFOLIO
10.5.4 RECENT DEVELOPMENTS
10.6 ABB
10.6.1 COMPANY SNAPSHOT
10.6.2 REVENUE ANALYSIS
10.6.3 PRODUCT PORTFOLIO
10.6.4 RECENT DEVELOPMENT
10.7 ABU DHABI OILFIELD SERVICES COMPANY
10.7.1 COMPANY SNAPSHOT
10.7.2 PRODUCT PORTFOLIO
10.7.3 RECENT DEVELOPMENTS
10.8 MIDDLE EAST OILFIELD SERVICES LLC.
10.8.1 COMPANY SNAPSHOT
10.8.2 PRODUCT PORTFOLIO
10.8.3 RECENT DEVELOPMENTS
10.9 NAPESCO
10.9.1 COMPANY SNAPSHOT
10.9.2 REVENUE ANALYSIS
10.9.3 PRODUCT PORTFOLIO
10.9.4 RECENT DEVELOPMENT
10.1 NOV INC.
10.10.1 COMPANY SNAPSHOT
10.10.2 REVENUE ANALYSIS
10.10.3 PRODUCT PORTFOLIO
10.10.4 RECENT DEVELOPMENT
10.11 OCEANEERING INTERNATIONAL, INC.
10.11.1 COMPANY SNAPSHOT
10.11.2 REVENUE ANALYSIS
10.11.3 PRODUCT PORTFOLIO
10.11.4 RECENT DEVELOPMENT
10.12 OIL STATES INTERNATIONAL, INC.
10.12.1 COMPANY SNAPSHOT
10.12.2 REVENUE ANALYSIS
10.12.3 PRODUCT PORTFOLIO
10.12.4 RECENT DEVELOPMENTS
10.13 PETROFAC LIMITED
10.13.1 COMPANY SNAPSHOT
10.13.2 REVENUE ANALYSIS
10.13.3 PRODUCT PORTFOLIO
10.13.4 RECENT DEVELOPMENTS
10.14 ROCKWELL AUTOMATION
10.14.1 COMPANY SNAPSHOT
10.14.2 REVENUE ANALYSIS
10.14.3 PRODUCT PORTFOLIO
10.14.4 RECENT DEVELOPMENTS
10.15 SAIPEM
10.15.1 COMPANY SNAPSHOT
10.15.2 REVENUE ANALYSIS
10.15.3 PRODUCT PORTFOLIO
10.15.4 RECENT DEVELOPMENTS
10.16 SIEMENS ENERGY
10.16.1 COMPANY SNAPSHOT
10.16.1 REVENUE ANALYSIS
10.16.2 PRODUCT PORTFOLIO
10.16.3 RECENT DEVELOPMENT
10.17 STARK OILFIELD SERVICE COMPANY
10.17.1 COMPANY SNAPSHOT
10.17.2 PRODUCT PORTFOLIO
10.17.3 RECENT DEVELOPMENTS
10.18 SUPERIOR ENERGY SERVICES
10.18.1 COMPANY SNAPSHOT
10.18.2 REVENUE ANALYSIS
10.18.3 PRODUCT PORTFOLIO
10.18.4 RECENT DEVELOPMENTS
10.19 TAQA KSA
10.19.1 COMPANY SNAPSHOT
10.19.2 REVENUE ANALYSIS
10.19.3 PRODUCT PORTFOLIO
10.19.4 RECENT DEVELOPMENT
10.2 TRANSOCEAN LTD.
10.20.1 COMPANY SNAPSHOT
10.20.2 REVENUE ANALYSIS
10.20.3 PRODUCT PORTFOLIO
10.20.4 RECENT DEVELOPMENTS
11 QUESTIONNAIRE
12 RELATED REPORTS
List of Table
TABLE 1 EUROPE AND MIDDLE EAST OILFIELD SERVICES MARKET, BY REGION, 2021-2030 (USD MILLION)
TABLE 2 EUROPE AND MIDDLE EAST OILFIELD SERVICES MARKET, BY TYPE, 2021-2030 (USD MILLION)
TABLE 3 EUROPE AND MIDDLE EAST OILFIELD SERVICES MARKET, BY SERVICE TYPE, 2021-2030 (USD MILLION)
TABLE 4 EUROPE AND MIDDLE EAST DRILLING SERVICES IN OILFIELD SERVICES MARKET, BY TYPE, 2021-2030 (USD MILLION)
TABLE 5 EUROPE AND MIDDLE EAST COMPLETION AND WORKOVER SERVICES IN OILFIELD SERVICES MARKET, BY TYPE, 2021-2030 (USD MILLION)
TABLE 6 EUROPE AND MIDDLE EAST PROCESSING AND SEPARATION SERVICES IN OILFIELD SERVICES MARKET, BY TYPE, 2021-2030 (USD MILLION)
TABLE 7 EUROPE AND MIDDLE EAST RESERVOIR SERVICES IN OILFIELD SERVICES MARKET, BY TYPE, 2021-2030 (USD MILLION)
TABLE 8 EUROPE AND MIDDLE EAST OILFIELD SERVICES MARKET, BY APPLICATION, 2021-2030 (USD MILLION)
TABLE 9 EUROPE AND MIDDLE EAST OFFSHORE IN OILFIELD SERVICES MARKET, BY TYPE, 2021-2030 (USD MILLION)
TABLE 10 MIDDLE EAST OILFIELD SERVICES MARKET, BY COUNTRY, 2021-2030 (USD MILLION)
TABLE 11 MIDDLE EAST OILFIELD SERVICES MARKET, BY TYPE, 2021-2030 (USD MILLION)
TABLE 12 MIDDLE EAST OILFIELD SERVICES MARKET, BY SERVICE TYPE, 2021-2030 (USD MILLION)
TABLE 13 MIDDLE EAST DRILLING SERVICES IN OILFIELD SERVICES MARKET, BY TYPE, 2021-2030 (USD MILLION)
TABLE 14 MIDDLE EAST COMPLETION AND WORKOVER SERVICES IN OILFIELD SERVICES MARKET, BY TYPE, 2021-2030 (USD MILLION)
TABLE 15 MIDDLE EAST PROCESSING AND SEPARATION SERVICES IN OILFIELD SERVICES MARKET, BY TYPE, 2021-2030 (USD MILLION)
TABLE 16 MIDDLE EAST RESERVOIR SERVICES IN OILFIELD SERVICES MARKET, BY TYPE, 2021-2030 (USD MILLION)
TABLE 17 MIDDLE EAST OILFIELD SERVICES MARKET, BY APPLICATION, 2021-2030 (USD MILLION)
TABLE 18 MIDDLE EAST OFFSHORE IN OILFIELD SERVICES MARKET, BY TYPE, 2021-2030 (USD MILLION)
TABLE 19 SAUDI ARABIA OILFIELD SERVICES MARKET, BY TYPE, 2021-2030 (USD MILLION)
TABLE 20 SAUDI ARABIA OILFIELD SERVICES MARKET, BY SERVICE TYPE, 2021-2030 (USD MILLION)
TABLE 21 SAUDI ARABIA DRILLING SERVICES IN OILFIELD SERVICES MARKET, BY TYPE, 2021-2030 (USD MILLION)
TABLE 22 SAUDI ARABIA COMPLETION AND WORKOVER SERVICES IN OILFIELD SERVICES MARKET, BY TYPE, 2021-2030 (USD MILLION)
TABLE 23 SAUDI ARABIA PROCESSING AND SEPARATION SERVICES IN OILFIELD SERVICES MARKET, BY TYPE, 2021-2030 (USD MILLION)
TABLE 24 SAUDI ARABIA RESERVOIR SERVICES IN OILFIELD SERVICES MARKET, BY TYPE, 2021-2030 (USD MILLION)
TABLE 25 SAUDI ARABIA OILFIELD SERVICES MARKET, BY APPLICATION, 2021-2030 (USD MILLION)
TABLE 26 SAUDI ARABIA OFFSHORE IN OILFIELD SERVICES MARKET, BY TYPE, 2021-2030 (USD MILLION)
TABLE 27 UNITED ARAB EMIRATES OILFIELD SERVICES MARKET, BY TYPE, 2021-2030 (USD MILLION)
TABLE 28 UNITED ARAB EMIRATES OILFIELD SERVICES MARKET, BY SERVICE TYPE, 2021-2030 (USD MILLION)
TABLE 29 UNITED ARAB EMIRATES DRILLING SERVICES IN OILFIELD SERVICES MARKET, BY TYPE, 2021-2030 (USD MILLION)
TABLE 30 UNITED ARAB EMIRATES COMPLETION AND WORKOVER SERVICES IN OILFIELD SERVICES MARKET, BY TYPE, 2021-2030 (USD MILLION)
TABLE 31 UNITED ARAB EMIRATES PROCESSING AND SEPARATION SERVICES IN OILFIELD SERVICES MARKET, BY TYPE, 2021-2030 (USD MILLION)
TABLE 32 UNITED ARAB EMIRATES RESERVOIR SERVICES IN OILFIELD SERVICES MARKET, BY TYPE, 2021-2030 (USD MILLION)
TABLE 33 UNITED ARAB EMIRATES OILFIELD SERVICES MARKET, BY APPLICATION, 2021-2030 (USD MILLION)
TABLE 34 UNITED ARAB EMIRATES OFFSHORE IN OILFIELD SERVICES MARKET, BY TYPE, 2021-2030 (USD MILLION)
TABLE 35 KUWAIT OILFIELD SERVICES MARKET, BY TYPE, 2021-2030 (USD MILLION)
TABLE 36 KUWAIT OILFIELD SERVICES MARKET, BY SERVICE TYPE, 2021-2030 (USD MILLION)
TABLE 37 KUWAIT DRILLING SERVICES IN OILFIELD SERVICES MARKET, BY TYPE, 2021-2030 (USD MILLION)
TABLE 38 KUWAIT COMPLETION AND WORKOVER SERVICES IN OILFIELD SERVICES MARKET, BY TYPE, 2021-2030 (USD MILLION)
TABLE 39 KUWAIT PROCESSING AND SEPARATION SERVICES IN OILFIELD SERVICES MARKET, BY TYPE, 2021-2030 (USD MILLION)
TABLE 40 KUWAIT RESERVOIR SERVICES IN OILFIELD SERVICES MARKET, BY TYPE, 2021-2030 (USD MILLION)
TABLE 41 KUWAIT OILFIELD SERVICES MARKET, BY APPLICATION, 2021-2030 (USD MILLION)
TABLE 42 KUWAIT OFFSHORE IN OILFIELD SERVICES MARKET, BY TYPE, 2021-2030 (USD MILLION)
TABLE 43 QATAR OILFIELD SERVICES MARKET, BY TYPE, 2021-2030 (USD MILLION)
TABLE 44 QATAR OILFIELD SERVICES MARKET, BY SERVICE TYPE, 2021-2030 (USD MILLION)
TABLE 45 QATAR DRILLING SERVICES IN OILFIELD SERVICES MARKET, BY TYPE, 2021-2030 (USD MILLION)
TABLE 46 QATAR COMPLETION AND WORKOVER SERVICES IN OILFIELD SERVICES MARKET, BY TYPE, 2021-2030 (USD MILLION)
TABLE 47 QATAR PROCESSING AND SEPARATION SERVICES IN OILFIELD SERVICES MARKET, BY TYPE, 2021-2030 (USD MILLION)
TABLE 48 QATAR RESERVOIR SERVICES IN OILFIELD SERVICES MARKET, BY TYPE, 2021-2030 (USD MILLION)
TABLE 49 QATAR OILFIELD SERVICES MARKET, BY APPLICATION, 2021-2030 (USD MILLION)
TABLE 50 QATAR OFFSHORE IN OILFIELD SERVICES MARKET, BY TYPE, 2021-2030 (USD MILLION)
TABLE 51 OMAN OILFIELD SERVICES MARKET, BY TYPE, 2021-2030 (USD MILLION)
TABLE 52 OMAN OILFIELD SERVICES MARKET, BY SERVICE TYPE, 2021-2030 (USD MILLION)
TABLE 53 OMAN DRILLING SERVICES IN OILFIELD SERVICES MARKET, BY TYPE, 2021-2030 (USD MILLION)
TABLE 54 OMAN COMPLETION AND WORKOVER SERVICES IN OILFIELD SERVICES MARKET, BY TYPE, 2021-2030 (USD MILLION)
TABLE 55 OMAN PROCESSING AND SEPARATION SERVICES IN OILFIELD SERVICES MARKET, BY TYPE, 2021-2030 (USD MILLION)
TABLE 56 OMAN RESERVOIR SERVICES IN OILFIELD SERVICES MARKET, BY TYPE, 2021-2030 (USD MILLION)
TABLE 57 OMAN OILFIELD SERVICES MARKET, BY APPLICATION, 2021-2030 (USD MILLION)
TABLE 58 OMAN OFFSHORE IN OILFIELD SERVICES MARKET, BY TYPE, 2021-2030 (USD MILLION)
TABLE 59 BAHRAIN OILFIELD SERVICES MARKET, BY TYPE, 2021-2030 (USD MILLION)
TABLE 60 BAHRAIN OILFIELD SERVICES MARKET, BY SERVICE TYPE, 2021-2030 (USD MILLION)
TABLE 61 BAHRAIN DRILLING SERVICES IN OILFIELD SERVICES MARKET, BY TYPE, 2021-2030 (USD MILLION)
TABLE 62 BAHRAIN COMPLETION AND WORKOVER SERVICES IN OILFIELD SERVICES MARKET, BY TYPE, 2021-2030 (USD MILLION)
TABLE 63 BAHRAIN PROCESSING AND SEPARATION SERVICES IN OILFIELD SERVICES MARKET, BY TYPE, 2021-2030 (USD MILLION)
TABLE 64 BAHRAIN RESERVOIR SERVICES IN OILFIELD SERVICES MARKET, BY TYPE, 2021-2030 (USD MILLION)
TABLE 65 BAHRAIN OILFIELD SERVICES MARKET, BY APPLICATION, 2021-2030 (USD MILLION)
TABLE 66 BAHRAIN OFFSHORE IN OILFIELD SERVICES MARKET, BY TYPE, 2021-2030 (USD MILLION)
TABLE 67 ISRAEL OILFIELD SERVICES MARKET, BY TYPE, 2021-2030 (USD MILLION)
TABLE 68 ISRAEL OILFIELD SERVICES MARKET, BY SERVICE TYPE, 2021-2030 (USD MILLION)
TABLE 69 ISRAEL DRILLING SERVICES IN OILFIELD SERVICES MARKET, BY TYPE, 2021-2030 (USD MILLION)
TABLE 70 ISRAEL COMPLETION AND WORKOVER SERVICES IN OILFIELD SERVICES MARKET, BY TYPE, 2021-2030 (USD MILLION)
TABLE 71 ISRAEL PROCESSING AND SEPARATION SERVICES IN OILFIELD SERVICES MARKET, BY TYPE, 2021-2030 (USD MILLION)
TABLE 72 ISRAEL RESERVOIR SERVICES IN OILFIELD SERVICES MARKET, BY TYPE, 2021-2030 (USD MILLION)
TABLE 73 ISRAEL OILFIELD SERVICES MARKET, BY APPLICATION, 2021-2030 (USD MILLION)
TABLE 74 ISRAEL OFFSHORE IN OILFIELD SERVICES MARKET, BY TYPE, 2021-2030 (USD MILLION)
TABLE 75 REST OF MIDDLE EAST OILFIELD SERVICES MARKET, BY TYPE, 2021-2030 (USD MILLION)
TABLE 76 EUROPE OILFIELD SERVICES MARKET, BY COUNTRY, 2021-2030 (USD MILLION)
TABLE 77 EUROPE OILFIELD SERVICES MARKET, BY TYPE, 2021-2030 (USD MILLION)
TABLE 78 EUROPE OILFIELD SERVICES MARKET, BY SERVICE TYPE, 2021-2030 (USD MILLION)
TABLE 79 EUROPE DRILLING SERVICES IN OILFIELD SERVICES MARKET, BY TYPE, 2021-2030 (USD MILLION)
TABLE 80 EUROPE COMPLETION AND WORKOVER SERVICES IN OILFIELD SERVICES MARKET, BY TYPE, 2021-2030 (USD MILLION)
TABLE 81 EUROPE PROCESSING AND SEPARATION SERVICES IN OILFIELD SERVICES MARKET, BY TYPE, 2021-2030 (USD MILLION)
TABLE 82 EUROPE RESERVOIR SERVICES IN OILFIELD SERVICES MARKET, BY TYPE, 2021-2030 (USD MILLION)
TABLE 83 EUROPE OILFIELD SERVICES MARKET, BY APPLICATION, 2021-2030 (USD MILLION)
TABLE 84 EUROPE OFFSHORE IN OILFIELD SERVICES MARKET, BY TYPE, 2021-2030 (USD MILLION)
TABLE 85 RUSSIA OILFIELD SERVICES MARKET, BY TYPE, 2021-2030 (USD MILLION)
TABLE 86 RUSSIA OILFIELD SERVICES MARKET, BY SERVICE TYPE, 2021-2030 (USD MILLION)
TABLE 87 RUSSIA DRILLING SERVICES IN OILFIELD SERVICES MARKET, BY TYPE, 2021-2030 (USD MILLION)
TABLE 88 RUSSIA COMPLETION AND WORKOVER SERVICES IN OILFIELD SERVICES MARKET, BY TYPE, 2021-2030 (USD MILLION)
TABLE 89 RUSSIA PROCESSING AND SEPARATION SERVICES IN OILFIELD SERVICES MARKET, BY TYPE, 2021-2030 (USD MILLION)
TABLE 90 RUSSIA RESERVOIR SERVICES IN OILFIELD SERVICES MARKET, BY TYPE, 2021-2030 (USD MILLION)
TABLE 91 RUSSIA OILFIELD SERVICES MARKET, BY APPLICATION, 2021-2030 (USD MILLION)
TABLE 92 RUSSIA OFFSHORE IN OILFIELD SERVICES MARKET, BY TYPE, 2021-2030 (USD MILLION)
TABLE 93 NORWAY OILFIELD SERVICES MARKET, BY TYPE, 2021-2030 (USD MILLION)
TABLE 94 NORWAY OILFIELD SERVICES MARKET, BY SERVICE TYPE, 2021-2030 (USD MILLION)
TABLE 95 NORWAY DRILLING SERVICES IN OILFIELD SERVICES MARKET, BY TYPE, 2021-2030 (USD MILLION)
TABLE 96 NORWAY COMPLETION AND WORKOVER SERVICES IN OILFIELD SERVICES MARKET, BY TYPE, 2021-2030 (USD MILLION)
TABLE 97 NORWAY PROCESSING AND SEPARATION SERVICES IN OILFIELD SERVICES MARKET, BY TYPE, 2021-2030 (USD MILLION)
TABLE 98 NORWAY RESERVOIR SERVICES IN OILFIELD SERVICES MARKET, BY TYPE, 2021-2030 (USD MILLION)
TABLE 99 NORWAY OILFIELD SERVICES MARKET, BY APPLICATION, 2021-2030 (USD MILLION)
TABLE 100 NORWAY OFFSHORE IN OILFIELD SERVICES MARKET, BY TYPE, 2021-2030 (USD MILLION)
TABLE 101 U.K. OILFIELD SERVICES MARKET, BY TYPE, 2021-2030 (USD MILLION)
TABLE 102 U.K. OILFIELD SERVICES MARKET, BY SERVICE TYPE, 2021-2030 (USD MILLION)
TABLE 103 U.K. DRILLING SERVICES IN OILFIELD SERVICES MARKET, BY TYPE, 2021-2030 (USD MILLION)
TABLE 104 U.K. COMPLETION AND WORKOVER SERVICES IN OILFIELD SERVICES MARKET, BY TYPE, 2021-2030 (USD MILLION)
TABLE 105 U.K. PROCESSING AND SEPARATION SERVICES IN OILFIELD SERVICES MARKET, BY TYPE, 2021-2030 (USD MILLION)
TABLE 106 U.K. RESERVOIR SERVICES IN OILFIELD SERVICES MARKET, BY TYPE, 2021-2030 (USD MILLION)
TABLE 107 U.K. OILFIELD SERVICES MARKET, BY APPLICATION, 2021-2030 (USD MILLION)
TABLE 108 U.K. OFFSHORE IN OILFIELD SERVICES MARKET, BY TYPE, 2021-2030 (USD MILLION)
TABLE 109 DENMARK OILFIELD SERVICES MARKET, BY TYPE, 2021-2030 (USD MILLION)
TABLE 110 DENMARK OILFIELD SERVICES MARKET, BY SERVICE TYPE, 2021-2030 (USD MILLION)
TABLE 111 DENMARK DRILLING SERVICES IN OILFIELD SERVICES MARKET, BY TYPE, 2021-2030 (USD MILLION)
TABLE 112 DENMARK COMPLETION AND WORKOVER SERVICES IN OILFIELD SERVICES MARKET, BY TYPE, 2021-2030 (USD MILLION)
TABLE 113 DENMARK PROCESSING AND SEPARATION SERVICES IN OILFIELD SERVICES MARKET, BY TYPE, 2021-2030 (USD MILLION)
TABLE 114 DENMARK RESERVOIR SERVICES IN OILFIELD SERVICES MARKET, BY TYPE, 2021-2030 (USD MILLION)
TABLE 115 DENMARK OILFIELD SERVICES MARKET, BY APPLICATION, 2021-2030 (USD MILLION)
TABLE 116 DENMARK OFFSHORE IN OILFIELD SERVICES MARKET, BY TYPE, 2021-2030 (USD MILLION)
TABLE 117 ITALY OILFIELD SERVICES MARKET, BY TYPE, 2021-2030 (USD MILLION)
TABLE 118 ITALY OILFIELD SERVICES MARKET, BY SERVICE TYPE, 2021-2030 (USD MILLION)
TABLE 119 ITALY DRILLING SERVICES IN OILFIELD SERVICES MARKET, BY TYPE, 2021-2030 (USD MILLION)
TABLE 120 ITALY COMPLETION AND WORKOVER SERVICES IN OILFIELD SERVICES MARKET, BY TYPE, 2021-2030 (USD MILLION)
TABLE 121 ITALY PROCESSING AND SEPARATION SERVICES IN OILFIELD SERVICES MARKET, BY TYPE, 2021-2030 (USD MILLION)
TABLE 122 ITALY RESERVOIR SERVICES IN OILFIELD SERVICES MARKET, BY TYPE, 2021-2030 (USD MILLION)
TABLE 123 ITALY OILFIELD SERVICES MARKET, BY APPLICATION, 2021-2030 (USD MILLION)
TABLE 124 ITALY OFFSHORE IN OILFIELD SERVICES MARKET, BY TYPE, 2021-2030 (USD MILLION)
TABLE 125 TURKEY OILFIELD SERVICES MARKET, BY TYPE, 2021-2030 (USD MILLION)
TABLE 126 TURKEY OILFIELD SERVICES MARKET, BY SERVICE TYPE, 2021-2030 (USD MILLION)
TABLE 127 TURKEY DRILLING SERVICES IN OILFIELD SERVICES MARKET, BY TYPE, 2021-2030 (USD MILLION)
TABLE 128 TURKEY COMPLETION AND WORKOVER SERVICES IN OILFIELD SERVICES MARKET, BY TYPE, 2021-2030 (USD MILLION)
TABLE 129 TURKEY PROCESSING AND SEPARATION SERVICES IN OILFIELD SERVICES MARKET, BY TYPE, 2021-2030 (USD MILLION)
TABLE 130 TURKEY RESERVOIR SERVICES IN OILFIELD SERVICES MARKET, BY TYPE, 2021-2030 (USD MILLION)
TABLE 131 TURKEY OILFIELD SERVICES MARKET, BY APPLICATION, 2021-2030 (USD MILLION)
TABLE 132 TURKEY OFFSHORE IN OILFIELD SERVICES MARKET, BY TYPE, 2021-2030 (USD MILLION)
TABLE 133 GERMANY OILFIELD SERVICES MARKET, BY TYPE, 2021-2030 (USD MILLION)
TABLE 134 GERMANY OILFIELD SERVICES MARKET, BY SERVICE TYPE, 2021-2030 (USD MILLION)
TABLE 135 GERMANY DRILLING SERVICES IN OILFIELD SERVICES MARKET, BY TYPE, 2021-2030 (USD MILLION)
TABLE 136 GERMANY COMPLETION AND WORKOVER SERVICES IN OILFIELD SERVICES MARKET, BY TYPE, 2021-2030 (USD MILLION)
TABLE 137 GERMANY PROCESSING AND SEPARATION SERVICES IN OILFIELD SERVICES MARKET, BY TYPE, 2021-2030 (USD MILLION)
TABLE 138 GERMANY RESERVOIR SERVICES IN OILFIELD SERVICES MARKET, BY TYPE, 2021-2030 (USD MILLION)
TABLE 139 GERMANY OILFIELD SERVICES MARKET, BY APPLICATION, 2021-2030 (USD MILLION)
TABLE 140 GERMANY OFFSHORE IN OILFIELD SERVICES MARKET, BY TYPE, 2021-2030 (USD MILLION)
TABLE 141 NETHERLANDS OILFIELD SERVICES MARKET, BY TYPE, 2021-2030 (USD MILLION)
TABLE 142 NETHERLANDS OILFIELD SERVICES MARKET, BY SERVICE TYPE, 2021-2030 (USD MILLION)
TABLE 143 NETHERLANDS DRILLING SERVICES IN OILFIELD SERVICES MARKET, BY TYPE, 2021-2030 (USD MILLION)
TABLE 144 NETHERLANDS COMPLETION AND WORKOVER SERVICES IN OILFIELD SERVICES MARKET, BY TYPE, 2021-2030 (USD MILLION)
TABLE 145 NETHERLANDS PROCESSING AND SEPARATION SERVICES IN OILFIELD SERVICES MARKET, BY TYPE, 2021-2030 (USD MILLION)
TABLE 146 NETHERLANDS RESERVOIR SERVICES IN OILFIELD SERVICES MARKET, BY TYPE, 2021-2030 (USD MILLION)
TABLE 147 NETHERLANDS OILFIELD SERVICES MARKET, BY APPLICATION, 2021-2030 (USD MILLION)
TABLE 148 NETHERLANDS OFFSHORE IN OILFIELD SERVICES MARKET, BY TYPE, 2021-2030 (USD MILLION)
TABLE 149 FRANCE OILFIELD SERVICES MARKET, BY TYPE, 2021-2030 (USD MILLION)
TABLE 150 FRANCE OILFIELD SERVICES MARKET, BY SERVICE TYPE, 2021-2030 (USD MILLION)
TABLE 151 FRANCE DRILLING SERVICES IN OILFIELD SERVICES MARKET, BY TYPE, 2021-2030 (USD MILLION)
TABLE 152 FRANCE COMPLETION AND WORKOVER SERVICES IN OILFIELD SERVICES MARKET, BY TYPE, 2021-2030 (USD MILLION)
TABLE 153 FRANCE PROCESSING AND SEPARATION SERVICES IN OILFIELD SERVICES MARKET, BY TYPE, 2021-2030 (USD MILLION)
TABLE 154 FRANCE RESERVOIR SERVICES IN OILFIELD SERVICES MARKET, BY TYPE, 2021-2030 (USD MILLION)
TABLE 155 FRANCE OILFIELD SERVICES MARKET, BY APPLICATION, 2021-2030 (USD MILLION)
TABLE 156 FRANCE OFFSHORE IN OILFIELD SERVICES MARKET, BY TYPE, 2021-2030 (USD MILLION)
TABLE 157 SPAIN OILFIELD SERVICES MARKET, BY TYPE, 2021-2030 (USD MILLION)
TABLE 158 SPAIN OILFIELD SERVICES MARKET, BY SERVICE TYPE, 2021-2030 (USD MILLION)
TABLE 159 SPAIN DRILLING SERVICES IN OILFIELD SERVICES MARKET, BY TYPE, 2021-2030 (USD MILLION)
TABLE 160 SPAIN COMPLETION AND WORKOVER SERVICES IN OILFIELD SERVICES MARKET, BY TYPE, 2021-2030 (USD MILLION)
TABLE 161 SPAIN PROCESSING AND SEPARATION SERVICES IN OILFIELD SERVICES MARKET, BY TYPE, 2021-2030 (USD MILLION)
TABLE 162 SPAIN RESERVOIR SERVICES IN OILFIELD SERVICES MARKET, BY TYPE, 2021-2030 (USD MILLION)
TABLE 163 SPAIN OILFIELD SERVICES MARKET, BY APPLICATION, 2021-2030 (USD MILLION)
TABLE 164 SPAIN OFFSHORE IN OILFIELD SERVICES MARKET, BY TYPE, 2021-2030 (USD MILLION)
TABLE 165 SWITZERLAND OILFIELD SERVICES MARKET, BY TYPE, 2021-2030 (USD MILLION)
TABLE 166 SWITZERLAND OILFIELD SERVICES MARKET, BY SERVICE TYPE, 2021-2030 (USD MILLION)
TABLE 167 SWITZERLAND DRILLING SERVICES IN OILFIELD SERVICES MARKET, BY TYPE, 2021-2030 (USD MILLION)
TABLE 168 SWITZERLAND COMPLETION AND WORKOVER SERVICES IN OILFIELD SERVICES MARKET, BY TYPE, 2021-2030 (USD MILLION)
TABLE 169 SWITZERLAND PROCESSING AND SEPARATION SERVICES IN OILFIELD SERVICES MARKET, BY TYPE, 2021-2030 (USD MILLION)
TABLE 170 SWITZERLAND RESERVOIR SERVICES IN OILFIELD SERVICES MARKET, BY TYPE, 2021-2030 (USD MILLION)
TABLE 171 SWITZERLAND OILFIELD SERVICES MARKET, BY APPLICATION, 2021-2030 (USD MILLION)
TABLE 172 SWITZERLAND OFFSHORE IN OILFIELD SERVICES MARKET, BY TYPE, 2021-2030 (USD MILLION)
TABLE 173 BELGIUM OILFIELD SERVICES MARKET, BY TYPE, 2021-2030 (USD MILLION)
TABLE 174 BELGIUM OILFIELD SERVICES MARKET, BY SERVICE TYPE, 2021-2030 (USD MILLION)
TABLE 175 BELGIUM DRILLING SERVICES IN OILFIELD SERVICES MARKET, BY TYPE, 2021-2030 (USD MILLION)
TABLE 176 BELGIUM COMPLETION AND WORKOVER SERVICES IN OILFIELD SERVICES MARKET, BY TYPE, 2021-2030 (USD MILLION)
TABLE 177 BELGIUM PROCESSING AND SEPARATION SERVICES IN OILFIELD SERVICES MARKET, BY TYPE, 2021-2030 (USD MILLION)
TABLE 178 BELGIUM RESERVOIR SERVICES IN OILFIELD SERVICES MARKET, BY TYPE, 2021-2030 (USD MILLION)
TABLE 179 BELGIUM OILFIELD SERVICES MARKET, BY APPLICATION, 2021-2030 (USD MILLION)
TABLE 180 BELGIUM OFFSHORE IN OILFIELD SERVICES MARKET, BY TYPE, 2021-2030 (USD MILLION)
TABLE 181 FINLAND OILFIELD SERVICES MARKET, BY TYPE, 2021-2030 (USD MILLION)
TABLE 182 FINLAND OILFIELD SERVICES MARKET, BY SERVICE TYPE, 2021-2030 (USD MILLION)
TABLE 183 FINLAND DRILLING SERVICES IN OILFIELD SERVICES MARKET, BY TYPE, 2021-2030 (USD MILLION)
TABLE 184 FINLAND COMPLETION AND WORKOVER SERVICES IN OILFIELD SERVICES MARKET, BY TYPE, 2021-2030 (USD MILLION)
TABLE 185 FINLAND PROCESSING AND SEPARATION SERVICES IN OILFIELD SERVICES MARKET, BY TYPE, 2021-2030 (USD MILLION)
TABLE 186 FINLAND RESERVOIR SERVICES IN OILFIELD SERVICES MARKET, BY TYPE, 2021-2030 (USD MILLION)
TABLE 187 FINLAND OILFIELD SERVICES MARKET, BY APPLICATION, 2021-2030 (USD MILLION)
TABLE 188 FINLAND OFFSHORE IN OILFIELD SERVICES MARKET, BY TYPE, 2021-2030 (USD MILLION)
TABLE 189 SWEDEN OILFIELD SERVICES MARKET, BY TYPE, 2021-2030 (USD MILLION)
TABLE 190 SWEDEN OILFIELD SERVICES MARKET, BY SERVICE TYPE, 2021-2030 (USD MILLION)
TABLE 191 SWEDEN DRILLING SERVICES IN OILFIELD SERVICES MARKET, BY TYPE, 2021-2030 (USD MILLION)
TABLE 192 SWEDEN COMPLETION AND WORKOVER SERVICES IN OILFIELD SERVICES MARKET, BY TYPE, 2021-2030 (USD MILLION)
TABLE 193 SWEDEN PROCESSING AND SEPARATION SERVICES IN OILFIELD SERVICES MARKET, BY TYPE, 2021-2030 (USD MILLION)
TABLE 194 SWEDEN RESERVOIR SERVICES IN OILFIELD SERVICES MARKET, BY TYPE, 2021-2030 (USD MILLION)
TABLE 195 SWEDEN OILFIELD SERVICES MARKET, BY APPLICATION, 2021-2030 (USD MILLION)
TABLE 196 SWEDEN OFFSHORE IN OILFIELD SERVICES MARKET, BY TYPE, 2021-2030 (USD MILLION)
TABLE 197 REST OF EUROPE OILFIELD SERVICES MARKET, BY TYPE, 2021-2030 (USD MILLION)
List of Figure
FIGURE 1 EUROPE AND MIDDLE EAST OILFIELD SERVICES MARKET: SEGMENTATION
FIGURE 2 EUROPE AND MIDDLE EAST OILFIELD SERVICES MARKET: DATA TRIANGULATION
FIGURE 3 EUROPE AND MIDDLE EAST OILFIELD SERVICES MARKET: DROC ANALYSIS
FIGURE 4 EUROPE AND MIDDLE EAST OILFIELD SERVICES MARKET: REGIONAL VS COUNTRY MARKET ANALYSIS
FIGURE 5 EUROPE AND MIDDLE EAST OILFIELD SERVICES MARKET: COMPANY RESEARCH ANALYSIS
FIGURE 6 EUROPE AND MIDDLE EAST OILFIELD SERVICES MARKET: INTERVIEW DEMOGRAPHICS
FIGURE 7 EUROPE AND MIDDLE EAST OILFIELD SERVICES MARKET: DBMR MARKET POSITION GRID
FIGURE 8 EUROPE AND MIDDLE EAST OILFIELD SERVICES MARKET: MARKET APPLICATION COVERAGE GRID
FIGURE 9 EUROPE AND MIDDLE EAST OILFIELD SERVICES MARKET: THE MARKET CHALLENGE MATRIX
FIGURE 10 EUROPE AND MIDDLE EAST OILFIELD SERVICES MARKET: SEGMENTATION
FIGURE 11 RISING PENETRATION OF EMERGING TECHNOLOGIES IN THE OIL AND GAS SECTOR IS EXPECTED TO DRIVE THE EUROPE AND MIDDLE EAST OILFIELD SERVICES MARKET IN THE FORECAST PERIOD FROM 2023 TO 2030
FIGURE 12 THE EQUIPMENT RENTAL SEGMENT IS EXPECTED TO ACCOUNT FOR THE LARGEST SHARE OF THE EUROPE AND MIDDLE EAST OILFIELD SERVICES MARKET IN 2023 AND 2030
FIGURE 13 VENDOR SELECTION CRITERIA
FIGURE 14 DRIVERS, RESTRAINTS, OPPORTUNITIES, AND CHALLENGES OF THE EUROPE AND MIDDLE EAST OILFIELD SERVICES MARKET
FIGURE 15 EUROPE AND MIDDLE EAST OILFIELD SERVICES MARKET: SNAPSHOT (2022)
FIGURE 16 EUROPE AND MIDDLE EAST OILFIELD SERVICES MARKET: BY REGION (2022)
FIGURE 17 EUROPE AND MIDDLE EAST OILFIELD SERVICES MARKET: BY REGION (2023 & 2030)
FIGURE 18 EUROPE AND MIDDLE EAST OILFIELD SERVICES MARKET: BY REGION (2022 & 2030)
FIGURE 19 EUROPE AND MIDDLE EAST OILFIELD SERVICES MARKET: BY TYPE (2023-2030)
FIGURE 20 MIDDLE EAST OILFIELD SERVICES MARKET: SNAPSHOT (2022)
FIGURE 21 MIDDLE EAST OILFIELD SERVICES MARKET: BY COUNTRY (2022)
FIGURE 22 MIDDLE EAST OILFIELD SERVICES MARKET: BY COUNTRY (2023 & 2030)
FIGURE 23 MIDDLE EAST OILFIELD SERVICES MARKET: BY COUNTRY (2022 & 2030)
FIGURE 24 MIDDLE EAST OILFIELD SERVICES MARKET: BY TYPE (2023 - 2030)
FIGURE 25 EUROPE OILFIELD SERVICES MARKET: SNAPSHOT (2022)
FIGURE 26 EUROPE OILFIELD SERVICES MARKET: BY COUNTRY (2022)
FIGURE 27 EUROPE OILFIELD SERVICES MARKET: BY COUNTRY (2023 & 2030)
FIGURE 28 EUROPE OILFIELD SERVICES MARKET: BY COUNTRY (2022 & 2030)
FIGURE 29 EUROPE OILFIELD SERVICES MARKET: BY TYPE (2023 - 2030)
FIGURE 30 EUROPE AND MIDDLE EAST OILFIELD SERVICES MARKET: COMPANY SHARE 2022 (%)
FIGURE 31 EUROPE OILFIELD SERVICES MARKET: COMPANY SHARE 2022 (%)
FIGURE 32 MIDDLE EAST OILFIELD SERVICES MARKET: COMPANY SHARE 2022 (%)
Europe And Middle East Oilfield Services Market, Supply Chain Analysis and Ecosystem Framework
To support market growth and help clients navigate the impact of geopolitical shifts, DBMR has integrated in-depth supply chain analysis into its Europe And Middle East Oilfield Services Market research reports. This addition empowers clients to respond effectively to global changes affecting their industries. The supply chain analysis section includes detailed insights such as Europe And Middle East Oilfield Services Market consumption and production by country, price trend analysis, the impact of tariffs and geopolitical developments, and import and export trends by country and HSN code. It also highlights major suppliers with data on production capacity and company profiles, as well as key importers and exporters. In addition to research, DBMR offers specialized supply chain consulting services backed by over a decade of experience, providing solutions like supplier discovery, supplier risk assessment, price trend analysis, impact evaluation of inflation and trade route changes, and comprehensive market trend analysis.
Data collection and base year analysis are done using data collection modules with large sample sizes. The stage includes obtaining market information or related data through various sources and strategies. It includes examining and planning all the data acquired from the past in advance. It likewise envelops the examination of information inconsistencies seen across different information sources. The market data is analysed and estimated using market statistical and coherent models. Also, market share analysis and key trend analysis are the major success factors in the market report. To know more, please request an analyst call or drop down your inquiry.
The key research methodology used by DBMR research team is data triangulation which involves data mining, analysis of the impact of data variables on the market and primary (industry expert) validation. Data models include Vendor Positioning Grid, Market Time Line Analysis, Market Overview and Guide, Company Positioning Grid, Patent Analysis, Pricing Analysis, Company Market Share Analysis, Standards of Measurement, Global versus Regional and Vendor Share Analysis. To know more about the research methodology, drop in an inquiry to speak to our industry experts.
Data Bridge Market Research is a leader in advanced formative research. We take pride in servicing our existing and new customers with data and analysis that match and suits their goal. The report can be customized to include price trend analysis of target brands understanding the market for additional countries (ask for the list of countries), clinical trial results data, literature review, refurbished market and product base analysis. Market analysis of target competitors can be analyzed from technology-based analysis to market portfolio strategies. We can add as many competitors that you require data about in the format and data style you are looking for. Our team of analysts can also provide you data in crude raw excel files pivot tables (Fact book) or can assist you in creating presentations from the data sets available in the report.


