
Europe Edible Oils Market
Market Size in USD Billion
 USD
15.44 Billion
USD
24.06 Billion
2024
2032
USD
15.44 Billion
USD
24.06 Billion
2024
2032
| 2025 - 2032 | |
| USD 15.44 Billion | |
| USD 24.06 Billion | |
| % | |
|
Europe Edible Oil Market Size
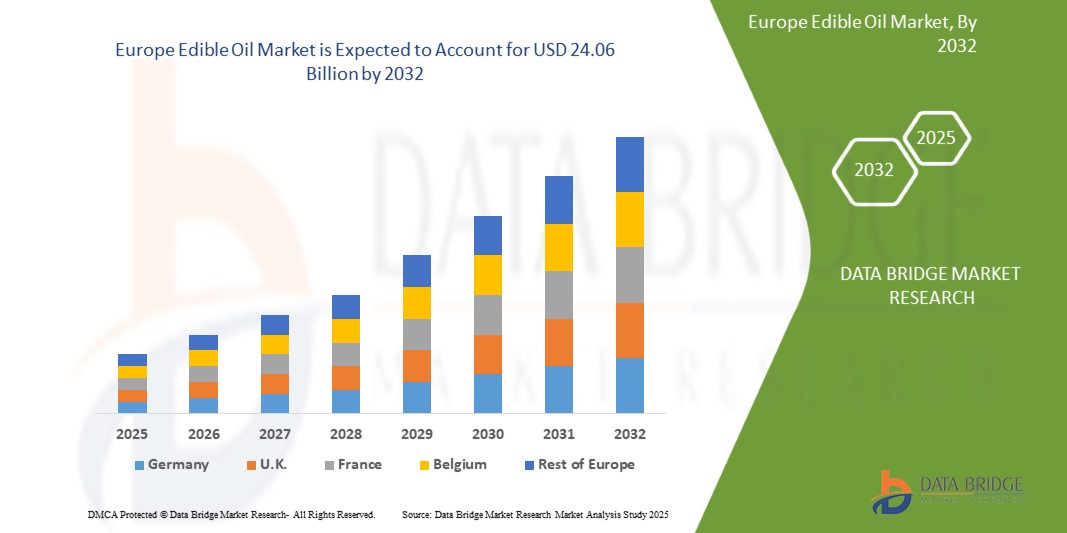
- The Europe edible oil market size was valued at USD 15.44 billion in 2024 and is expected to reach USD 24.06 billion by 2032, at a CAGR of 5.70% during the forecast period
- The market growth is largely fuelled by the increasing demand for healthier cooking oils, rising health consciousness among consumers, and expanding applications of edible oils across food processing, pharmaceuticals, and cosmetics sectors
- Growing preference for sustainable and non-GMO oil sources is also playing a key role in shaping the demand dynamics across the region
Europe Edible Oil Market Analysis
- The market is witnessing steady growth due to a shift in consumer preferences towards plant-based and low-cholesterol oils such as olive, sunflower, and canola oil
- Countries such as Germany, France, and Italy are leading in consumption, driven by strong culinary traditions and awareness of nutritional benefits
- Germany edible oil market accounted for the largest revenue share in Western Europe in 2024, attributed to its highly developed food manufacturing sector and growing consumer interest in premium and organic oil options
- U.K. is expected to witness the highest compound annual growth rate (CAGR) in the Europe edible oil market due to increasing consumer preference for healthier oil variants such as olive oil and avocado oil. The rise in plant-based diets, coupled with growing awareness about nutritional benefits and sustainability, is driving demand in the country
- The sunflower oil segment dominated the market with the largest revenue share of 28.9% in 2024, driven by its wide availability, mild flavor, and suitability for cooking and frying applications. Consumers across Europe prefer sunflower oil for its heart-health benefits and high vitamin E content. Countries such as Germany and Ukraine contribute significantly to the regional demand and supply of sunflower oil
Report Scope and Europe Edible Oil Market Segmentation
|
Attributes |
Europe Edible Oil Key Market Insights |
|
Segments Covered |
|
|
Countries Covered |
Europe
|
|
Key Market Players |
|
|
Market Opportunities |
|
|
Value Added Data Infosets |
In addition to the insights on market scenarios such as market value, growth rate, segmentation, geographical coverage, and major players, the market reports curated by the Data Bridge Market Research also include in-depth expert analysis, pricing analysis, brand share analysis, consumer survey, demography analysis, supply chain analysis, value chain analysis, raw material/consumables overview, vendor selection criteria, PESTLE Analysis, Porter Analysis, and regulatory framework. |
Europe Edible Oil Market Trends
“Shift Towards Health-Conscious Oil Consumption”
- Consumers across Europe are increasingly shifting toward healthier edible oil options, such as olive oil, canola oil, and sunflower oil, driven by rising awareness of heart health and nutrition
- There is a growing preference for oils with low saturated fats and higher omega-3 content, supported by ongoing health campaigns and educational programs promoting balanced diets
- The popularity of extra virgin olive oil has surged, especially in countries such as Italy, Spain, and France, where Mediterranean diets are being widely adopted
- Functional oils fortified with vitamins, antioxidants, and other bioactive compounds are gaining traction in urban households and among fitness-conscious populations
- For instance, cold-pressed and unrefined oils are increasingly available in retail outlets across Germany and the U.K., catering to consumers seeking natural and preservative-free food ingredients
Europe Edible Oil Market Dynamics
Driver
“Rising Demand for Plant-Based and Nutrient-Rich Oils”
- The growing shift toward plant-based diets and sustainable consumption habits across Europe has significantly boosted the demand for plant-derived edible oils
- Consumers are seeking oils rich in essential nutrients, such as omega fatty acids and vitamin E, particularly from sources such as flaxseed, sunflower, and canola
- This trend is amplified by increasing awareness of lifestyle diseases and the preventive role of healthy fats in daily nutrition
- Governments and health organizations in the region actively support these dietary transitions through awareness programs and revised food guidelines
- For instance, in Nordic countries, the preference for canola oil has risen due to its balanced fatty acid profile and low saturated fat content
Restraint/Challenge
“Price Volatility due to Fluctuating Raw Material Costs”
- The edible oil market in Europe faces challenges from high price volatility, primarily due to fluctuating costs of raw materials such as sunflower seeds, rapeseed, and olives
- Climate change, supply chain disruptions, and geopolitical tensions significantly impact crop yields and transportation, leading to unpredictable supply and pricing dynamics
- The dependency on imports for specific oil types, such as palm oil and soybean oil, further exacerbates vulnerability to global market shocks
- This volatility affects profit margins for producers and pricing stability for consumers, making it difficult to sustain long-term consumption patterns
- For instance, the 2022 Russia-Ukraine conflict caused a notable disruption in sunflower oil supply, which heavily impacted prices across key European markets such as Germany and the Netherlands
Europe Edible Oil Market Scope
The Europe edible oil market is segmented into four notable categories based on type, package type, distribution channel, and end user.
• By Type
On the basis of type, the Europe edible oil market is segmented into palm oil, soybean oil, rapeseed oil, sunflower oil, peanut oil, specialty blended oil, olive oil, corn oil, flaxseed oil, avocado oil, walnut oil, pumpkin seed oil, grapeseed oil, and others. The sunflower oil segment dominated the market with the largest revenue share of 28.9% in 2024, driven by its wide availability, mild flavor, and suitability for cooking and frying applications. Consumers across Europe prefer sunflower oil for its heart-health benefits and high vitamin E content. Countries such as Germany and Ukraine contribute significantly to the regional demand and supply of sunflower oil.
The olive oil segment is expected to witness the fastest growth rate from 2025 to 2032, owing to increasing health awareness and the popularity of the Mediterranean diet. Olive oil’s nutritional profile and versatility in culinary applications, particularly in countries such as Italy and Spain, are key factors driving this growth.
• By Package Type
On the basis of package type, the market is segmented into tinplate containers, HDPE (high-density polyethylene) containers, PVC (polyvinyl chloride) bottles, PET (polyethylene terephthalate) bottles, glass bottles, semi-rigid containers, flexible plastic pouches, and others. PET bottles accounted for the largest revenue share in 2024 due to their cost-efficiency, lightweight design, and durability in retail and domestic use.
Glass bottles is expected to witness the fastest growth rate from 2025 to 2032, fueled by the premium positioning of oils such as extra virgin olive oil and increasing consumer preference for sustainable and recyclable packaging.
• By Distribution Channel
On the basis of distribution channel, the Europe edible oil market is segmented into direct and indirect. The indirect segment held the largest revenue share in 2024, driven by the dominance of supermarkets, hypermarkets, and online grocery platforms across the region. The ease of availability, frequent promotional discounts, and wider brand variety attract more consumer purchases through indirect channels.
The direct segment is expected to witness the fastest growth rate from 2025 to 2032, which includes business-to-business supply and sales through cooperatives, is gaining traction in institutional and food processing units due to cost advantages and bulk purchasing flexibility.
• By End User
On the basis of end user, the market is segmented into domestic, industrial, food service, and others. The domestic segment led the market in 2024, supported by increased home cooking trends, especially post-pandemic, and growing awareness of oil quality and origin.
The food service segment is expected to witness the fastest growth rate from 2025 to 2032, owing to the resurgence of the hospitality sector and rising demand for specialty oils in commercial kitchens, restaurants, and quick-service restaurants (QSRs) across major European countries.
Europe Edible Oil Market Regional Analysis
- The Germany edible oil market accounted for the largest revenue share in Western Europe in 2024, attributed to its highly developed food manufacturing sector and growing consumer interest in premium and organic oil options
- German consumers favor oils such as rapeseed and sunflower due to their mild flavor and health benefits
- In addition, the expanding vegan and vegetarian population is increasing the usage of specialty oils in home and commercial kitchens
- Germany's commitment to sustainability and traceability in food sourcing further contributes to the market’s strong performance
U.K. Edible Oil Market Insight
The U.K. edible oil market is expected to witness the fastest growth rate from 2025 to 2032, driven by the rising popularity of ethnic and gourmet cuisines, which utilize a diverse range of oils. The growing awareness of the health impacts of cooking oils, coupled with a shift towards low-saturated fat oils, is also influencing purchasing decisions. The U.K. foodservice sector, particularly quick-service and fine dining restaurants, is embracing premium oils to meet consumer preferences for taste and nutrition.
Europe Edible Oil Market Share
The Europe Edible Oil industry is primarily led by well-established companies, including:
- Basso Fedele & Figli S.r.l. (Italy)
- BORGES INTERNATIONAL GROUP, S.L. (Spain)
- Edible Oils Ltd. (U.K.)
- Hebany Group (U.K.)
- Henry Lamotte OILS GmbH (Germany)
- Olenex Sàrl (Switzerland)
- Olympic Oils Ltd. (U.K.)
- Valtris Specialty Chemicals (U.K.)
Latest Developments in Europe Edible Oil Market
- In June 2020, Basso Fedele & Figli, announced that it’s the Extra Virgin Olive Oil is to be considered the ideal condiment for dishes for its complex and balanced composition that gives it a high nutritional value and makes it an excellent ally for our health. This shows that the company is focused over the quality of products to enhance its product portfolio
SKU-

- Interactive Data Analysis Dashboard
- Company Analysis Dashboard for high growth potential opportunities
- Research Analyst Access for customization & queries
- Competitor Analysis with Interactive dashboard
- Latest News, Updates & Trend analysis
- Harness the Power of Benchmark Analysis for Comprehensive Competitor Tracking
Europe Edible Oils Market, Supply Chain Analysis and Ecosystem Framework
To support market growth and help clients navigate the impact of geopolitical shifts, DBMR has integrated in-depth supply chain analysis into its Europe Edible Oils Market research reports. This addition empowers clients to respond effectively to global changes affecting their industries. The supply chain analysis section includes detailed insights such as Europe Edible Oils Market consumption and production by country, price trend analysis, the impact of tariffs and geopolitical developments, and import and export trends by country and HSN code. It also highlights major suppliers with data on production capacity and company profiles, as well as key importers and exporters. In addition to research, DBMR offers specialized supply chain consulting services backed by over a decade of experience, providing solutions like supplier discovery, supplier risk assessment, price trend analysis, impact evaluation of inflation and trade route changes, and comprehensive market trend analysis.
Data collection and base year analysis are done using data collection modules with large sample sizes. The stage includes obtaining market information or related data through various sources and strategies. It includes examining and planning all the data acquired from the past in advance. It likewise envelops the examination of information inconsistencies seen across different information sources. The market data is analysed and estimated using market statistical and coherent models. Also, market share analysis and key trend analysis are the major success factors in the market report. To know more, please request an analyst call or drop down your inquiry.
The key research methodology used by DBMR research team is data triangulation which involves data mining, analysis of the impact of data variables on the market and primary (industry expert) validation. Data models include Vendor Positioning Grid, Market Time Line Analysis, Market Overview and Guide, Company Positioning Grid, Patent Analysis, Pricing Analysis, Company Market Share Analysis, Standards of Measurement, Global versus Regional and Vendor Share Analysis. To know more about the research methodology, drop in an inquiry to speak to our industry experts.
Data Bridge Market Research is a leader in advanced formative research. We take pride in servicing our existing and new customers with data and analysis that match and suits their goal. The report can be customized to include price trend analysis of target brands understanding the market for additional countries (ask for the list of countries), clinical trial results data, literature review, refurbished market and product base analysis. Market analysis of target competitors can be analyzed from technology-based analysis to market portfolio strategies. We can add as many competitors that you require data about in the format and data style you are looking for. Our team of analysts can also provide you data in crude raw excel files pivot tables (Fact book) or can assist you in creating presentations from the data sets available in the report.


