
Europe Revenue Cycle Management Market
Market Size in USD Billion
 USD
11.97 Billion
USD
31.58 Billion
2024
2032
USD
11.97 Billion
USD
31.58 Billion
2024
2032
| 2025 - 2032 | |
| USD 11.97 Billion | |
| USD 31.58 Billion | |
| % | |
|
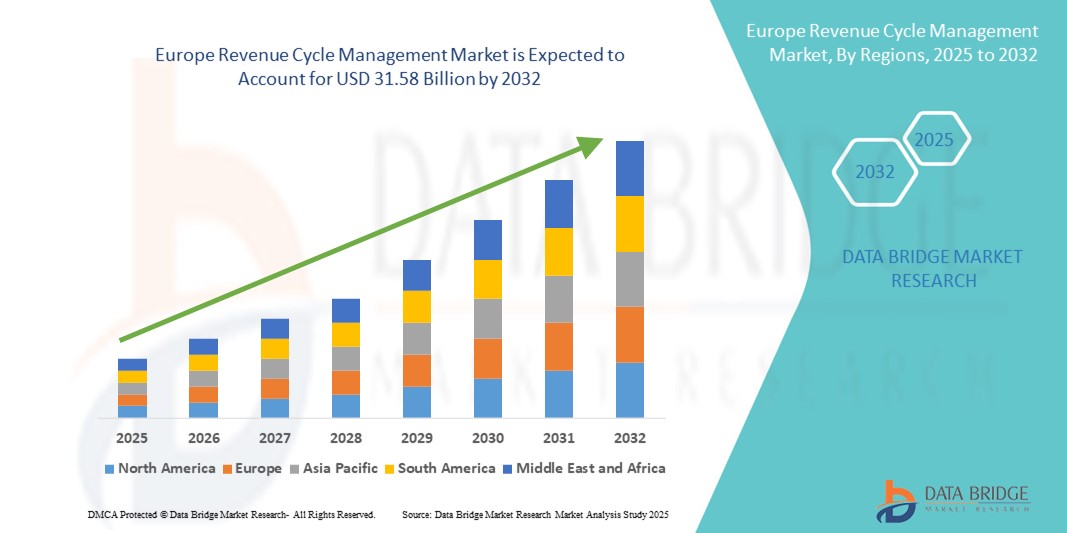
Europe Revenue Cycle Management Market Size
- The Europe revenue cycle management market size was valued at USD 11.97 billion in 2024 and is expected to reach USD 31.58 billion by 2032, at a CAGR of 12.90% during the forecast period
- The market growth in Europe for revenue cycle management (RCM) is primarily driven by healthcare providers’ increasing emphasis on financial efficiency, the need to optimize billing and claims workflows, and the rising complexity of reimbursement systems across public and private payers. As hospitals and clinics seek to minimize billing errors and reduce denial rates, the demand for robust RCM solutions—spanning patient registration, coding, claims submission, and collections—is surging across the region
- In addition, growing investments in digital transformation within the healthcare sector, coupled with supportive regulatory policies around health data security (such as GDPR) and standardization of electronic health records (EHRs) across the EU, are fostering innovation in RCM platforms. This enabling environment is encouraging adoption of next-generation RCM systems that offer enhanced automation, advanced analytics, predictive denial management, and seamless integration with clinical and financial systems—ultimately improving revenue capture and strengthening operational resilience
Europe Revenue Cycle Management Market Analysis
- The Europe Revenue Cycle Management (RCM) market is witnessing strong growth fueled by the rapid digitalization of healthcare systems, increasing pressure to improve billing accuracy, and the need to optimize operational efficiency in hospitals and clinics. The rising complexity of medical billing and compliance requirements is driving the adoption of advanced RCM solutions across the region
- Growing government support for healthcare IT adoption, coupled with a rising focus on reducing claim denials and improving cash flow, is further accelerating the implementation of RCM systems. In addition, the shift towards value-based care models and the integration of AI and analytics in RCM platforms are enabling better decision-making and faster reimbursement cycles
- Germany dominated the Europe revenue cycle management market with the largest revenue share of 30% in 2024, supported by its robust healthcare infrastructure, high adoption rate of electronic health records (EHR), and well-established payer-provider collaboration models
- U.K. is projected to register the fastest growing country in the Europe revenue cycle management market with a CAGR of 10.8% during the forecast period, driven by ongoing National Health Service (NHS) digital transformation programs, the growing role of private healthcare providers, and a surge in demand for outsourced RCM services to reduce administrative burdens
- The solutions segment dominated the Europe revenue cycle management market with a revenue share of 61.4% in 2024, primarily due to the growing adoption of comprehensive software platforms that integrate various revenue cycle functions such as billing, claims processing, and patient payment management
Report Scope and Europe Revenue Cycle Management Market Segmentation
|
Attributes |
Europe Revenue Cycle Management Key Market Insights |
|
Segments Covered |
|
|
Countries Covered |
Europe
|
|
Key Market Players |
|
|
Market Opportunities |
|
|
Value Added Data Infosets |
In addition to the insights on market scenarios such as market value, growth rate, segmentation, geographical coverage, and major players, the market reports curated by the Data Bridge Market Research also include in-depth expert analysis, pricing analysis, brand share analysis, consumer survey, demography analysis, supply chain analysis, value chain analysis, raw material/consumables overview, vendor selection criteria, PESTLE Analysis, Porter Analysis, and regulatory framework. |
Europe Revenue Cycle Management Market Trends
Advancements in Digital Solutions and Surge in Automation Driving Europe Revenue Cycle Management Market
- The Europe revenue cycle management market is witnessing substantial growth driven by rapid advancements in digital health technologies, automation, and data-driven decision-making aimed at optimizing healthcare financial operations. The rising need for streamlined billing, coding accuracy, and faster claims processing is reshaping healthcare administration across the region
- Healthcare providers are increasingly adopting AI-powered RCM solutions, robotic process automation (RPA), and predictive analytics to improve cash flow, reduce claim denials, and enhance operational efficiency. These technologies enable proactive revenue capture, minimizing manual errors and administrative delays
- Cloud-based RCM platforms are gaining traction due to their scalability, interoperability, and ability to integrate seamlessly with electronic health records (EHR) and practice management systems. This shift supports real-time access to financial and patient data, facilitating better decision-making
- Countries such as Germany, the U.K., and France are witnessing increased investments in advanced RCM software that incorporates real-time claim tracking, compliance monitoring, and automated coding updates in line with evolving healthcare regulations
- The growing complexity of reimbursement policies and value-based care models in Europe is driving demand for end-to-end RCM solutions that cover the entire revenue cycle—from patient registration and eligibility verification to payment posting and analytics
- Strategic collaborations between healthcare IT vendors, hospitals, and insurance providers are fostering innovation in payment models, enhancing staff training, and improving transparency in patient billing, ultimately boosting patient satisfaction and trust
- With Europe’s healthcare systems emphasizing cost containment, efficiency, and financial sustainability, the revenue cycle management market is set for strong growth, fueled by technological innovation, regulatory support, and increasing adoption of automated solutions across both public and private healthcare sectors
Europe Revenue Cycle Management Market Dynamics
Driver
Accelerating Growth Driven by Advances in Digital Health Solutions and Expanding Data-Driven Strategies
- The Europe Revenue Cycle Management market is witnessing substantial growth fueled by advancements in digital healthcare solutions and increasing investments in automation, analytics, and interoperability aimed at improving financial performance for healthcare providers. Key countries such as Germany, France, and the U.K. are strengthening healthcare IT infrastructure and adopting advanced RCM platforms to optimize billing accuracy, reduce claim denials, and enhance operational efficiency
- For instance, in early 2024, several leading healthcare IT companies announced progress in deploying AI-driven claim processing systems and predictive analytics tools, which promise faster reimbursements, improved compliance, and reduced administrative overhead. These innovations are expected to significantly boost market expansion throughout the forecast period
- There is a growing emphasis on personalized revenue cycle strategies involving real-time data monitoring and tailored workflow automation, enabling providers to address individual organizational needs and maximize revenue capture
- Regulatory bodies such as the European Medicines Agency (EMA) and national health authorities are indirectly supporting market growth by promoting digital transformation initiatives, encouraging interoperability between health systems, and facilitating compliance with evolving healthcare payment models
- Collaborative efforts between RCM software vendors, hospital networks, and government health agencies are fostering an ecosystem that promotes staff training, shared best practices, and awareness campaigns, all of which are vital for expanding adoption and optimizing financial performance in the healthcare sector
Restraint/Challenge
Infrastructure Gaps and Uneven Technology Adoption Across Regions
- Despite significant technological advancements in revenue cycle management (RCM) solutions and implementation services, the high associated costs continue to be a major barrier to widespread adoption, especially in Eastern European countries and rural regions where healthcare IT budgets are constrained. These financial limitations often prevent smaller healthcare providers from investing in state-of-the-art RCM systems that could optimize their revenue processes
- The complexity of fully integrated RCM platforms, which demand close collaboration among billing personnel, IT departments, compliance officers, and healthcare administrators, further restricts adoption in smaller facilities. Many such providers lack the necessary resources, technical expertise, and trained staff to manage these sophisticated systems effectively, hindering their ability to leverage the full benefits of advanced RCM technologies
- In addition, the absence of standardized best-practice guidelines for RCM system implementation, data integration, and performance monitoring results in fragmented and inconsistent adoption across the region. This issue is particularly pronounced among lower-volume healthcare providers, who struggle to establish efficient workflows and measure outcomes accurately, thereby limiting the overall impact of RCM solutions
- To overcome these challenges and support sustainable growth in Europe’s Revenue Cycle Management market, increased government initiatives and funding are essential. Enhanced cross-border collaboration in digital health innovation, alongside the development of specialized training centers dedicated to RCM best practices, can equip healthcare providers with the skills and knowledge needed to effectively implement and utilize these systems, ultimately broadening access and improving financial performance across diverse healthcare settings
Europe Revenue Cycle Management Market Scope
The market is segmented on the basis of product & services, delivery mode, type, function, and end user.
- By Product & Services
On the basis of product & services, the Europe revenue cycle management market is segmented into solutions and outsourcing services. The solutions segment captured the largest revenue share of 61.4% in 2024, primarily due to the growing adoption of comprehensive software platforms that integrate various revenue cycle functions such as billing, claims processing, and patient payment management. Healthcare organizations increasingly prefer these all-in-one solutions for their ability to enhance operational efficiency, improve cash flow, and ensure regulatory compliance.
Meanwhile, the outsourcing services segment is anticipated to register the fastest CAGR of 9.2% from 2025 to 2032. This growth is fueled by the rising trend of healthcare providers partnering with specialized external vendors to manage complex revenue cycle processes, thereby reducing internal administrative burdens and cutting operational costs while focusing on core clinical activities.
- By Delivery Mode
On the basis of delivery mode, the Europe revenue cycle management market is segmented into on-premise solutions and cloud-based solutions. In 2024, on-premise solutions held a substantial market share of 54.6%, favored by healthcare organizations that prioritize data security, control, and compliance with regional data protection regulations such as GDPR. These organizations typically prefer hosting their RCM software within their internal infrastructure to maintain direct oversight.
However, cloud-based solutions are expected to demonstrate the fastest CAGR of 10.3% over the forecast period. The surge in demand for cloud platforms is driven by their scalability, lower upfront costs, ease of updates, and remote accessibility—features that are particularly appealing to smaller hospitals and clinics aiming to modernize their revenue cycle operations without heavy capital investments.
- By Type
On the basis of type, the Europe revenue cycle management market is segmented into integrated and standalone solutions. Integrated solutions dominated the market with a revenue share of 58.7% in 2024, due to their ability to provide a seamless experience by consolidating multiple revenue cycle functions into a single platform. This integration reduces errors, eliminates redundant data entry, and streamlines workflows across departments such as billing, coding, and claims management.
On the other hand, Standalone solutions are poised to grow at a CAGR of 8.5% from 2025 to 2032. This segment benefits from demand among niche healthcare providers or payers that require specialized tools focused on specific functions, such as clinical documentation improvement or claims adjudication, without the need for full-suite software.
- By Function
On the basis of function, the Europe revenue cycle management market is segmented into claims & denial management, medical coding & billing, electronic health record (EHR), clinical documentation improvement (CDI), insurance, and other functions. Claims & denial management accounted for the largest market share of 29.8% in 2024, driven by the critical need to reduce claim denials and accelerate reimbursement cycles. Efficient claims processing helps healthcare providers improve revenue realization and minimize delays caused by payer rejections or errors.
The clinical documentation improvement segment is forecasted to grow rapidly with a CAGR of 9.0%, as healthcare providers recognize the importance of CDI programs in ensuring compliance, optimizing reimbursements, and enhancing patient care quality. In addition, Insurance-related functions such as eligibility verification, benefits administration, and payer communications play a vital role in facilitating smooth transactions between providers and payers.
- By End User
On the basis of end user, the Europe revenue cycle management market is segmented into healthcare providers and healthcare payers. Healthcare Providers led the market with a commanding revenue share of 65.2% in 2024, reflecting their extensive reliance on revenue cycle management systems to handle complex billing, coding, and collection processes. The growing patient population, coupled with the rise in outpatient and elective procedures, has amplified the need for efficient financial management solutions within hospitals, clinics, and specialty care centers.
Healthcare Payers, which include insurance companies and third-party administrators, are expected to grow steadily at a CAGR of 7.9% from 2025 to 2032. This growth is attributed to payers’ increasing investment in automated claims processing, fraud detection, and data analytics to improve operational efficiency, reduce costs, and enhance customer service.
Europe Revenue Cycle Management Market Regional Analysis
- Europe dominated the global revenue cycle management market with the largest revenue share of 30.3% in 2024. This strong position is driven by the region’s advanced healthcare infrastructure, widespread digital transformation in healthcare administration, and the growing emphasis on optimizing financial operations across both public and private sectors. The increasing adoption of cloud-based RCM solutions, alongside stringent regulatory requirements such as GDPR, is enhancing data security and operational efficiency. In addition, rising patient volumes and complex reimbursement environments are encouraging healthcare providers to implement robust revenue cycle management systems, thus fueling overall market growth
- The market’s expansion in Europe benefits from robust regulatory frameworks, comprehensive reimbursement policies, and high patient engagement, which collectively promote broader adoption of RCM solutions. Governments and healthcare authorities are investing in healthcare IT modernization and promoting value-based care models that emphasize financial accountability and transparency. These initiatives, coupled with increasing awareness among providers about the need to reduce claim denials and accelerate cash flows, are key drivers of RCM adoption. Moreover, the post-pandemic focus on resilient healthcare revenue operations further accelerates demand for integrated and outsourced RCM services
- Europe is home to numerous leading healthcare IT companies and innovative technology providers specializing in revenue cycle management, enabling continuous product development and clinical integration. Strong collaborations between healthcare institutions, payers, and software vendors are fostering advancements in AI-driven claims processing, medical coding automation, and clinical documentation improvement tools. These innovations not only improve revenue recovery but also enhance compliance and patient satisfaction, reinforcing Europe’s leadership in the global RCM market
Germany Revenue Cycle Management Market Insight
The Germany revenue cycle management market led the Europe revenue cycle management market with a significant revenue share of 30% in 2024. This dominance stems from Germany’s highly developed healthcare system, extensive network of hospitals and specialty clinics, and early adoption of cutting-edge financial management technologies. The country benefits from a strong healthcare IT industry and well-structured reimbursement frameworks that facilitate widespread use of integrated and cloud-based RCM solutions. In addition, Germany’s aging population and increasing demand for elective procedures are driving investments in efficient revenue cycle operations. Collaborations between healthcare providers and technology firms are also promoting innovations such as AI-powered coding and billing platforms, which help reduce errors and improve cash flow.
U.K. Revenue Cycle Management Market Insight
The U.K. revenue cycle management market accounted for 10.8% of the Europe market in 2024 and is poised for substantial growth during the forecast period. This expansion is driven by the National Health Service (NHS) initiatives aimed at modernizing healthcare administration and improving financial transparency. Increasing adoption of cloud-based RCM platforms, alongside growing private healthcare services, supports enhanced operational efficiency and patient billing accuracy. The rising focus on reducing claim denials and optimizing reimbursement processes in both public and private sectors is fostering demand. Moreover, technological advancements in clinical documentation improvement and automated claims management are boosting RCM adoption rates throughout the region.
Europe Revenue Cycle Management Market Share
The Europe revenue cycle management industry is primarily led by well-established companies, including:
- Cerner Corporation (U.S.)
- Conduent Incorporated (U.S.)
- McKesson Corporation (U.S.)
- Optum, Inc. (U.S.)
- AGFA-Gevaert Group (Belgium)
- TietoEVRY Corporation (Finland)
- Comarch SA (Poland)
- Dedalus Group (Italy)
- CGI Group Inc. (Canada)
- DXC Technology Company (U.S.)
- Change Healthcare (U.S.)
- Medidata Solutions (U.S.)
- PHOENIX group (Germany)
- Allscripts Healthcare Solutions, Inc. (U.S.)
- NextGen Healthcare (U.S.)
- Allogene Therapeutics (U.K.)
- Siemens Healthineers (Germany)
- IBM Watson Health (U.S.)
- R1 RCM Inc. (U.S.)
- Optima Healthcare Solutions (U.K.)
- Huron Consulting Group (U.S.)
- GE Healthcare (U.K.)
Latest Developments in Europe Revenue Cycle Management market
- In May 2025, Infinx acquired the healthcare RCM business of U.S.-based i3 Verticals for $96 million. This acquisition strengthens Infinx's market presence in the healthcare RCM space and expands its footprint into new customer segments, including academic medical centers and large provider groups. The deal also adds a highly experienced team and a well-established customer base to Infinx's portfolio
- In May 2024, KKR, a leading global investment firm, acquired a significant minority stake in Infinx, a provider of AI-powered healthcare revenue cycle solutions. This partnership aims to accelerate Infinx's growth and expand its network, leveraging KKR's extensive experience in the global healthcare and technology sectors to support bolt-on acquisitions and enhance financial performance
- In February 2025, Infinx unveiled its Revenue Cycle Agent Platform and Document Capture AI Agent Platform at ViVE 2025. These agentic platforms integrate Generative AI (GenAI), automation, and human expertise to improve financial outcomes and eliminate inefficiencies in revenue cycle workflows. The platforms aim to streamline processes and enhance the overall efficiency of revenue cycle management
- In August 2024, Veradigm strengthened its end-to-end revenue cycle services portfolio to help bring added value to clients and unlock additional market opportunities. The company aims to enhance its capabilities in delivering comprehensive revenue cycle management solutions to healthcare providers, thereby improving financial performance and operational efficiency
- In September 2022, AGS Health launched the AGS AI Platform, integrating AI, automation, and human expertise to maximize end-to-end revenue cycle management for healthcare providers. The platform combines intelligent robotic process automation (RPA), machine learning (ML), natural language understanding (NLU), and 24/7 dedicated human labor services to provide configurable staffing augmentation based on the unique needs of revenue cycle teams
- In July 2021, a collaboration between Baystate Health Collaborates and Cerner took place, to improve the digital health platform and provide consumer friendly access to Healthcare. The digital and virtual technologies in Healthcare increased with self-care demands. Electronic health records will ensure relevant client information and their simpler access which will improve the client services offered
- In September 2021, Walmart health has announced their decision to partner with Epic systems to adopt epic systems EHR to improve patient data access for all Walmart health stakeholders such as patients, payers and health care providers. This patient portal will allow the members to access their health records, appointment timings, reach out to health care providers, and physicians and also pay medical bills using their phones or computers. Disintegration of Information Technology with Healthcare will strengthen the Healthcare offerings and allow broadening of customer base
SKU-

- Interactive Data Analysis Dashboard
- Company Analysis Dashboard for high growth potential opportunities
- Research Analyst Access for customization & queries
- Competitor Analysis with Interactive dashboard
- Latest News, Updates & Trend analysis
- Harness the Power of Benchmark Analysis for Comprehensive Competitor Tracking
Data collection and base year analysis are done using data collection modules with large sample sizes. The stage includes obtaining market information or related data through various sources and strategies. It includes examining and planning all the data acquired from the past in advance. It likewise envelops the examination of information inconsistencies seen across different information sources. The market data is analysed and estimated using market statistical and coherent models. Also, market share analysis and key trend analysis are the major success factors in the market report. To know more, please request an analyst call or drop down your inquiry.
The key research methodology used by DBMR research team is data triangulation which involves data mining, analysis of the impact of data variables on the market and primary (industry expert) validation. Data models include Vendor Positioning Grid, Market Time Line Analysis, Market Overview and Guide, Company Positioning Grid, Patent Analysis, Pricing Analysis, Company Market Share Analysis, Standards of Measurement, Global versus Regional and Vendor Share Analysis. To know more about the research methodology, drop in an inquiry to speak to our industry experts.
Data Bridge Market Research is a leader in advanced formative research. We take pride in servicing our existing and new customers with data and analysis that match and suits their goal. The report can be customized to include price trend analysis of target brands understanding the market for additional countries (ask for the list of countries), clinical trial results data, literature review, refurbished market and product base analysis. Market analysis of target competitors can be analyzed from technology-based analysis to market portfolio strategies. We can add as many competitors that you require data about in the format and data style you are looking for. Our team of analysts can also provide you data in crude raw excel files pivot tables (Fact book) or can assist you in creating presentations from the data sets available in the report.


