
Global Cancer Biological Therapy Market
Market Size in USD Billion
 USD
133.32 Billion
USD
246.76 Billion
2025
2033
USD
133.32 Billion
USD
246.76 Billion
2025
2033
| 2026 - 2033 | |
| USD 133.32 Billion | |
| USD 246.76 Billion | |
| % | |
|
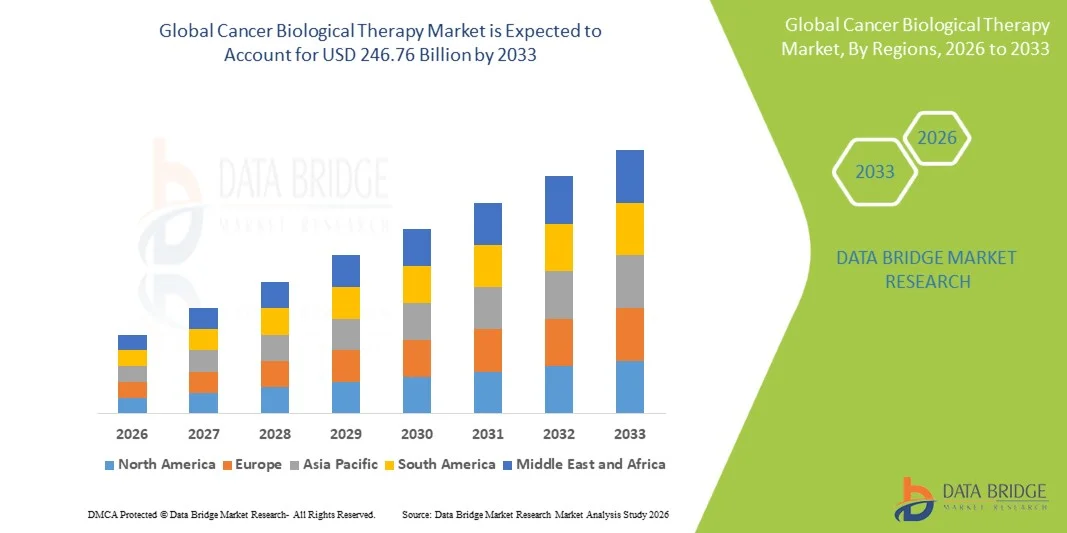
Cancer Biological Therapy Market Size
- The global cancer biological therapy market size was valued at USD 133.32 billion in 2025 and is expected to reach USD 246.76 billion by 2033, at a CAGR of 8.00% during the forecast period
- The market growth is largely driven by the increasing prevalence of various types of cancers worldwide, coupled with continuous advancements in biologics such as monoclonal antibodies, immunotherapies, and gene-based therapies, which are transforming oncology treatment paradigms
- Furthermore, rising adoption of personalized medicine, growing investments in oncology research and development, and expanding clinical pipelines from pharmaceutical and biotechnology companies are enhancing treatment efficacy and patient outcomes, thereby strengthening the demand for cancer biological therapies. These converging factors are accelerating the uptake of biologic-based cancer treatments, significantly boosting the industry's growth
Cancer Biological Therapy Market Analysis
- Cancer biological therapies, encompassing treatments such as monoclonal antibodies, checkpoint inhibitors, cytokines, and gene-based therapies, are increasingly becoming a cornerstone of modern oncology due to their ability to precisely target cancer cells while minimizing damage to healthy tissues, thereby improving treatment efficacy and patient outcomes in both solid tumors and hematological malignancies
- The growing demand for cancer biological therapies is primarily driven by the rising global cancer burden, rapid advancements in immuno-oncology, increasing approvals of biologics by regulatory authorities, and a strong shift toward personalized and targeted treatment approaches that improve survival rates and reduce adverse effects compared to conventional chemotherapy
- North America dominated the cancer biological therapy market with the largest revenue share of 42.5% in 2025, supported by advanced healthcare infrastructure, high healthcare expenditure, strong presence of leading biotechnology and pharmaceutical companies, and early adoption of innovative therapies, with the United States witnessing substantial uptake of immunotherapies and targeted biologics across major cancer indications such as lung, breast, and hematologic cancers
- Asia-Pacific is expected to be the fastest growing region in the cancer biological therapy market during the forecast period due to the rising incidence of cancer, improving healthcare infrastructure, increasing investments in biotechnology, expanding access to advanced therapies, and growing awareness and diagnosis rates across emerging economies
- Monoclonal antibodies segment dominated the cancer biological therapy market with a substantial market share of 38.9% in 2025, driven by their wide clinical applications, strong therapeutic efficacy across multiple cancer types, continuous pipeline developments, and increasing adoption in combination therapies alongside chemotherapy, radiation, and other immunotherapeutic approaches
Report Scope and Cancer Biological Therapy Market Segmentation
|
Attributes |
Cancer Biological Therapy Key Market Insights |
|
Segments Covered |
|
|
Countries Covered |
North America
Europe
Asia-Pacific
Middle East and Africa
South America
|
|
Key Market Players |
|
|
Market Opportunities |
|
|
Value Added Data Infosets |
In addition to the insights on market scenarios such as market value, growth rate, segmentation, geographical coverage, and major players, the market reports curated by the Data Bridge Market Research also include in-depth expert analysis, patient epidemiology, pipeline analysis, pricing analysis, and regulatory framework |
Cancer Biological Therapy Market Trends
“Expansion of Immune Checkpoint Inhibitors and Combination Therapies”
- A significant and accelerating trend in the global cancer biological therapy market is the growing adoption of immune checkpoint inhibitors and their integration into combination treatment regimens with chemotherapy, targeted therapy, and other biologics, enhancing overall therapeutic outcomes
- For instance, drugs targeting PD-1/PD-L1 pathways such as pembrolizumab and nivolumab are widely used across multiple cancer types including lung, melanoma, and renal cancers, demonstrating improved survival rates compared to conventional therapies
- The use of combination therapies is gaining traction as it helps overcome tumor resistance mechanisms and improves patient response rates by leveraging synergistic effects between different biological agents and treatment modalities
- Furthermore, advancements in next-generation biologics such as bispecific antibodies and CAR-T cell therapies are expanding the treatment landscape by enabling more precise targeting of cancer cells while minimizing off-target effects
- The integration of biomarker-based patient selection is further enhancing the effectiveness of these therapies by identifying patients most likely to respond, thereby improving clinical outcomes and optimizing treatment strategies
- The increasing pipeline of biologics under clinical trials and rising regulatory approvals are reinforcing this trend, as pharmaceutical companies continue to invest heavily in immuno-oncology innovations across both solid and hematological malignancies
- Moreover, increasing collaboration between biotechnology firms and academic research institutions is fostering innovation and speeding up the translation of novel biological concepts into clinically viable therapies
Cancer Biological Therapy Market Dynamics
Driver
“Rising Cancer Incidence and Increasing Adoption of Targeted Immunotherapies”
- The increasing global burden of cancer, coupled with the growing preference for targeted and personalized treatment approaches, is a major driver accelerating the demand for cancer biological therapies across diverse oncology indications
- For instance, according to global cancer statistics reported in recent years, cancer cases are rising due to aging populations, lifestyle changes, and environmental factors, leading to higher demand for advanced and effective treatment options
- As patients and healthcare providers shift away from traditional chemotherapy toward biologics with improved efficacy and reduced side effects, the adoption of monoclonal antibodies, checkpoint inhibitors, and other immunotherapies continues to expand
- Furthermore, increasing healthcare expenditure, improved access to advanced treatment options, and supportive government initiatives for oncology research and drug approvals are further supporting market growth
- The growing number of clinical trials and robust R&D investments by leading pharmaceutical and biotechnology companies are accelerating innovation and expanding the availability of novel biologic therapies
- In addition, rising awareness about early diagnosis and treatment, along with the integration of precision medicine approaches, is further driving the utilization of cancer biological therapies in both developed and emerging markets
- Moreover, continuous advancements in diagnostic technologies, including next-generation sequencing and companion diagnostics, are enabling more accurate patient stratification, thereby increasing the effectiveness and adoption of biologic therapies
- Increasing collaborations and strategic partnerships among key market players are also contributing to faster drug development cycles and broader commercialization of innovative oncology biologics
Restraint/Challenge
“High Treatment Costs and Complex Manufacturing Processes”
- Concerns surrounding the high cost of cancer biological therapies and the complexity of their manufacturing processes pose significant challenges to widespread adoption across various regions
- For instance, advanced biologics such as CAR-T cell therapies and monoclonal antibodies require sophisticated production techniques, specialized facilities, and strict quality control measures, contributing to elevated development and production costs
- The high cost of treatment often limits patient accessibility, particularly in low- and middle-income countries where healthcare reimbursement systems may not fully cover biologic therapies
- Furthermore, the need for personalized treatment approaches and patient-specific manufacturing in certain therapies adds to logistical complexities and longer production timelines
- Regulatory hurdles and stringent approval processes for biologics also increase time-to-market and development expenses, creating additional barriers for market entrants
- Overcoming these challenges through cost optimization, biosimilar development, improved manufacturing technologies, and supportive reimbursement frameworks will be critical for enhancing accessibility and sustaining long-term market growth
- In addition, supply chain constraints and cold chain storage requirements for certain biologics further complicate distribution, increasing operational costs and limiting availability in remote or underdeveloped regions
- Moreover, limited awareness and clinical expertise in administering advanced biological therapies in some regions can hinder adoption, slowing down market penetration despite strong therapeutic potential
Cancer Biological Therapy Market Scope
The market is segmented on the basis of type, route of administration, end-users, and distribution channel.
- By Type
On the basis of type, the cancer biological therapy market is segmented into monoclonal antibodies, vaccines, cancer growth blockers, cytokines, and others. The monoclonal antibodies segment dominated the market with the largest market revenue share of 38.9% in 2025, driven by their extensive clinical applications across multiple cancer indications such as breast, lung, and hematological cancers. Their ability to specifically target cancer cell antigens while minimizing damage to healthy tissues has made them a cornerstone of modern oncology treatment. The segment also benefits from a robust pipeline of antibody-based therapies, increasing regulatory approvals, and widespread adoption in combination with chemotherapy and immunotherapy regimens. Furthermore, strong commercial presence of leading biologics and continuous innovation in antibody engineering are reinforcing their dominance in the market.
The cancer vaccines segment is anticipated to witness the fastest growth rate during the forecast period, driven by increasing research into preventive and therapeutic cancer vaccines and advancements in immunization technologies. Growing clinical success of personalized cancer vaccines and neoantigen-based approaches is expanding their application in precision oncology. Rising investments in R&D, along with increasing focus on long-term cancer prevention strategies, are further supporting segment growth. In addition, improved understanding of tumor immunology and the immune system’s response to cancer is enabling the development of more effective vaccine candidates. Expanding clinical trials and regulatory support for innovative vaccine platforms are also contributing to accelerated growth in this segment.
- By Route of Administration
On the basis of route of administration, the market is segmented into intravenous, subcutaneous, intramuscular, and others. The intravenous segment dominated the market with the largest revenue share of 64.5% in 2025, primarily due to its widespread use for administering monoclonal antibodies, immunotherapies, and other biologics that require controlled and rapid systemic delivery. Intravenous administration ensures higher bioavailability and precise dosing, which is critical for complex cancer therapies. It is the preferred route in hospital and clinical settings where patients undergo supervised treatment cycles. In addition, the established clinical protocols and compatibility with a wide range of biologic drugs further strengthen its dominance in the market.
The subcutaneous segment is expected to witness the fastest growth rate during the forecast period, driven by increasing patient preference for less invasive and more convenient administration methods. Subcutaneous delivery allows for self-administration or outpatient treatment, reducing the need for hospital visits and lowering overall healthcare costs. Advances in drug formulation and delivery devices are enabling more biologics to be administered subcutaneously without compromising efficacy. The growing trend toward home-based care and patient-centric treatment approaches is further accelerating adoption. Moreover, improved drug stability and shorter administration times are making subcutaneous routes increasingly attractive for both patients and healthcare providers.
- By End-Users
On the basis of end-users, the market is segmented into hospitals, homecare, specialty centres, and others. The hospitals segment dominated the market with the largest revenue share of 52.3% in 2025, owing to the availability of advanced infrastructure, skilled oncology professionals, and access to a wide range of biological therapies. Hospitals serve as primary centers for cancer diagnosis, treatment initiation, and management of complex cases requiring multidisciplinary care. The presence of infusion facilities and critical care support makes hospitals the preferred setting for administering intravenous biologics. In addition, high patient inflow and reimbursement coverage for hospital-based treatments further contribute to the dominance of this segment.
The homecare segment is anticipated to witness the fastest growth rate during the forecast period, driven by increasing adoption of patient-centric treatment models and the availability of biologics suitable for self-administration. Rising demand for convenience, reduced hospital burden, and cost-effectiveness are encouraging patients to opt for home-based therapies where feasible. Technological advancements in drug delivery devices and remote patient monitoring are enabling safer administration of certain biological therapies outside clinical settings. Furthermore, growing awareness among patients and caregivers, along with supportive healthcare policies, is promoting the shift toward homecare treatment environments.
- By Distribution Channel
On the basis of distribution channel, the market is segmented into hospital pharmacy, online pharmacy, and retail pharmacy. The hospital pharmacy segment dominated the market with the largest revenue share of 58.7% in 2025, driven by the direct linkage between biologic therapy administration and hospital-based treatment settings. Most cancer biological therapies are prescribed and administered within hospitals, ensuring that drugs are dispensed through in-house pharmacy systems. The need for proper storage conditions, handling requirements, and professional supervision further supports the dominance of hospital pharmacies. In addition, integrated procurement systems and institutional purchasing agreements contribute to efficient drug distribution within hospital environments.
The online pharmacy segment is expected to witness the fastest growth rate during the forecast period, fueled by the increasing digitalization of healthcare services and the growing acceptance of e-commerce platforms for pharmaceutical purchases. Online pharmacies offer convenience, home delivery, and improved accessibility, particularly for maintenance therapies and supportive medications associated with cancer treatment. The expansion of telemedicine services and digital prescriptions is further facilitating the growth of this channel. Moreover, rising internet penetration, coupled with increasing consumer trust in regulated online platforms, is accelerating the adoption of online pharmacy distribution for oncology-related products where applicable.
Cancer Biological Therapy Market Regional Analysis
- North America dominated the cancer biological therapy market with the largest revenue share of 42.5% in 2025, supported by advanced healthcare infrastructure, high healthcare expenditure, strong presence of leading biotechnology and pharmaceutical companies, and early adoption of innovative therapies
- Patients and healthcare providers in the region highly value the availability of cutting-edge therapies such as monoclonal antibodies, checkpoint inhibitors, and CAR-T cell therapies, along with well-established clinical protocols and favorable reimbursement frameworks
- This widespread adoption is further supported by significant investments in oncology research and development, the presence of leading pharmaceutical and biotechnology companies, and a technologically advanced healthcare ecosystem, establishing biological therapies as a preferred treatment option for both solid tumors and hematological cancers
U.S. Cancer Biological Therapy Market Insight
The U.S. cancer biological therapy market captured the largest revenue share within North America in 2025, driven by a high cancer burden, advanced healthcare infrastructure, and rapid adoption of innovative biologics and immunotherapies. Patients and healthcare providers increasingly prioritize targeted therapies such as monoclonal antibodies, checkpoint inhibitors, and CAR-T cell therapies due to their improved efficacy and personalized treatment approach. The presence of leading biotechnology and pharmaceutical companies, along with strong R&D investments and a favorable regulatory environment, further accelerates market growth. Moreover, widespread availability of advanced diagnostics, companion biomarkers, and robust reimbursement frameworks supports the integration of biological therapies into standard oncology care across the country.
Europe Cancer Biological Therapy Market Insight
The Europe cancer biological therapy market is projected to expand at a substantial CAGR throughout the forecast period, primarily driven by increasing cancer incidence, supportive government healthcare policies, and strong emphasis on early diagnosis and advanced treatment options. The region benefits from well-established healthcare systems and significant investments in oncology research, fostering the adoption of biologics such as monoclonal antibodies and immunotherapies. European patients and healthcare providers are increasingly inclined toward personalized medicine and targeted therapies that offer improved outcomes with fewer side effects. In addition, collaborations between research institutions, pharmaceutical companies, and regulatory bodies are enhancing access to innovative biologics across both Western and Eastern Europe.
U.K. Cancer Biological Therapy Market Insight
The U.K. cancer biological therapy market is anticipated to grow at a noteworthy CAGR during the forecast period, driven by rising cancer prevalence, strong NHS support, and increasing adoption of advanced immunotherapies. The country’s focus on early detection, precision medicine, and clinical research is encouraging the uptake of biologic treatments across various cancer types. In addition, the U.K.’s robust clinical trial ecosystem and presence of leading research institutions are facilitating the development and availability of novel therapies. Growing awareness among patients regarding targeted treatment options, along with government initiatives to improve oncology care access, is further supporting market expansion.
Germany Cancer Biological Therapy Market Insight
The Germany cancer biological therapy market is expected to expand at a considerable CAGR during the forecast period, fueled by a high standard of healthcare, strong emphasis on innovation, and increasing adoption of advanced oncology treatments. Germany’s well-developed hospital infrastructure and focus on precision medicine are promoting the use of biologics such as monoclonal antibodies and checkpoint inhibitors. The country’s regulatory environment supports timely access to new therapies, while ongoing investments in biotechnology and clinical research are strengthening the market landscape. Furthermore, growing awareness of personalized treatment approaches and increasing collaboration between academic institutions and industry players are contributing to the adoption of cancer biological therapies.
Asia-Pacific Cancer Biological Therapy Market Insight
The Asia-Pacific cancer biological therapy market is poised to grow at the fastest CAGR during the forecast period, driven by rising cancer incidence, improving healthcare infrastructure, and increasing investments in biotechnology across emerging economies such as China, India, and Japan. The region’s growing middle-class population, coupled with expanding access to advanced medical treatments, is accelerating the adoption of biologics. Government initiatives promoting healthcare modernization and increasing focus on oncology research are further supporting market growth. In addition, the presence of local manufacturers and increasing clinical trials in the region are improving affordability and availability of cancer biological therapies, thereby expanding their reach across a broader patient base.
Japan Cancer Biological Therapy Market Insight
The Japan cancer biological therapy market is gaining momentum due to its aging population, high healthcare standards, and strong focus on technological advancement in medical treatments. The country places significant emphasis on precision medicine and early cancer diagnosis, which supports the adoption of biologics such as monoclonal antibodies and immunotherapies. Japan’s regulatory framework facilitates the introduction of innovative therapies, while its advanced healthcare infrastructure ensures widespread access to treatment. In addition, integration of biologics with companion diagnostics and increasing use of combination therapies are contributing to improved patient outcomes and steady market growth.
India Cancer Biological Therapy Market Insight
The India cancer biological therapy market accounted for a growing revenue share in Asia Pacific in 2025, attributed to the rising cancer burden, expanding healthcare infrastructure, and increasing awareness of advanced treatment options. The country’s large patient population, coupled with improving access to oncology care in urban and semi-urban areas, is driving demand for biologic therapies. Government initiatives aimed at strengthening healthcare systems and promoting affordable cancer treatment are further supporting market expansion. In addition, the availability of biosimilars, growth of domestic pharmaceutical manufacturing, and increasing penetration of private healthcare providers are making cancer biological therapies more accessible and cost-effective for a broader population.
Cancer Biological Therapy Market Share
The Cancer Biological Therapy industry is primarily led by well-established companies, including:
- Merck & Co., Inc. (U.S.)
- Bristol-Myers Squibb Company (U.S.)
- F. Hoffmann-La Roche Ltd (Switzerland)
- Novartis AG (Switzerland)
- AstraZeneca (U.K.)
- Pfizer Inc. (U.S.)
- Amgen Inc. (U.S.)
- Eli Lilly and Company (U.S.)
- Sanofi (France)
- AbbVie Inc. (U.S.)
- GSK plc (U.K.)
- Bayer AG (Germany)
- Incyte Corporation (U.S.)
- BioNTech SE (Germany)
- Exelixis Inc. (U.S.)
- Adaptimmune Therapeutics plc (U.K.)
- Nanobiotix (France)
- Vir Biotechnology, Inc. (U.S.)
- Seattle Genetics, Inc. (U.S.)
- Takeda Pharmaceutical Company Limited (Japan)
What are the Recent Developments in Global Cancer Biological Therapy Market?
- In November 2025, the U.S. FDA approved Bayer’s lung cancer drug Hyrnuo, an oral kinase inhibitor for HER2-mutated non-small cell lung cancer, broadening targeted therapy options for this subgroup of patients
- In October 2025, the U.S. FDA approved a new combination therapy from Jazz Pharmaceuticals and Roche for extensive-stage small cell lung cancer (ES-SCLC) as the first first-line maintenance treatment for this aggressive disease
- In September 2025, the U.S. FDA approved Merck’s subcutaneous formulation of its blockbuster cancer immunotherapy Keytruda, branded Keytruda Qlex, enabling quicker, more convenient administration compared with traditional IV infusion
- In May 2025, multiple FDA novel oncology drug approvals were recorded, including new cancer treatments for lung cancer and multiple myeloma, marking continued regulatory momentum for innovative biologic and targeted therapies in oncology
- In April 2025, Biocon Biologics received U.S. FDA approval for Jobevne™, a biosimilar bevacizumab, expanding its oncology portfolio and providing a lower-cost alternative to the reference biologic used in multiple cancer types including colorectal and lung cancers
SKU-

- Interactive Data Analysis Dashboard
- Company Analysis Dashboard for high growth potential opportunities
- Research Analyst Access for customization & queries
- Competitor Analysis with Interactive dashboard
- Latest News, Updates & Trend analysis
- Harness the Power of Benchmark Analysis for Comprehensive Competitor Tracking
Data collection and base year analysis are done using data collection modules with large sample sizes. The stage includes obtaining market information or related data through various sources and strategies. It includes examining and planning all the data acquired from the past in advance. It likewise envelops the examination of information inconsistencies seen across different information sources. The market data is analysed and estimated using market statistical and coherent models. Also, market share analysis and key trend analysis are the major success factors in the market report. To know more, please request an analyst call or drop down your inquiry.
The key research methodology used by DBMR research team is data triangulation which involves data mining, analysis of the impact of data variables on the market and primary (industry expert) validation. Data models include Vendor Positioning Grid, Market Time Line Analysis, Market Overview and Guide, Company Positioning Grid, Patent Analysis, Pricing Analysis, Company Market Share Analysis, Standards of Measurement, Global versus Regional and Vendor Share Analysis. To know more about the research methodology, drop in an inquiry to speak to our industry experts.
Data Bridge Market Research is a leader in advanced formative research. We take pride in servicing our existing and new customers with data and analysis that match and suits their goal. The report can be customized to include price trend analysis of target brands understanding the market for additional countries (ask for the list of countries), clinical trial results data, literature review, refurbished market and product base analysis. Market analysis of target competitors can be analyzed from technology-based analysis to market portfolio strategies. We can add as many competitors that you require data about in the format and data style you are looking for. Our team of analysts can also provide you data in crude raw excel files pivot tables (Fact book) or can assist you in creating presentations from the data sets available in the report.


