
Market Analysis and Insights Global Industrial Computed Tomography Market
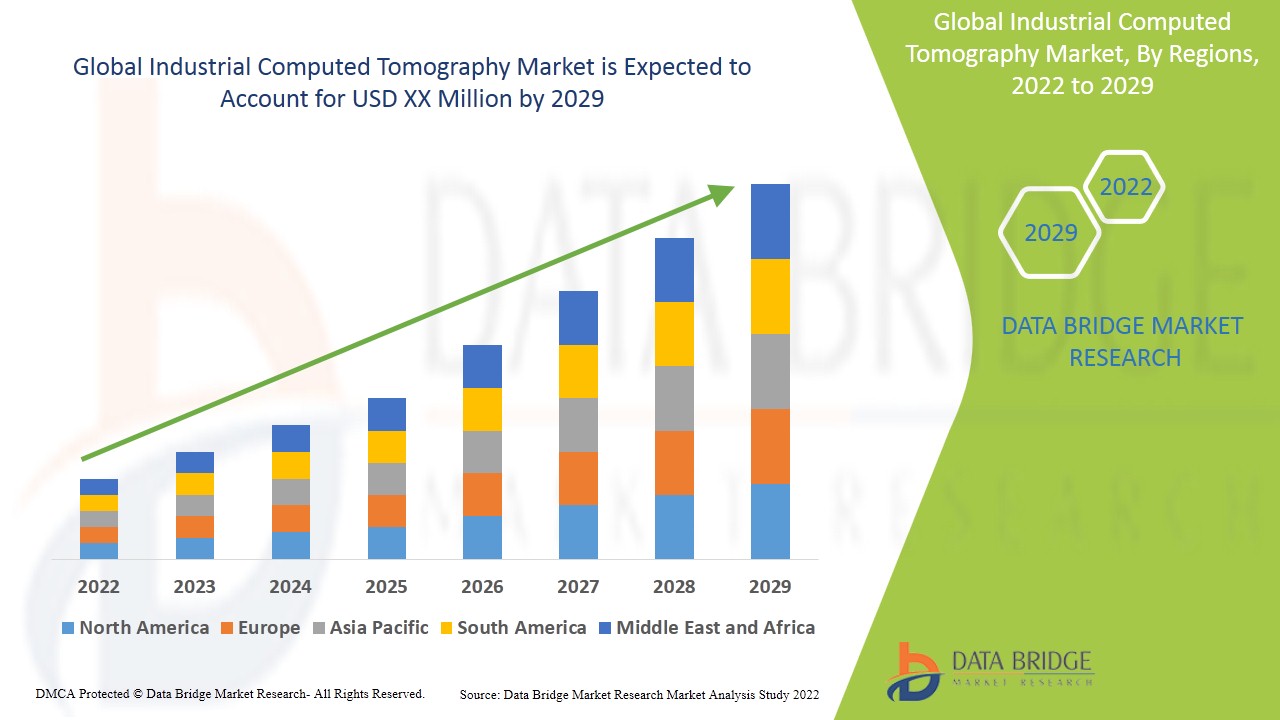
The industrial computed tomography market is expected to witness market growth at a rate of 8.30% in the forecast period of 2022 to 2029. Data Bridge Market Research report on industrial computed tomography market provides analysis and insights regarding the various factors expected to be prevalent throughout the forecast period while providing their impacts on the market’s growth. The rise in the utilization of additive manufacturing techniques in the production processes across industries, including aerospace, automotive, defense, and electronics amongst others is escalating the growth of industrial computed tomography market.
Industrial CT scanning is known to utilize high-powered x-rays to penetrate the internal geometries of an object, making a perfect inspection tool for high-value parts where destructive testing is financially exorbitant. Industrial CT scanners have several benefits including procuring the internal structure of an object, confirming extremely accurate internal dimensions, letting comparison to reference models, no shaded zones, compatibility with all shapes and sizes, no post-processing work and extremely high-resolution imaging.
Major factors that are expected to boost the growth of the industrial computed tomography market in the forecast period are the rise in the complexity in the design and manufacturing of components that utilize new processes, new materials, and intricate geometries that demand advanced quality control and assurance solutions. Furthermore, the increasing demand for early diagnosis is further anticipated to propel the growth of the industrial computed tomography market. Moreover, the growing inclination for minimally invasive diagnostic procedures is further estimated to cushion the growth of the industrial computed tomography market. On the other hand, the growing cost of installation is further projected to impede the growth of the industrial computed tomography market in the timeline period.
In addition, the rise in the geriatric population and the growing advantages of CT scans over other imaging modalities will further provide potential opportunities for the growth of the industrial computed tomography market in the coming years. However, the rise in the cost for maintenance might further challenge the growth of the industrial computed tomography market in the near future.
This industrial computed tomography market report provides details of new recent developments, trade regulations, import-export analysis, production analysis, value chain optimization, market share, the impact of domestic and localized market players, analyses opportunities in terms of emerging revenue pockets, changes in market regulations, strategic market growth analysis, market size, category market growths, application niches and dominance, product approvals, product launches, geographic expansions, technological innovations in the market. To gain more info on the industrial computed tomography market, contact Data Bridge Market Research for an Analyst Brief. Our team will help you take an informed market decision to achieve market growth.
Global Industrial Computed Tomography Market Scope and Market Size
The industrial computed tomography market is segmented on the basis of offering, application and vertical. The growth amongst these segments will help you analyse meagre growth segments in the industries and provide the users with a valuable market overview and market insights to help them in making strategic decisions for the identification of core market applications.
- On the basis of offering, the industrial computed tomography market is segmented into equipment and services. Equipment is further sub segmented into line beam scanners and cone beam scanners.
- On the basis of application, the industrial computed tomography market is segmented into flaw detection and inspection, failure analysis, assembly analysis, dimensioning and tolerancing analysis and others.
- On the basis of vertical, the industrial computed tomography market is segmented into oil and gas, aerospace and defense, automotive, electronics and others.
Industrial Computed Tomography Market Country Level Analysis
The industrial computed tomography market is analysed, and market size insights and trends are provided by country, offering, application and vertical as referenced above.
The countries covered in the industrial computed tomography market report are the U.S., Canada, and Mexico in North America, Germany, France, U.K., Netherlands, Switzerland, Belgium, Russia, Italy, Spain, Turkey, Rest of Europe in Europe, China, Japan, India, South Korea, Singapore, Malaysia, Australia, Thailand, Indonesia, Philippines, Rest of Asia-Pacific (APAC) in the Asia-Pacific (APAC), Saudi Arabia, U.A.E, South Africa, Egypt, Israel, Rest of the Middle East and Africa (MEA) as a part of the Middle East and Africa (MEA), Brazil, Argentina and Rest of South America as part of South America.
North America dominates the industrial computed tomography market due to the rise in the number of investments in the adoption of new and developed technologies by major industry players. Furthermore, the growing automotive and electronics industries and sturdy occurrence of prominent market players will further boost the growth of the industrial computed tomography market in the region during the forecast period. Asia-Pacific is projected to observe significant amount of growth in the industrial computed tomography market due to the rise in the adoption of industrial CT systems for testing and inspection purposes amongst several industries, including automotive, electronics, aerospace and defense. Furthermore, the growing manufacturing and production activities is further anticipated to propel the growth of the industrial computed tomography market in the region in the coming years.
The country section of the industrial computed tomography market report also provides individual market impacting factors and changes in regulation in the market domestically that impact the current and future trends of the market. Data points such as consumption volumes, production sites, and volumes, import-export analysis, price trend analysis, cost of raw materials, downstream and upstream value chain analysis are some of the major pointers used to forecast the market scenario for individual countries. Also, the presence and availability of global brands and their challenges faced due to large or scarce competition from local and domestic brands, the impact of domestic tariffs, and trade routes are considered while providing forecast analysis of the country data.
Healthcare Infrastructure Growth Installed Base and New Technology Penetration
The industrial computed tomography market also provides you with detailed market analysis for every country growth in healthcare expenditure for capital equipment, installed base of different kinds of products for the industrial computed tomography market, the impact of technology using lifeline curves, and changes in healthcare regulatory scenarios and their impact on the industrial computed tomography market. The data is available for the historic period 2010-2020.
Competitive Landscape and Industrial Computed Tomography Market Share Analysis
The industrial computed tomography market competitive landscape provides details by a competitor. Details included are company overview, company financials, revenue generated, market potential, investment in research and development, new market initiatives, global presence, production sites and facilities, production capacities, company strengths and weaknesses, product launch, product width and breadth, application dominance. The above data points provided are only related to the companies’ focus related to the industrial computed tomography market.
Some of the major players operating in the industrial computed tomography market are Nikon Metrology NV, OMRON Corporation, Baker Hughes, YXLON International, Carl Zeiss Meditech AG, Shimadzu Corporation, Koninklijke Philips N.V., SAMSUNG, General Electric Company, Rigaku Corporation, Bruker, Comet Group, Hitachi Ltd., Thermo Fisher Scientific, Neusoft Corporation, Medtronic, Shenzhen Mindray Bio-Medical Electronics Co., Ltd., Toshiba Corporation, and Siemens among others.
SKU-

- Interactive Data Analysis Dashboard
- Company Analysis Dashboard for high growth potential opportunities
- Research Analyst Access for customization & queries
- Competitor Analysis with Interactive dashboard
- Latest News, Updates & Trend analysis
- Harness the Power of Benchmark Analysis for Comprehensive Competitor Tracking
Table of Content
1 INTRODUCTION
1.1 OBJECTIVES OF THE STUDY
1.2 MARKET DEFINITION
1.3 OVERVIEW OF GLOBAL INDUSTRIAL COMPUTED TOMOGRAPHY MARKET
1.4 CURRENCY AND PRICING
1.5 LIMITATION
1.6 MARKETS COVERED
2 MARKET SEGMENTATION
2.1 KEY TAKEAWAYS
2.2 ARRIVING AT THE GLOBAL INDUSTRIAL COMPUTED TOMOGRAPHY MARKET SIZE
2.2.1 VENDOR POSITIONING GRID
2.2.2 TECHNOLOGY LIFE LINE CURVE
2.2.3 TRIPOD DATA VALIDATION MODEL
2.2.4 MARKET GUIDE
2.2.5 MULTIVARIATE MODELLING
2.2.6 TOP TO BOTTOM ANALYSIS
2.2.7 CHALLENGE MATRIX
2.2.8 APPLICATION COVERAGE GRID
2.2.9 STANDARDS OF MEASUREMENT
2.2.10 VENDOR SHARE ANALYSIS
2.2.11 SALES VALUE AND VOLUME
2.2.12 DATA POINTS FROM KEY PRIMARY INTERVIEWS
2.2.13 DATA POINTS FROM KEY SECONDARY DATABASES
2.3 GLOBAL GLOBAL INDUSTRIAL COMPUTED TOMOGRAPHY MARKET: RESEARCH SNAPSHOT
2.4 ASSUMPTIONS
3 MARKET OVERVIEW
3.1 DRIVERS
3.2 RESTRAINTS
3.3 OPPORTUNITIES
3.4 CHALLENGES
4 EXECUTIVE SUMMARY
5 PREMIUM INSIGHTS
5.1 PESTEL ANALYSIS
5.2 PORTER’S 5 FORCES
5.3 PATENT ANALYSIS
5.4 GOVERNMENT POLICIES
5.5 GLOBAL INDUSTRIAL COMPUTED TOMOGRAPHY MARKET ANALYSIS (QUALITATIVE AND QUANTITATIVE ANALYSIS)
6 INDUSTRY INSIGHTS
6.1 KEY PRICING STRATEGIES
6.2 KEY MARKETING STRATEGIES
6.3 INTERVIEWS WITH EQUIPMENT MANUFACTURERS
6.4 INTERVIEWS WITH SUBJECT MATTER EXPERTS
6.5 OTHER KOL SNAPSHOTS
7 REGULATORY FRAMWORK
8 GLOBAL INDUSTRIAL COMPUTED TOMOGRAPHY MARKET, BY PRODUCT TYPE
8.1 OVERVIEW
8.2 EQUIPMENT
8.2.1 FAN-BEAM SYSTEMS
8.2.1.1. HIGH ENERGY INDUSTRIAL CT
8.2.1.1.1. 2D
8.2.1.1.1.1 MARKET VALUE (USD MILLION)
8.2.1.1.1.2 MARKET VOLUME (UNIT)
8.2.1.1.1.3 AVERAGE SELLING PRICE (USD)
8.2.1.1.2. 3D
8.2.1.1.2.1 MARKET VALUE (USD MILLION)
8.2.1.1.2.2 MARKET VOLUME (UNIT)
8.2.1.1.2.3 AVERAGE SELLING PRICE (USD)
8.2.1.1.3. 4D
8.2.1.1.3.1 MARKET VALUE (USD MILLION)
8.2.1.1.3.2 MARKET VOLUME (UNIT)
8.2.1.1.3.3 AVERAGE SELLING PRICE (USD)
8.2.1.2. LOW ENERGY INDUSTRIAL CT
8.2.1.2.1. 2D
8.2.1.2.1.1 MARKET VALUE (USD MILLION)
8.2.1.2.1.2 MARKET VOLUME (UNIT)
8.2.1.2.1.3 AVERAGE SELLING PRICE (USD)
8.2.1.2.2. 3D
8.2.1.2.2.1 MARKET VALUE (USD MILLION)
8.2.1.2.2.2 MARKET VOLUME (UNIT)
8.2.1.2.2.3 AVERAGE SELLING PRICE (USD)
8.2.1.2.3. 4D
8.2.1.2.3.1 MARKET VALUE (USD MILLION)
8.2.1.2.3.2 MARKET VOLUME (UNIT)
8.2.1.2.3.3 AVERAGE SELLING PRICE (USD)
8.2.1.3. MINI-FOCUS INDUSTRIAL CT
8.2.1.3.1. 2D
8.2.1.3.1.1 MARKET VALUE (USD MILLION)
8.2.1.3.1.2 MARKET VOLUME (UNIT)
8.2.1.3.1.3 AVERAGE SELLING PRICE (USD)
8.2.1.3.2. 3D
8.2.1.3.2.1 MARKET VALUE (USD MILLION)
8.2.1.3.2.2 MARKET VOLUME (UNIT)
8.2.1.3.2.3 AVERAGE SELLING PRICE (USD)
8.2.1.3.3. 4D
8.2.1.3.3.1 MARKET VALUE (USD MILLION)
8.2.1.3.3.2 MARKET VOLUME (UNIT)
8.2.1.3.3.3 AVERAGE SELLING PRICE (USD)
8.2.2 CONE-BEAM SYSTEMS
8.2.2.1. HIGH ENERGY INDUSTRIAL CT
8.2.2.1.1. 2D
8.2.2.1.1.1 MARKET VALUE (USD MILLION)
8.2.2.1.1.2 MARKET VOLUME (UNIT)
8.2.2.1.1.3 AVERAGE SELLING PRICE (USD)
8.2.2.1.2. 3D
8.2.2.1.2.1 MARKET VALUE (USD MILLION)
8.2.2.1.2.2 MARKET VOLUME (UNIT)
8.2.2.1.2.3 AVERAGE SELLING PRICE (USD)
8.2.2.1.3. 4D
8.2.2.1.3.1 MARKET VALUE (USD MILLION)
8.2.2.1.3.2 MARKET VOLUME (UNIT)
8.2.2.1.3.3 AVERAGE SELLING PRICE (USD)
8.2.2.2. LOW ENERGY INDUSTRIAL CT
8.2.2.2.1. 2D
8.2.2.2.1.1 MARKET VALUE (USD MILLION)
8.2.2.2.1.2 MARKET VOLUME (UNIT)
8.2.2.2.1.3 AVERAGE SELLING PRICE (USD)
8.2.2.2.2. 3D
8.2.2.2.2.1 MARKET VALUE (USD MILLION)
8.2.2.2.2.2 MARKET VOLUME (UNIT)
8.2.2.2.2.3 AVERAGE SELLING PRICE (USD)
8.2.2.2.3. 4D
8.2.2.2.3.1 MARKET VALUE (USD MILLION)
8.2.2.2.3.2 MARKET VOLUME (UNIT)
8.2.2.2.3.3 AVERAGE SELLING PRICE (USD)
8.2.2.3. MINI-FOCUS INDUSTRIAL CT
8.2.2.3.1. 2D
8.2.2.3.1.1 MARKET VALUE (USD MILLION)
8.2.2.3.1.2 MARKET VOLUME (UNIT)
8.2.2.3.1.3 AVERAGE SELLING PRICE (USD)
8.2.2.3.2. 3D
8.2.2.3.2.1 MARKET VALUE (USD MILLION)
8.2.2.3.2.2 MARKET VOLUME (UNIT)
8.2.2.3.2.3 AVERAGE SELLING PRICE (USD)
8.2.2.3.3. 4D
8.2.2.3.3.1 MARKET VALUE (USD MILLION)
8.2.2.3.3.2 MARKET VOLUME (UNIT)
8.2.2.3.3.3 AVERAGE SELLING PRICE (USD)
8.3 SOFTWARE
8.4 SERVICES
8.4.1 ARTICLE INSPECTION
8.4.2 FAILURE ANALYSIS
8.4.3 GEOMETRIC DIMENSIONING & TOLERANCES ANALYSIS ANALYSIS
8.4.4 POROSITY & THICKNESS ANALYSIS
8.4.5 REVERSE ENGINEERING SERVICES
8.4.6 OTHERS
9 GLOBAL INDUSTRIAL COMPUTED TOMOGRAPHY MARKET, BY TECHNOLOGY
9.1 OVERVIEW
9.2 2D
9.3 3D
9.4 4D
10 GLOBAL INDUSTRIAL COMPUTED TOMOGRAPHY MARKET, BY APPLICATION
10.1 OVERVIEW
10.2 METROLOGY
10.2.1 NOMINAL/ACTUAL COMPARISON
10.2.2 DIMENSIONAL CONTROL
10.2.3 WALL THICKNESS ANALYSIS
10.2.4 TOOL & PROCESS OPTIMIZATION
10.2.5 DEVELOPMENT & REVERSE ENGINEERING
10.3 INSPECTION
10.3.1 DEFECT ANALYSIS
10.3.2 ASSEMBLY CONTROL
10.3.3 JOINING TECHNOLOGY CONTROL
10.3.4 ELECTRONIC TESTING
10.4 ANALYSIS
10.4.1 STRUCTURAL ANALYSIS
10.4.2 IN-SITU & 4D ANALYSIS
10.4.3 ROUGHNESS ANALYSIS
10.4.4 FIBER COMPOSITE ANALYSIS
10.5 OTHER APPLICATIONS
11 GLOBAL INDUSTRIAL COMPUTED TOMOGRAPHY MARKET, BY INDUSTRY
11.1 OVERVIEW
11.2 AUTOMOTIVE
11.3 AEROSPACE
11.4 BIOMEDICAL TECHNOLOGY
11.5 ELECTRONICS
11.6 CONSUMER GOODS
11.7 OIL & GAS
11.8 OTHERS
12 GLOBAL INDUSTRIAL COMPUTED TOMOGRAPHY MARKET, BY GEOGRAPHY
12.1 GLOBAL INDUSTRIAL COMPUTED TOMOGRAPHY MARKET (ALL SEGMENTATION PROVIDED ABOVE IS REPRESENTED IN THIS CHAPTER BY COUNTRY)
12.1.1 NORTH AMERICA
12.1.1.1. U.S.
12.1.1.1.1. U.S INDUSTRIAL COMPUTED TOMOGRAPHY MARKET, BY PRODUCT TYPE
12.1.1.1.2. U.S INDUSTRIAL COMPUTED TOMOGRAPHY MARKET, BY TECHNOLOGY
12.1.1.1.3. U.S INDUSTRIAL COMPUTED TOMOGRAPHY MARKET, BY APPLICATION
12.1.1.1.4. U.S INDUSTRIAL COMPUTED TOMOGRAPHY MARKET, BY INDUSTRY
12.1.1.2. CANADA
12.1.1.3. MEXICO
12.1.2 EUROPE
12.1.2.1. GERMANY
12.1.2.2. FRANCE
12.1.2.3. U.K.
12.1.2.4. ITALY
12.1.2.5. SPAIN
12.1.2.6. RUSSIA
12.1.2.7. TURKEY
12.1.2.8. BELGIUM
12.1.2.9. NETHERLANDS
12.1.2.10. SWITZERLAND
12.1.2.11. REST OF EUROPE
12.1.3 ASIA-PACIFIC
12.1.3.1. JAPAN
12.1.3.2. CHINA
12.1.3.3. SOUTH KOREA
12.1.3.4. INDIA
12.1.3.5. AUSTRALIA
12.1.3.6. SINGAPORE
12.1.3.7. THAILAND
12.1.3.8. MALAYSIA
12.1.3.9. INDONESIA
12.1.3.10. PHILIPPINES
12.1.3.11. REST OF ASIA-PACIFIC
12.1.4 SOUTH AMERICA
12.1.4.1. BRAZIL
12.1.4.2. ARGENTINA
12.1.4.3. REST OF SOUTH AMERICA
12.1.5 MIDDLE EAST AND AFRICA
12.1.5.1. SOUTH AFRICA
12.1.5.2. SAUDI ARABIA
12.1.5.3. UAE
12.1.5.4. EGYPT
12.1.5.5. ISRAEL
12.1.5.6. REST OF MIDDLE EAST AND AFRICA
12.1.6 KEY PRIMARY INSIGHTS: BY MAJOR COUNTRIES
13 GLOBAL INDUSTRIAL COMPUTED TOMOGRAPHY MARKET, COMPANY LANDSCAPE
13.1 COMPANY SHARE ANALYSIS: GLOBAL
13.2 COMPANY SHARE ANALYSIS: NORTH AMERICA
13.3 COMPANY SHARE ANALYSIS: EUROPE
13.4 COMPANY SHARE ANALYSIS: ASIA-PACIFIC
13.5 MERGERS & ACQUISITIONS
13.6 NEW PRODUCT DEVELOPMENT & APPROVALS
13.7 EXPANSIONS
13.8 REGULATORY CHANGES
13.9 PARTNERSHIP AND OTHER STRATEGIC DEVELOPMENTS
14 GLOBAL INDUSTRIAL COMPUTED TOMOGRAPHY MARKET, SWOT AND DBMR ANALYSIS
15 GLOBAL INDUSTRIAL COMPUTED TOMOGRAPHY MARKET, COMPANY PROFILE
15.1 BAKER HUGHES COMPANY
15.1.1 COMPANY OVERVIEW
15.1.2 REVENUE ANALYSIS
15.1.3 GEOGRAPHIC PRESENCE
15.1.4 PRODUCT PORTFOLIO
15.1.5 RECENT DEVELOPMENTS
15.2 ZEISS
15.2.1 COMPANY OVERVIEW
15.2.2 REVENUE ANALYSIS
15.2.3 GEOGRAPHIC PRESENCE
15.2.4 PRODUCT PORTFOLIO
15.2.5 RECENT DEVELOPMENTS
15.3 SAEC/KINETIC VISION, INC.
15.3.1 COMPANY OVERVIEW
15.3.2 REVENUE ANALYSIS
15.3.3 GEOGRAPHIC PRESENCE
15.3.4 PRODUCT PORTFOLIO
15.3.5 RECENT DEVELOPMENTS
15.4 BLUE STAR LIMITED.
15.4.1 COMPANY OVERVIEW
15.4.2 REVENUE ANALYSIS
15.4.3 GEOGRAPHIC PRESENCE
15.4.4 PRODUCT PORTFOLIO
15.4.5 RECENT DEVELOPMENTS
15.5 ELEMENT MATERIALS TECHNOLOGY
15.5.1 COMPANY OVERVIEW
15.5.2 REVENUE ANALYSIS
15.5.3 GEOGRAPHIC PRESENCE
15.5.4 PRODUCT PORTFOLIO
15.5.5 RECENT DEVELOPMENTS
15.6 EXACT METROLOGY INC.
15.6.1 COMPANY OVERVIEW
15.6.2 REVENUE ANALYSIS
15.6.3 GEOGRAPHIC PRESENCE
15.6.4 PRODUCT PORTFOLIO
15.6.5 RECENT DEVELOPMENTS
15.7 HAMAMATSU PHOTONICS K.K.
15.7.1 COMPANY OVERVIEW
15.7.2 REVENUE ANALYSIS
15.7.3 GEOGRAPHIC PRESENCE
15.7.4 PRODUCT PORTFOLIO
15.7.5 RECENT DEVELOPMENTS
15.8 SANYING PRECISION INSTRUMENTS CO.,LTD
15.8.1 COMPANY OVERVIEW
15.8.2 REVENUE ANALYSIS
15.8.3 GEOGRAPHIC PRESENCE
15.8.4 PRODUCT PORTFOLIO
15.8.5 RECENT DEVELOPMENTS
15.9 DANDONG AOLONG RADIATIVE INSTRUMENT GROUP CO.,LTD
15.9.1 COMPANY OVERVIEW
15.9.2 REVENUE ANALYSIS
15.9.3 GEOGRAPHIC PRESENCE
15.9.4 PRODUCT PORTFOLIO
15.9.5 RECENT DEVELOPMENTS
15.1 NORTH STAR IMAGING INC.
15.10.1 COMPANY OVERVIEW
15.10.2 REVENUE ANALYSIS
15.10.3 GEOGRAPHIC PRESENCE
15.10.4 PRODUCT PORTFOLIO
15.10.5 RECENT DEVELOPMENTS
15.11 APPLIED TECHNICAL SERVICES, LLC
15.11.1 COMPANY OVERVIEW
15.11.2 REVENUE ANALYSIS
15.11.3 GEOGRAPHIC PRESENCE
15.11.4 PRODUCT PORTFOLIO
15.11.5 RECENT DEVELOPMENTS
15.12 MICRON
15.12.1 COMPANY OVERVIEW
15.12.2 REVENUE ANALYSIS
15.12.3 GEOGRAPHIC PRESENCE
15.12.4 PRODUCT PORTFOLIO
15.12.5 RECENT DEVELOPMENTS
15.13 DRTECH
15.13.1 COMPANY OVERVIEW
15.13.2 REVENUE ANALYSIS
15.13.3 GEOGRAPHIC PRESENCE
15.13.4 PRODUCT PORTFOLIO
15.13.5 RECENT DEVELOPMENTS
15.14 X-SCAN.
15.14.1 COMPANY OVERVIEW
15.14.2 REVENUE ANALYSIS
15.14.3 GEOGRAPHIC PRESENCE
15.14.4 PRODUCT PORTFOLIO
15.14.5 RECENT DEVELOPMENTS
15.15 SCIENSCOPE
15.15.1 COMPANY OVERVIEW
15.15.2 REVENUE ANALYSIS
15.15.3 GEOGRAPHIC PRESENCE
15.15.4 PRODUCT PORTFOLIO
15.15.5 RECENT DEVELOPMENTS
15.16 EWI
15.16.1 COMPANY OVERVIEW
15.16.2 REVENUE ANALYSIS
15.16.3 GEOGRAPHIC PRESENCE
15.16.4 PRODUCT PORTFOLIO
15.16.5 RECENT DEVELOPMENTS
15.17 NIKON CORPORATION
15.17.1 COMPANY OVERVIEW
15.17.2 REVENUE ANALYSIS
15.17.3 GEOGRAPHIC PRESENCE
15.17.4 PRODUCT PORTFOLIO
15.17.5 RECENT DEVELOPMENTS
15.18 YXLON INTERNATIONAL
15.18.1 COMPANY OVERVIEW
15.18.2 REVENUE ANALYSIS
15.18.3 GEOGRAPHIC PRESENCE
15.18.4 PRODUCT PORTFOLIO
15.18.5 RECENT DEVELOPMENTS
15.19 DIVERSE DIMENSIONS
15.19.1 COMPANY OVERVIEW
15.19.2 REVENUE ANALYSIS
15.19.3 GEOGRAPHIC PRESENCE
15.19.4 PRODUCT PORTFOLIO
15.19.5 RECENT DEVELOPMENTS
15.2 EXPONENT
15.20.1 COMPANY OVERVIEW
15.20.2 REVENUE ANALYSIS
15.20.3 GEOGRAPHIC PRESENCE
15.20.4 PRODUCT PORTFOLIO
15.20.5 RECENT DEVELOPMENTS
15.21 THORLABS, INC.
15.21.1 COMPANY OVERVIEW
15.21.2 REVENUE ANALYSIS
15.21.3 GEOGRAPHIC PRESENCE
15.21.4 PRODUCT PORTFOLIO
15.21.5 RECENT DEVELOPMENTS
15.22 OGI
15.22.1 COMPANY OVERVIEW
15.22.2 REVENUE ANALYSIS
15.22.3 GEOGRAPHIC PRESENCE
15.22.4 PRODUCT PORTFOLIO
15.22.5 RECENT DEVELOPMENTS
15.23 TELEDYNE DIGITAL IMAGING INC.
15.23.1 COMPANY OVERVIEW
15.23.2 REVENUE ANALYSIS
15.23.3 GEOGRAPHIC PRESENCE
15.23.4 PRODUCT PORTFOLIO
15.23.5 RECENT DEVELOPMENTS
15.24 ADAPTIVE ENERGY
15.24.1 COMPANY OVERVIEW
15.24.2 REVENUE ANALYSIS
15.24.3 GEOGRAPHIC PRESENCE
15.24.4 PRODUCT PORTFOLIO
15.24.5 RECENT DEVELOPMENTS
15.25 DELPHI PRECISION IMAGING
15.25.1 COMPANY OVERVIEW
15.25.2 REVENUE ANALYSIS
15.25.3 GEOGRAPHIC PRESENCE
15.25.4 PRODUCT PORTFOLIO
15.25.5 RECENT DEVELOPMENTS
15.26 HAVEN METROLOGY
15.26.1 COMPANY OVERVIEW
15.26.2 REVENUE ANALYSIS
15.26.3 GEOGRAPHIC PRESENCE
15.26.4 PRODUCT PORTFOLIO
15.26.5 RECENT DEVELOPMENTS
15.27 AVON IMAGING
15.27.1 COMPANY OVERVIEW
15.27.2 REVENUE ANALYSIS
15.27.3 GEOGRAPHIC PRESENCE
15.27.4 PRODUCT PORTFOLIO
15.27.5 RECENT DEVELOPMENTS
15.28 ADVANCED INSPECTION SERVICES
15.28.1 COMPANY OVERVIEW
15.28.2 REVENUE ANALYSIS
15.28.3 GEOGRAPHIC PRESENCE
15.28.4 PRODUCT PORTFOLIO
15.28.5 RECENT DEVELOPMENTS
15.29 LMI TECHNOLOGIES INC.
15.29.1 COMPANY OVERVIEW
15.29.2 REVENUE ANALYSIS
15.29.3 GEOGRAPHIC PRESENCE
15.29.4 PRODUCT PORTFOLIO
15.29.5 RECENT DEVELOPMENTS
15.3 SIGRAY
15.30.1 COMPANY OVERVIEW
15.30.2 REVENUE ANALYSIS
15.30.3 GEOGRAPHIC PRESENCE
15.30.4 PRODUCT PORTFOLIO
15.30.5 RECENT DEVELOPMENTS
15.31 OMRON CORPORATION
15.31.1 COMPANY OVERVIEW
15.31.2 REVENUE ANALYSIS
15.31.3 GEOGRAPHIC PRESENCE
15.31.4 PRODUCT PORTFOLIO
15.31.5 RECENT DEVELOPMENTS
15.32 VJ GROUP, INC.
15.32.1 COMPANY OVERVIEW
15.32.2 REVENUE ANALYSIS
15.32.3 GEOGRAPHIC PRESENCE
15.32.4 PRODUCT PORTFOLIO
15.32.5 RECENT DEVELOPMENTS
15.33 SHIMADZU CORPORATION
15.33.1 COMPANY OVERVIEW
15.33.2 REVENUE ANALYSIS
15.33.3 GEOGRAPHIC PRESENCE
15.33.4 PRODUCT PORTFOLIO
15.33.5 RECENT DEVELOPMENTS
15.34 RIGAKU CORPORATION
15.34.1 COMPANY OVERVIEW
15.34.2 REVENUE ANALYSIS
15.34.3 GEOGRAPHIC PRESENCE
15.34.4 PRODUCT PORTFOLIO
15.34.5 RECENT DEVELOPMENTS
15.35 WERTH INC.
15.35.1 COMPANY OVERVIEW
15.35.2 REVENUE ANALYSIS
15.35.3 GEOGRAPHIC PRESENCE
15.35.4 PRODUCT PORTFOLIO
15.35.5 RECENT DEVELOPMENTS
16 CONCLUSION
17 QUESTIONNAIRE
18 ABOUT DATA BRIDGE MARKET RESEARCH
Data collection and base year analysis are done using data collection modules with large sample sizes. The stage includes obtaining market information or related data through various sources and strategies. It includes examining and planning all the data acquired from the past in advance. It likewise envelops the examination of information inconsistencies seen across different information sources. The market data is analysed and estimated using market statistical and coherent models. Also, market share analysis and key trend analysis are the major success factors in the market report. To know more, please request an analyst call or drop down your inquiry.
The key research methodology used by DBMR research team is data triangulation which involves data mining, analysis of the impact of data variables on the market and primary (industry expert) validation. Data models include Vendor Positioning Grid, Market Time Line Analysis, Market Overview and Guide, Company Positioning Grid, Patent Analysis, Pricing Analysis, Company Market Share Analysis, Standards of Measurement, Global versus Regional and Vendor Share Analysis. To know more about the research methodology, drop in an inquiry to speak to our industry experts.
Data Bridge Market Research is a leader in advanced formative research. We take pride in servicing our existing and new customers with data and analysis that match and suits their goal. The report can be customized to include price trend analysis of target brands understanding the market for additional countries (ask for the list of countries), clinical trial results data, literature review, refurbished market and product base analysis. Market analysis of target competitors can be analyzed from technology-based analysis to market portfolio strategies. We can add as many competitors that you require data about in the format and data style you are looking for. Our team of analysts can also provide you data in crude raw excel files pivot tables (Fact book) or can assist you in creating presentations from the data sets available in the report.


