
Global Near Infrared Nir Portable Spectrometer Market
Market Size in USD Million
 USD
195.43 Million
USD
481.61 Million
2022
2030
USD
195.43 Million
USD
481.61 Million
2022
2030
| 2023 - 2030 | |
| USD 195.43 Million | |
| USD 481.61 Million | |
| % | |
|
Near Infrared (NIR) Portable Spectrometer Market Analysis and Size
Near infrared spectroscopy is considered a crucial technique in the pharmaceutical industry for analysis of raw materials and quality control testing. These spectrometers are being highly used owing to the rise in prevalence of chronic diseases.
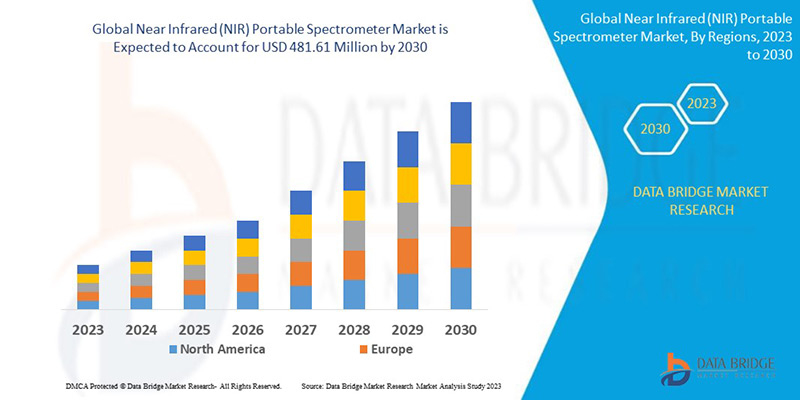
The near infrared (NIR) portable spectrometer market was valued at USD 195.43 million in 2022 and is expected to reach USD 481.61 million by 2030, registering a CAGR of 10.5% during the forecast period of 2023-2030. “Drug Discovery” is expected to witness high growth in the application segments owing to the increase in disease incidences. In addition to the insights on market scenarios such as market value, growth rate, segmentation, geographical coverage, and major players, the market reports curated by the Data Bridge Market Research also include in-depth expert analysis, geographically represented company-wise production and capacity, network layouts of distributors and partners, detailed and updated price trend analysis and deficit analysis of supply chain and demand.
Near Infrared (NIR) Portable Spectrometer Market Scope and Segmentation
|
Report Metric |
Details |
|
Forecast Period |
2023 to 2030 |
|
Base Year |
2022 |
|
Historic Years |
2021 (Customizable to 2015-2020) |
|
Quantitative Units |
Revenue in USD Million, Volumes in Units, Pricing in USD |
|
Segments Covered |
Application (Nanotechnology, Drug Discovery, Environmental Testing, Food and Agriculture, Life Sciences, Materials Chemistry, Forensic Science, Others), Spectrometer Type (Optical Spectrometer, Mass Spectrometer, Fluorescence Spectrometer, High-Resolution Spectrometer, Others), Technique (Atomic Spectroscopy, Mass Spectrometry, Molecular Spectroscopy, Fluorescence Spectroscopy) |
|
Countries Covered |
U.S., Canada, Mexico, Brazil, Argentina, Rest of South America, Germany, Italy, U.K., France, Spain, Netherlands, Belgium, Switzerland, Turkey, Russia, Rest of Europe, Japan, China, India, South Korea, Australia, Singapore, Malaysia, Thailand, Indonesia, Philippines, Rest of Asia-Pacific, Saudi Arabia, U.A.E., South Africa, Egypt, Israel, Rest of Middle East and Africa |
|
Market Players Covered |
Thermo Fisher Scientific Inc. (U.S.), Anton Paar GmbH (Austria), Bruker (US), PerkinElmer Inc. (U.S.), Hitachi High-Tech Corporation (Japan), ABB (Sweden), Agilent Technologies, Inc. (U.S.), JASCO. (Japan), Newport Corporation (U.S.), Oxford Instruments (U.K.), Shimadzu Scientific Instruments. (Japan), Rigaku Corporation (Japan), HORIBA Europe GmbH (Germany), Teledyne Princeton Instruments. (New Jersey), PerkinElmer Inc. (U.S.), StellarNet, Inc. (U.S.), and ZEISS International (Germany), among others |
|
Market Opportunities |
|
Market Definition
A near infrared (NIR) portable spectrometer is a handheld or compact device used for analyzing the near-infrared region of the electromagnetic spectrum. This analytical instrument is designed to measure the absorption, reflection, or transmission of light in the near-infrared range, typically spanning wavelengths from about 700 to 2500 nanometers (nm). NIR spectroscopy relies on the interaction between NIR light and matter, specifically the molecular vibrations and overtones of chemical bonds in various substances. By measuring how NIR light interacts with a sample, the portable spectrometer can provide valuable information about the composition, concentration, and properties of the materials being analyzed. This technique is widely used in various fields, including agriculture, food and beverage, pharmaceuticals, environmental monitoring, and others.
Global Near Infrared (NIR) Portable Spectrometer Market Dynamics
Drivers
- Penetration of Near Infrared (NIR) Portable Spectrometer
The increase in the penetration of near infrared (NIR) portable spectrometer into non-contact temperature measurement, astronomy, life sciences, and materials chemistry applications acts as one of the major factors driving the growth of near infrared (NIR) portable spectrometer market
- Demand from Various Industries
The increase in the number of applications from various industries for identifying material characteristics, measuring of emission, and absorbing of electromagnetic spectra accelerate the market growth. Additionally, rapid industrialization, surge in investments and development of manufacturing sectors positively affect the near infrared (NIR) portable spectrometer market
- Surge in Investments
The surge in the investment for research and development activities further influence the market. Also, adoption of food fingerprinting techniques has a positive impact on the market
Opportunities
- Adoption of Near Infrared Spectroscopy on Seed Quality Detection
Adoption of near infrared spectroscopy in seed quality detection extend profitable opportunities to the market players in the forecast period of 2023 to 2030. Also, development of advanced product for biological applications will further expand the market
Restraint/Challenge
- Technical Limitations
On the other hand, availability of used devices along with technical limitations are expected to obstruct market growth. Also, stringent regulations pertaining to import and export is projected to challenge the near infrared (NIR) portable spectrometer market in the forecast period of 2023-2030.
This near infrared (NIR) portable spectrometer market report provides details of new recent developments, trade regulations, import-export analysis, production analysis, value chain optimization, market share, impact of domestic and localized market players, analyses opportunities in terms of emerging revenue pockets, changes in market regulations, strategic market growth analysis, market size, category market growths, application niches and dominance, product approvals, product launches, geographic expansions, technological innovations in the market. To gain more info on near infrared (NIR) portable spectrometer market contact Data Bridge Market Research for an Analyst Brief, our team will help you take an informed market decision to achieve market growth.
Recent Developments
- On March 2022, A multi-year partnership agreement has been reached by KPM Analytics Inc. and AB Vista, the feed additives business of AB Agri Limited. The new licensing agreement increases the calibration development, customization, and support operations between the two businesses and solidifies the strategic partnership between KPM Analytics and AB Vista
- On March 2020, A mobile near-infrared (NIR) spectroscopy solution has been released, according to trinamiX GmbH (Ludwigshafen, Germany), a fully owned subsidiary of BASF SE. trinamiX's innovative Mobile Near Infrared (NIR) Spectroscopy Solutions assist in enhancing immediate decision-making
Global Near Infrared (NIR) Portable Spectrometer Market Scope
The global near infrared (NIR) portable spectrometer market is segmented on the basis of spectrometer type, application, and technique. The growth amongst these segments will help you analyse meagre growth segments in the industries and provide the users with a valuable market overview and market insights to help them make strategic decisions for identifying core market applications.
Spectrometer Type
- Optical Spectrometer
- Mass Spectrometer
- Fluorescence Spectrometer
- High-Resolution Spectrometer
- Others
Technique
- Atomic Spectroscopy
- Mass Spectrometry
- Molecular Spectroscopy
- Fluorescence Spectroscopy
Application
- Nanotechnology
- Drug Discovery
- Environmental Testing
- Food and Agriculture
- Life Sciences
- Materials Chemistry
- Forensic Science
- Others
Global Near Infrared (NIR) Portable Spectrometer Market Regional Analysis/Insights
The global near infrared (NIR) portable spectrometer market is analysed and market size insights and trends are provided by spectrometer type, application, and technique as referenced above.
The countries covered in the global near infrared (NIR) portable spectrometer market report are U.S., Canada, and Mexico in North America, Germany, France, U.K., Netherlands, Switzerland, Belgium, Russia, Italy, Spain, Turkey, Rest of Europe in Europe, China, Japan, India, South Korea, Singapore, Malaysia, Australia, Thailand, Indonesia, Philippines, Rest of Asia-Pacific (APAC) in the Asia-Pacific (APAC), Saudi Arabia, U.A.E., South Africa, Egypt, Israel, Rest of Middle East and Africa (MEA) as a part of the Middle East and Africa (MEA), Brazil, Argentina and Rest of South America as part of South America
North America dominates the near infrared (NIR) portable spectrometer market because of the increasing number of research and development activities within the region. Moreover, Asia-Pacific is expected to witness significant growth during the forecast period of 2023 to 2030 because of the growth of the pharmaceutical industry in India, China, and Japan
The country section of the report also provides individual market-impacting factors and changes in regulation in the market domestically that impact the current and future trends of the market. Data points such as down-stream and up-stream value chain analysis, technical trends, and Porter’s five forces analysis, case studies are some of the pointers used to forecast the market scenario for individual countries. Also, the presence and availability of Europe brands and the challenges faced due to large or scarce competition from local and domestic brands, the impact of domestic tariffs, and trade routes are considered while providing forecast analysis of the country data.
Competitive Landscape and Global Near Infrared (NIR) Portable Spectrometer Market Share Analysis
The global near infrared (NIR) portable spectrometer market competitive landscape provides details by competitors. Details included are company overview, company financials, revenue generated, market potential, investment in research and development, new market initiatives, Europe presence, production sites and facilities, production capacities, company strengths and weaknesses, product launch, product width and breadth, and application dominance. The above data points provided are only related to the company’s focus related to the global near infrared (NIR) portable spectrometer market.
Some of the major players operating in the global near infrared (NIR) portable spectrometer market are:
- Thermo Fisher Scientific Inc. (U.S.)
- Anton Paar GmbH (Austria)
- Bruker (U.S.)
- PerkinElmer Inc. (U.S.)
- Hitachi High-Tech Corporation (Japan)
- ABB (Sweden)
- Agilent Technologies, Inc. (U.S.)
- JASCO. (Japan)
- Newport Corporation (U.S.)
- Oxford Instruments (U.K.)
- Shimadzu Scientific Instruments. (Japan)
- Rigaku Corporation (Japan)
- HORIBA Europe GmbH (Germany)
- Teledyne Princeton Instruments. (New Jersey)
- PerkinElmer Inc. (U.S.)
- StellarNet, Inc. (U.S.)
- ZEISS International (Germany)
SKU-

- Interactive Data Analysis Dashboard
- Company Analysis Dashboard for high growth potential opportunities
- Research Analyst Access for customization & queries
- Competitor Analysis with Interactive dashboard
- Latest News, Updates & Trend analysis
- Harness the Power of Benchmark Analysis for Comprehensive Competitor Tracking
Table of Content
1 INTRODUCTION
1.1 OBJECTIVES OF THE STUDY
1.2 MARKET DEFINITION
1.3 OVERVIEW OF GLOBAL NEAR INFRARED (NIR) PORTABLE SPECTROMETER MARKET
1.4 CURRENCY AND PRICING
1.5 LIMITATION
1.6 MARKETS COVERED
2 MARKET SEGMENTATION
2.1 KEY TAKEAWAYS
2.2 ARRIVING AT THE GLOBAL NEAR INFRARED (NIR) PORTABLE SPECTROMETER MARKET
2.2.1 VENDOR POSITIONING GRID
2.2.2 TECHNOLOGY LIFE LINE CURVE
2.2.3 MARKET GUIDE
2.2.4 COMPANY POSITIONING GRID
2.2.5 COMAPANY MARKET SHARE ANALYSIS
2.2.6 MULTIVARIATE MODELLING
2.2.7 TOP TO BOTTOM ANALYSIS
2.2.8 STANDARDS OF MEASUREMENT
2.2.9 VENDOR SHARE ANALYSIS
2.2.10 DATA POINTS FROM KEY PRIMARY INTERVIEWS
2.2.11 DATA POINTS FROM KEY SECONDARY DATABASES
2.3 GLOBAL NEAR INFRARED (NIR) PORTABLE SPECTROMETER MARKET: RESEARCH SNAPSHOT
2.4 ASSUMPTIONS
3 MARKET OVERVIEW
3.1 DRIVERS
3.2 RESTRAINTS
3.3 OPPORTUNITIES
3.4 CHALLENGES
4 EXECUTIVE SUMMARY
5 PREMIUM INSIGHTS
5.1 PORTERS FIVE FORCES MODEL
5.2 REGULATORY STANDARDS
5.3 TECHNOLOGICAL TRENDS
5.4 CASE STUDY
5.5 PRICING ANALYSIS
6 GLOBAL NEAR INFRARED (NIR) PORTABLE SPECTROMETER MARKET, BY COMPONENT
6.1 OVERVIEW
6.2 HARDWARE
6.2.1 BY TYPE
6.2.1.1. BATTERY
6.2.1.2. LIGHT
6.2.1.3. CHIPS
6.2.1.4. SENSOR
6.2.1.5. ACCESSORIES
6.2.1.6. OTHERS
6.3 SOFTWARE
6.4 SERVICES
6.4.1 BY TYPE
6.4.1.1. CONSULTING
6.4.1.2. MAINTENANCE
7 GLOBAL NEAR INFRARED (NIR) PORTABLE SPECTROMETER MARKET, BY TYPE
7.1 OVERVIEW
7.2 ARRAY-DETECTOR
7.3 SINGLE-DETECTOR INSTRUMENTS
8 GLOBAL NEAR INFRARED (NIR) PORTABLE SPECTROMETER MARKET, BY TECHNOLOGY
8.1 OVERVIEW
8.2 DISPERSIVE INFRARED SPECTROMETER
8.3 FOURIER TRANSFORM INFRARED SPECTROMETER
9 GLOBAL NEAR INFRARED (NIR) PORTABLE SPECTROMETER MARKET, OPERATING MODEL
9.1 OVERVIEW
9.2 TABLET
9.3 PC
9.4 MOBILE
9.4.1 IOS
9.4.2 ANDROID
10 GLOBAL NEAR INFRARED (NIR) PORTABLE SPECTROMETER MARKET, BY CONNECTIVITY
10.1 OVERVIEW
10.2 BLUETOOTH
10.3 WI-FI
10.4 OTHERS
11 GLOBAL NEAR INFRARED (NIR) PORTABLE SPECTROMETER MARKET, BY SPECTRUM RANGE
11.1 OVERVIEW
11.2 900-1700 NM
11.3 900-2300NM
11.4 1500-2200 NM
11.5 1000-1700 NM
11.6 OTHERS
12 GLOBAL NEAR INFRARED (NIR) PORTABLE SPECTROMETER MARKET, BY DISTRIBUTION CHANNEL
12.1 OVERVIEW
12.2 ONLINE
12.2.1 BY TYPE
12.2.1.1. E-COMMERCE
12.2.1.2. COMPANY WEBSITE
12.3 OFFLINE
13 GLOBAL NEAR INFRARED (NIR) PORTABLE SPECTROMETER MARKET, BY END USER
13.1 OVERVIEW
13.2 HEALTHCARE & PHARMACEUTICALS
13.2.1 BY TYPE
13.2.1.1. ARRAY-DETECTOR
13.2.1.2. SINGLE-DETECTOR INSTRUMENTS
13.2.2 BY APPLICATION
13.2.2.1. DRUG MANUFACTURING
13.2.2.2. RAW MATERIALS ID
13.2.2.3. ADVANCED ID
13.2.2.4. COUNTERFEIT DRUG SCREENING
13.2.2.5. OTHERS
13.3 FOOD & BEVERAGES
13.3.1 BY TYPE
13.3.1.1. ARRAY-DETECTOR
13.3.1.2. SINGLE-DETECTOR INSTRUMENTS
13.3.2 BY APPLICATION
13.3.2.1. DIARY PRODUCTS
13.3.2.2. MEAT
13.3.2.3. SPICES
13.3.2.4. BAKED PRODUCT
13.3.2.5. SNACKS
13.3.2.6. ANIMAL FEED AND FORAGE
13.3.2.7. PET FOOD
13.3.2.8. BEVERAGES
13.3.2.8.1. ALCOHOLIC
13.3.2.8.2. NON-ALCOHOLIC
13.3.2.9. OTHER FOOD PRODUCTS
13.4 CHEMICAL AND POLYMERS
13.4.1 BY TYPE
13.4.1.1. ARRAY-DETECTOR
13.4.1.2. SINGLE-DETECTOR INSTRUMENTS
13.4.2 BY APPLICATION
13.4.2.1. HYDROXYL NUMBER
13.4.2.2. RAW MATERIALS PURITY & CONFIRMATION
13.4.2.3. RESIDUAL SOLVENTS ANALYSIS
13.4.2.4. ADDITIVES AND MONOMERS ANALYSIS
13.4.2.5. OTHERS
13.5 BIOLOGICAL RESEARCH
13.5.1 BY TYPE
13.5.1.1. ARRAY-DETECTOR
13.5.1.2. SINGLE-DETECTOR INSTRUMENTS
13.6 ENVIRONMENTAL
13.6.1 BY TYPE
13.6.1.1. ARRAY-DETECTOR
13.6.1.2. SINGLE-DETECTOR INSTRUMENTS
13.7 CONSUMER ELECTRONICS
13.7.1 BY TYPE
13.7.1.1. ARRAY-DETECTOR
13.7.1.2. SINGLE-DETECTOR INSTRUMENTS
13.8 AGRICULTURE
13.8.1 BY TYPE
13.8.1.1. ARRAY-DETECTOR
13.8.1.2. SINGLE-DETECTOR INSTRUMENTS
13.8.2 BY APPLICATION
13.8.2.1. NATURAL PRODUCTS
13.8.2.2. LIVESTOCK
13.8.2.3. GRAINS
13.8.2.4. FLOUR MILLING
13.8.2.5. BIOFUELS
13.8.2.6. CORN & OILSEED PROCESSING
13.8.2.7. OTHERS
13.9 TOBACCO
13.9.1 BY TYPE
13.9.1.1. ARRAY-DETECTOR
13.9.1.2. SINGLE-DETECTOR INSTRUMENTS
13.9.2 BY APPLICATION
13.9.2.1. WHOLE LEAF
13.9.2.2. CUT TOBACCO
13.9.2.3. RECONSTITUTED TOBACCO AND CHEWING TOBACCO
13.9.2.4. OTHERS
13.1 OTHERS
14 GLOBAL NEAR INFRARED (NIR) PORTABLE SPECTROMETER MARKET, BY REGION
14.1 GLOBAL NEAR INFRARED (NIR) PORTABLE SPECTROMETER MARKET SEGMENTATION PROVIDED ABOVE IS REPRESENTED IN THIS CHAPTER BY COUNTRY)
14.1.1 NORTH AMERICA
14.1.1.1. U.S.
14.1.1.2. CANADA
14.1.1.3. MEXICO
14.1.2 EUROPE
14.1.2.1. GERMANY
14.1.2.2. U.K.
14.1.2.3. FRANCE
14.1.2.4. ITALY
14.1.2.5. SPAIN
14.1.2.6. THE NETHERLANDS
14.1.2.7. SWITZERLAND
14.1.2.8. TURKEY
14.1.2.9. BELGIUM
14.1.2.10. RUSSIA
14.1.2.11. NORWAY
14.1.2.12. SWEDEN
14.1.2.13. DENMARK
14.1.2.14. POLAND
14.1.2.15. FINLAND
14.1.2.16. REST OF EUROPE
14.1.3 ASIA-PACIFIC
14.1.3.1. CHINA
14.1.3.2. JAPAN
14.1.3.3. SOUTH KOREA
14.1.3.4. INDIA
14.1.3.5. SINGAPORE
14.1.3.6. AUSTRALIA
14.1.3.7. NEW ZEALAND
14.1.3.8. MALAYSIA
14.1.3.9. PHILIPPINES
14.1.3.10. THAILAND
14.1.3.11. INDONESIA
14.1.3.12. TAIWAN
14.1.3.13. VIETNAM
14.1.3.14. REST OF ASIA-PACIFIC
14.1.4 SOUTH AMERICA
14.1.4.1. BRAZIL
14.1.4.2. ARGENTINA
14.1.4.3. REST OF SOUTH AMERICA
14.1.5 MIDDLE EAST AND AFRICA
14.1.5.1. SOUTH AFRICA
14.1.5.2. EGYPT
14.1.5.3. SAUDI ARABIA
14.1.5.4. U.A.E
14.1.5.5. ISRAEL
14.1.5.6. OMAN
14.1.5.7. BAHRAIN
14.1.5.8. KUWAIT
14.1.5.9. QATAR
14.1.5.10. REST OF MIDDLE EAST AND AFRICA
14.1.6 KEY PRIMARY INSIGHTS: BY MAJOR COUNTRIES
15 GLOBAL NEAR INFRARED (NIR) PORTABLE SPECTROMETER MARKET, COMPANY LANDSCAPE
15.1 COMPANY SHARE ANALYSIS: GLOBAL
15.2 COMPANY SHARE ANALYSIS: NORTH AMERICA
15.3 COMPANY SHARE ANALYSIS: EUROPE
15.4 COMPANY SHARE ANALYSIS: ASIA-PACIFIC
15.5 MERGERS & ACQUISITIONS
15.6 NEW PRODUCT DEVELOPMENT & APPROVALS
15.7 EXPANSIONS
15.8 REGULATORY CHANGES
15.9 PARTNERSHIP AND OTHER STRATEGIC DEVELOPMENTS
16 GLOBAL NEAR INFRARED (NIR) PORTABLE SPECTROMETER MARKET, SWOT AND DBMR ANALYSIS
17 GLOBAL NEAR INFRARED (NIR) PORTABLE SPECTROMETER MARKET, COMPANY PROFILE
17.1 BRUKER
17.1.1 COMPANY SNAPSHOT
17.1.2 REVENUE ANALYSIS
17.1.3 GEOGRAPHIC PRESENCE
17.1.4 PRODUCT PORTFOLIO
17.1.5 RECENT DEVELOPMENTS
17.2 SHIMADZU CORPORATION
17.2.1 COMPANY SNAPSHOT
17.2.2 REVENUE ANALYSIS
17.2.3 GEOGRAPHIC PRESENCE
17.2.4 PRODUCT PORTFOLIO
17.2.5 RECENT DEVELOPMENTS
17.3 AGILENT TECHNOLOGIES
17.3.1 COMPANY SNAPSHOT
17.3.2 REVENUE ANALYSIS
17.3.3 GEOGRAPHIC PRESENCE
17.3.4 PRODUCT PORTFOLIO
17.3.5 RECENT DEVELOPMENTS
17.4 PERKINELMER, INC.
17.4.1 COMPANY SNAPSHOT
17.4.2 REVENUE ANALYSIS
17.4.3 GEOGRAPHIC PRESENCE
17.4.4 PRODUCT PORTFOLIO
17.4.5 RECENT DEVELOPMENTS
17.5 HITACHI HIGH-TECHNOLOGIES CORPORATION
17.5.1 COMPANY SNAPSHOT
17.5.2 REVENUE ANALYSIS
17.5.3 GEOGRAPHIC PRESENCE
17.5.4 PRODUCT PORTFOLIO
17.5.5 RECENT DEVELOPMENTS
17.6 ZEISS
17.6.1 COMPANY SNAPSHOT
17.6.2 REVENUE ANALYSIS
17.6.3 GEOGRAPHIC PRESENCE
17.6.4 PRODUCT PORTFOLIO
17.6.5 RECENT DEVELOPMENTS
17.7 THERMO FISHER SCIENTIFIC
17.7.1 COMPANY SNAPSHOT
17.7.2 REVENUE ANALYSIS
17.7.3 GEOGRAPHIC PRESENCE
17.7.4 PRODUCT PORTFOLIO
17.7.5 RECENT DEVELOPMENTS
17.8 JASCO INC.
17.8.1 COMPANY SNAPSHOT
17.8.2 REVENUE ANALYSIS
17.8.3 GEOGRAPHIC PRESENCE
17.8.4 PRODUCT PORTFOLIO
17.8.5 RECENT DEVELOPMENTS
17.9 FOSS
17.9.1 COMPANY SNAPSHOT
17.9.2 REVENUE ANALYSIS
17.9.3 GEOGRAPHIC PRESENCE
17.9.4 PRODUCT PORTFOLIO
17.9.5 RECENT DEVELOPMENTS
17.1 ANALYTIK LTD.
17.10.1 COMPANY SNAPSHOT
17.10.2 REVENUE ANALYSIS
17.10.3 GEOGRAPHIC PRESENCE
17.10.4 PRODUCT PORTFOLIO
17.10.5 RECENT DEVELOPMENTS
17.11 ITPHOTONICS S.R.L.
17.11.1 COMPANY SNAPSHOT
17.11.2 REVENUE ANALYSIS
17.11.3 GEOGRAPHIC PRESENCE
17.11.4 PRODUCT PORTFOLIO
17.11.5 RECENT DEVELOPMENTS
17.12 GALAXY SCIENTIFIC
17.12.1 COMPANY SNAPSHOT
17.12.2 REVENUE ANALYSIS
17.12.3 GEOGRAPHIC PRESENCE
17.12.4 PRODUCT PORTFOLIO
17.12.5 RECENT DEVELOPMENTS
17.13 STELLARNET, INC.
17.13.1 COMPANY SNAPSHOT
17.13.2 REVENUE ANALYSIS
17.13.3 GEOGRAPHIC PRESENCE
17.13.4 PRODUCT PORTFOLIO
17.13.5 RECENT DEVELOPMENTS
17.14 TRINAMIX GMBH
17.14.1 COMPANY SNAPSHOT
17.14.2 REVENUE ANALYSIS
17.14.3 GEOGRAPHIC PRESENCE
17.14.4 PRODUCT PORTFOLIO
17.14.5 RECENT DEVELOPMENTS
17.15 TEXAS INSTRUMENTS INCORPORATED
17.15.1 COMPANY SNAPSHOT
17.15.2 REVENUE ANALYSIS
17.15.3 GEOGRAPHIC PRESENCE
17.15.4 PRODUCT PORTFOLIO
17.15.5 RECENT DEVELOPMENTS
17.16 MALVERN PANALYTICAL LTD
17.16.1 COMPANY SNAPSHOT
17.16.2 REVENUE ANALYSIS
17.16.3 GEOGRAPHIC PRESENCE
17.16.4 PRODUCT PORTFOLIO
17.16.5 RECENT DEVELOPMENTS
17.17 HORIBA
17.17.1 COMPANY SNAPSHOT
17.17.2 REVENUE ANALYSIS
17.17.3 GEOGRAPHIC PRESENCE
17.17.4 PRODUCT PORTFOLIO
17.17.5 RECENT DEVELOPMENTS
17.18 BUCHI
17.18.1 COMPANY SNAPSHOT
17.18.2 REVENUE ANALYSIS
17.18.3 GEOGRAPHIC PRESENCE
17.18.4 PRODUCT PORTFOLIO
17.18.5 RECENT DEVELOPMENTS
17.19 ASP LASER INC.
17.19.1 COMPANY SNAPSHOT
17.19.2 REVENUE ANALYSIS
17.19.3 GEOGRAPHIC PRESENCE
17.19.4 PRODUCT PORTFOLIO
17.19.5 RECENT DEVELOPMENTS
17.2 GOYALAB
17.20.1 COMPANY SNAPSHOT
17.20.2 REVENUE ANALYSIS
17.20.3 GEOGRAPHIC PRESENCE
17.20.4 PRODUCT PORTFOLIO
17.20.5 RECENT DEVELOPMENTS
17.21 NEWPORT CORPORATION
17.21.1 COMPANY SNAPSHOT
17.21.2 REVENUE ANALYSIS
17.21.3 GEOGRAPHIC PRESENCE
17.21.4 PRODUCT PORTFOLIO
17.21.5 RECENT DEVELOPMENTS
17.22 PERKINELMER INC.
17.22.1 COMPANY SNAPSHOT
17.22.2 REVENUE ANALYSIS
17.22.3 GEOGRAPHIC PRESENCE
17.22.4 PRODUCT PORTFOLIO
17.22.5 RECENT DEVELOPMENTS
NOTE: THE COMPANIES PROFILED IS NOT EXHAUSTIVE LIST AND IS AS PER OUR PREVIOUS CLIENT REQUIREMENT. WE PROFILE MORE THAN 100 COMPANIES IN OUR STUDY AND HENCE THE LIST OF COMPANIES CAN BE MODIFIED OR REPLACED ON REQUEST
18 CONCLUSION
19 QUESTIONNAIRE
20 RELATED REPORTS
21 ABOUT DATA BRIDGE MARKET RESEARCH
Global Near Infrared Nir Portable Spectrometer Market, Supply Chain Analysis and Ecosystem Framework
To support market growth and help clients navigate the impact of geopolitical shifts, DBMR has integrated in-depth supply chain analysis into its Global Near Infrared Nir Portable Spectrometer Market research reports. This addition empowers clients to respond effectively to global changes affecting their industries. The supply chain analysis section includes detailed insights such as Global Near Infrared Nir Portable Spectrometer Market consumption and production by country, price trend analysis, the impact of tariffs and geopolitical developments, and import and export trends by country and HSN code. It also highlights major suppliers with data on production capacity and company profiles, as well as key importers and exporters. In addition to research, DBMR offers specialized supply chain consulting services backed by over a decade of experience, providing solutions like supplier discovery, supplier risk assessment, price trend analysis, impact evaluation of inflation and trade route changes, and comprehensive market trend analysis.
Data collection and base year analysis are done using data collection modules with large sample sizes. The stage includes obtaining market information or related data through various sources and strategies. It includes examining and planning all the data acquired from the past in advance. It likewise envelops the examination of information inconsistencies seen across different information sources. The market data is analysed and estimated using market statistical and coherent models. Also, market share analysis and key trend analysis are the major success factors in the market report. To know more, please request an analyst call or drop down your inquiry.
The key research methodology used by DBMR research team is data triangulation which involves data mining, analysis of the impact of data variables on the market and primary (industry expert) validation. Data models include Vendor Positioning Grid, Market Time Line Analysis, Market Overview and Guide, Company Positioning Grid, Patent Analysis, Pricing Analysis, Company Market Share Analysis, Standards of Measurement, Global versus Regional and Vendor Share Analysis. To know more about the research methodology, drop in an inquiry to speak to our industry experts.
Data Bridge Market Research is a leader in advanced formative research. We take pride in servicing our existing and new customers with data and analysis that match and suits their goal. The report can be customized to include price trend analysis of target brands understanding the market for additional countries (ask for the list of countries), clinical trial results data, literature review, refurbished market and product base analysis. Market analysis of target competitors can be analyzed from technology-based analysis to market portfolio strategies. We can add as many competitors that you require data about in the format and data style you are looking for. Our team of analysts can also provide you data in crude raw excel files pivot tables (Fact book) or can assist you in creating presentations from the data sets available in the report.


