
Global Protective Barrier Enclosure Devices Market
Market Size in USD Billion
 USD
7.50 Billion
USD
12.79 Billion
2021
2029
USD
7.50 Billion
USD
12.79 Billion
2021
2029
| 2022 - 2029 | |
| USD 7.50 Billion | |
| USD 12.79 Billion | |
| % | |
|
Market Analysis and Size
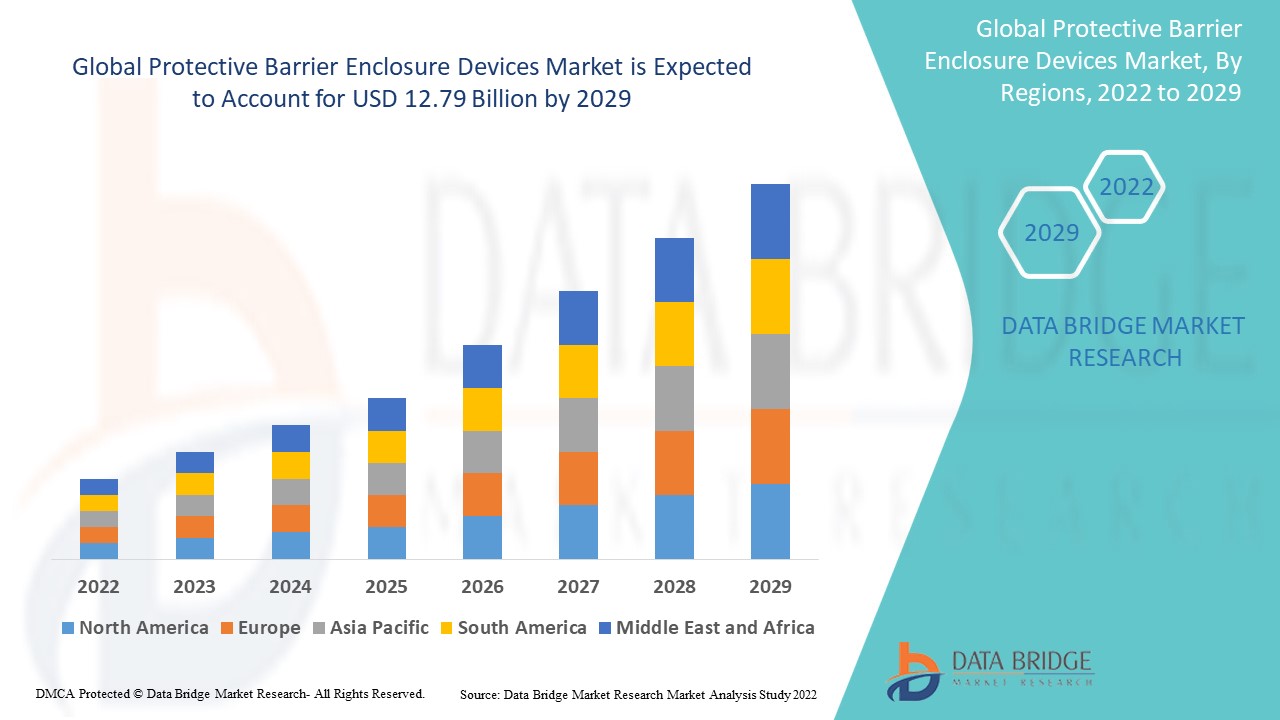
The global protective barrier enclosure devices market is expected to witness significant growth during the forecast period. These enclosure devices are used to increase the durability of medical devices that are used in implants, monitoring purposes and other therapeutic purposes. The growing requirement for workplace and employee protection as a result of increased power and industrial infrastructure is likely to boost the market during the forecast period.
Data Bridge Market Research analyses a growth rate in the global protective barrier enclosure devices market in the forecast period 2022-2029. The expected CAGR of global protective barrier enclosure devices market is tend to be around 6.90% in the mentioned forecast period. The market was valued at USD 7.50 billion in 2021, and it would grow upto USD 12.79 billion by 2029. In addition to the market insights such as market value, growth rate, market segments, geographical coverage, market players, and market scenario, the market report curated by the Data Bridge Market Research team also includes in-depth expert analysis, patient epidemiology, pipeline analysis, pricing analysis, and regulatory framework.
Market Definition
A passive protective barrier is a transparent device that covers the patient's head and torso, including one or more openings through which the healthcare professional’s hands pass to perform medical procedures, and has a fan, air filter, or similar function. It is considered to be a great boon to the global protective barrier enclosure devices market.
Report Scope and Market Segmentation
|
Report Metric |
Details |
|
Forecast Period |
2022 to 2029 |
|
Base Year |
2021 |
|
Historic Years |
2020 (Customizable to 2014 - 2019) |
|
Quantitative Units |
Revenue in USD Million, Volumes in Units, Pricing in USD |
|
Segments Covered |
Type (Metallic Enclosure, Non-metallic Enclosures), Mounting Type (wall-mounted enclosure, free-standing enclosure, underground electric enclosure), Application (Power Generation and Distribution, Oil & Gas, Metals & Mining, Medical, Pulp & Paper, Transportation , Food & Beverages) |
|
Countries Covered |
U.S., Canada and Mexico in North America, Germany, France, U.K., Netherlands, Switzerland, Belgium, Russia, Italy, Spain, Turkey, Rest of Europe in Europe, China, Japan, India, South Korea, Singapore, Malaysia, Australia, Thailand, Indonesia, Philippines, Rest of Asia-Pacific (APAC) in the Asia-Pacific (APAC), Saudi Arabia, U.A.E, South Africa, Egypt, Israel, Rest of Middle East and Africa (MEA) as a part of Middle East and Africa (MEA), Brazil, Argentina and Rest of South America as part of South America |
|
Market Players Covered |
Rittal (U.S.), Schneider (France), Pentair (U.S.), ABB (Switzerland), Hubbel (U.S.), Eaton (Ireland), Fibox Enclosures (India), GE (U.S.), Emerson (U.S.), Eldon (Spain), Nitto Kogyo (Japan), ENSTO (India), Siemens (Germany), Legrand (France), Adalet (Ohio), Allied Moulded Products (U.S.), BOXCO (U.S.), Bison ProFab (U.S.), SRBox (India), ITS Enclosures (U.S.) |
|
Market Opportunities |
|
Global Protective Barrier Enclosure Devices Market Dynamics
Drivers
- Need of Modernized Infrastructure
The growing need to modernise power infrastructure in growing countries and strict safety and process rules are expected to drive market growth over the forecast period.
- Mode of Feasibility
Simpler designs, such as a single monolithic enclosure of a particular size used as a stand-alone enclosure, are used in self-contained enclosures. Electrical cables and devices are protected from frost, corrosion and weather by underground enclosures.
Opportunities
- Rising Concerns from Hospitals
The rising concerns of clinics and hospitals in terms of hygiene, toughness, durability and several other protection-related factors create an opportunity to increase the market growth.
- Associated Beneficial Factors
Enclosures such as electrical enclosures are often needed in humid environments such as near ponds, lakes, and even underwater. Some of the industries in which they work are in very humid environments, such as factories that perform outdoor work that require adequate protection from snow and rain, or plants that use water treatment. In such cases, plastic is clearly superior to metal because it is waterproof and does not rust.
Restraints/Challenges
- Lack of skilled professionals
The lack of qualified personnel who are unable to use these devices could curb the growth of the global protective barrier enclosure devices market over a forecast period.
- High Cost
High cost of these devices can hinder the growth of the global medical imaging displays and post processing software market.
This global protective barrier enclosure devices market report provides details of new recent developments, trade regulations, import-export analysis, production analysis, value chain optimization, market share, impact of domestic and localized market players, analyses opportunities in terms of emerging revenue pockets, changes in market regulations, strategic market growth analysis, market size, category market growths, application niches and dominance, product approvals, product launches, geographic expansions, technological innovations in the market. To gain more info on the global protective barrier enclosure devices market contact Data Bridge Market Research for an Analyst Brief, our team will help you take an informed market decision to achieve market growth.
COVID-19 Impact on Global Protective Barrier Enclosure Devices Market
Considering the present scenario, COVID-19 has left an unprecedented global public health crisis that has impacted practically every business, and its long-term repercussions are expected to have an influence on industry growth during the forecast period.
As a result of COVID 19, many sectors have been severely affected. The disruption in transportation and supply chain operations has also had a profound impact on the electrical enclosure industry. Not only that the market saw a decline in sales due to its loss.
Global Protective Barrier Enclosure Devices Market Scope
The global protective barrier enclosure devices market is segmented on the basis of type, mounting type and application. The growth amongst these segments will help you analyze meagre growth segments in the industries and provide the users with a valuable market overview and market insights to help them make strategic decisions for identifying core market applications.
Type
- Metallic Enclosure
- Aluminum enclosures
- Aluminum enclosures
- Mild steel enclosures
- Non-metallic Enclosures
- Fiberglass enclosures
- PVC enclosures
- Polyester enclosures
- Polycarbonate enclosures
Mounting Type
- Wall-mounted enclosure
- Free-standing enclosure
- Underground electric enclosure
Application
- Power Generation and Distribution
- Oil & Gas
- Metals & Mining
- Medical
- Pulp & Paper
- Transportation
- Food & Beverages
Protective Barrier Enclosure Devices Market Regional Analysis/Insights
The global protective barrier enclosure devices market is analysed and market size insights and trends are provided by type, mounting type and application as referenced above.
The major countries covered in the global protective barrier enclosure devices market are the U.S., Canada and Mexico in North America, Germany, France, U.K., Netherlands, Switzerland, Belgium, Russia, Italy, Spain, Turkey, Rest of Europe in Europe, China, Japan, India, South Korea, Singapore, Malaysia, Australia, Thailand, Indonesia, Philippines, Rest of Asia-Pacific (APAC) in the Asia-Pacific (APAC), Saudi Arabia, U.A.E, South Africa, Egypt, Israel, Rest of Middle East and Africa (MEA) as a part of Middle East and Africa (MEA), Brazil, Argentina and Rest of South America as part of South America.
North America is the dominating region in the global protective barrier enclosure devices market due to increasing healthcare issues and continuously rising population.
Meanwhile, the Asia-Pacific region has shown significant growth in the global protective barrier enclosure devices market due to the strict rules and regulations during the manufacturing of these devices.
The country section of the report also provides individual market impacting factors and changes in regulation in the market domestically that impacts the current and future trends of the market. Also, the presence and availability of global brands and their challenges faced due to large or scarce competition from local and domestic brands, impact of domestic tariffs and trade routes are considered while providing forecast analysis of the country data.
Competitive Landscape and Global Protective Barrier Enclosure Devices Market Share Analysis
The global protective barrier enclosure devices market competitive landscape provides details by competitor. Details included are company overview, company financials, revenue generated, market potential, investment in research and development, new market initiatives, global presence, production sites and facilities, production capacities, company strengths and weaknesses, product launch, product width and breadth, application dominance. The above data points provided are only related to the companies' focus related to protective barrier enclosure devices market.
Key players operating in the global protective barrier enclosure devices market include:
- Rittal (U.S.)
- Schneider (France)
- Pentair (U.S.)
- ABB (Switzerland)
- Hubbel (U.S.)
- Eaton (Ireland)
- Fibox Enclosures (India)
- General Electric Company (U.S.)
- Emerson (U.S.)
- Eldon (Spain)
- Nitto Kogyo (Japan)
- ENSTO (India)
- Siemens (Germany)
- Legrand (France)
- Adalet (Ohio)
- Allied Moulded Products (U.S.)
- BOXCO (U.S.)
- Bison ProFab (U.S.)
- SRBox (India)
- ITS Enclosures (U.S.)
SKU-

- Interactive Data Analysis Dashboard
- Company Analysis Dashboard for high growth potential opportunities
- Research Analyst Access for customization & queries
- Competitor Analysis with Interactive dashboard
- Latest News, Updates & Trend analysis
- Harness the Power of Benchmark Analysis for Comprehensive Competitor Tracking
Table of Content
1. INTRODUCTION
1.1 OBJECTIVES OF THE STUDY
1.2 MARKET DEFINITION
1.3 OVERVIEW OF GLOBAL PROTECTIVE BARRIER ENCLOSURE DEVICES MARKET
1.4 CURRENCY AND PRICING
1.5 LIMITATION
1.6 MARKETS COVERED
2. MARKET SEGMENTATION
2.1 KEY TAKEAWAYS
2.2 ARRIVING AT THE GLOBAL PROTECTIVE BARRIER ENCLOSURE DEVICES MARKET SIZE
2.2.1 VENDOR POSITIONING GRID
2.2.2 TECHNOLOGY LIFE LINE CURVE
2.2.3 TRIPOD DATA VALIDATION MODEL
2.2.4 MARKET GUIDE
2.2.5 MULTIVARIATE MODELLING
2.2.6 TOP TO BOTTOM ANALYSIS
2.2.7 CHALLENGE MATRIX
2.2.8 APPLICATION COVERAGE GRID
2.2.9 STANDARDS OF MEASUREMENT
2.2.10 VENDOR SHARE ANALYSIS
2.2.11 DATA POINTS FROM KEY PRIMARY INTERVIEWS
2.2.12 DATA POINTS FROM KEY SECONDARY DATABASES
2.3 GLOBAL PROTECTIVE BARRIER ENCLOSURE DEVICES MARKET: RESEARCH SNAPSHOT
2.4 ASSUMPTIONS
3. MARKET OVERVIEW
3.1 DRIVERS
3.2 RESTRAINTS
3.3 OPPORTUNITIES
3.4 CHALLENGES
4. EXECUTIVE SUMMARY
5. REGULATORY SCENARIO
6. PREMIUM INSIGHTS
6.1 PESTLE ANALYSIS
6.2 PORTER’S FIVE FORCES
6.3 PRICING ASSESSMENT
6.4 PROTECTIVE BARRIER ENCLOSURE DEVICES, BY RATINGS
6.4.1 NEMA ENCLOSURES
6.4.2 IP ENCLOSURES
6.4.3 ATEX / IECEX CERTIFIED ENCLOSURES
6.4.4 UL LISTED ENCLOSURES
7. INDUSTRY INSIGHTS
8. GLOBAL PROTECTIVE BARRIER ENCLOSURE DEVICES MARKET, BY PRODUCT TYPE
8.1 OVERVIEW
8.2 PROTECTIVE BARRIER ENCLOSURE DEVICES
8.2.1 BY TYPE
8.2.1.1. PANEL ENCLOSURE
8.2.1.1.1. MARKET VALUE (USD MILLION)
8.2.1.1.2. MARKET VOLUME (UNITS)
8.2.1.1.3. AVERAGE SELLING PRICE (USD)
8.2.1.2. DUSTPROOF/WATERPROOF ENCLOSURE
8.2.1.2.1. MARKET VALUE (USD MILLION)
8.2.1.2.2. MARKET VOLUME (UNITS)
8.2.1.2.3. AVERAGE SELLING PRICE (USD)
8.2.1.3. CONTROL ENCLOSURE
8.2.1.3.1. MARKET VALUE (USD MILLION)
8.2.1.3.2. MARKET VOLUME (UNITS)
8.2.1.3.3. AVERAGE SELLING PRICE (USD)
8.2.1.4. THERMAL MANAGEMENT ENCLOSURE
8.2.1.4.1. MARKET VALUE (USD MILLION)
8.2.1.4.2. MARKET VOLUME (UNITS)
8.2.1.4.3. AVERAGE SELLING PRICE (USD)
8.2.1.5. INFORMATION COMMUNICATION ENCLOSURE
8.2.1.5.1. MARKET VALUE (USD MILLION)
8.2.1.5.2. MARKET VOLUME (UNITS)
8.2.1.5.3. AVERAGE SELLING PRICE (USD)
8.2.1.6. INSTRUMENT PANEL ENCLOSURE
8.2.1.6.1. MARKET VALUE (USD MILLION)
8.2.1.6.2. MARKET VOLUME (UNITS)
8.2.1.6.3. AVERAGE SELLING PRICE (USD)
8.2.1.7. STORAGE ENCLOSURE
8.2.1.7.1. MARKET VALUE (USD MILLION)
8.2.1.7.2. MARKET VOLUME (UNITS)
8.2.1.7.3. AVERAGE SELLING PRICE (USD)
8.2.1.8. CUSTOM ENCLOSURE
8.2.1.8.1. MARKET VALUE (USD MILLION)
8.2.1.8.2. MARKET VOLUME (UNITS)
8.2.1.8.3. AVERAGE SELLING PRICE (USD)
8.2.1.9. OTHERS
8.2.2 BY MATERIAL
8.2.2.1. METALLIC ENCLOSURE
8.2.2.1.1. ALUMINUM ENCLOSURES
8.2.2.1.2. ALUMINUM ENCLOSURES
8.2.2.1.3. MILD STEEL ENCLOSURES
8.2.2.1.4. STAINLESS STEEL ENCLOSURES
8.2.2.1.5. OTHERS
8.2.2.2. NON-METALLIC ENCLOSURES
8.2.2.2.1. FIBERGLASS ENCLOSURES
8.2.2.2.2. PVC ENCLOSURES
8.2.2.2.3. POLYESTER ENCLOSURES
8.2.2.2.4. POLYCARBONATE ENCLOSURES
8.2.2.2.5. OTHERS
8.3 PROTECTIVE BARRIER ENCLOSURE ACCESSORIES
8.3.1 BY TYPE
8.3.1.1. POWER DISTRIBUTION
8.3.1.1.1. MARKET VALUE (USD MILLION)
8.3.1.1.2. MARKET VOLUME (UNITS)
8.3.1.1.3. AVERAGE SELLING PRICE (USD)
8.3.1.2. CABLE MANAGEMENT
8.3.1.2.1. MARKET VALUE (USD MILLION)
8.3.1.2.2. MARKET VOLUME (UNITS)
8.3.1.2.3. AVERAGE SELLING PRICE (USD)
8.3.1.3. DOOR ACCESSORIES
8.3.1.3.1. MARKET VALUE (USD MILLION)
8.3.1.3.2. MARKET VOLUME (UNITS)
8.3.1.3.3. AVERAGE SELLING PRICE (USD)
8.3.1.4. COMPLEMENT ACCESSORIES
8.3.1.4.1. MARKET VALUE (USD MILLION)
8.3.1.4.2. MARKET VOLUME (UNITS)
8.3.1.4.3. AVERAGE SELLING PRICE (USD)
8.3.1.5. OTHERS
8.3.2 BY MATERIAL
8.3.2.1. STAINLESS STEEL
8.3.2.2. CARBON STEEL
8.3.2.3. OTHERS
9. GLOBAL PROTECTIVE BARRIER ENCLOSURE DEVICES MARKET, BY MOUNTING TYPE
9.1 OVERVIEW
9.2 WALL-MOUNTED ENCLOSURE
9.3 POLE / TOWER-MOUNTED ENCLOSURE
9.4 PAD-MOUNTED ENCLOSURE
9.5 WALK-IN ENCLOSURE
9.6 FREE-STANDING ENCLOSURE
9.7 UNDERGROUND ELECTRIC ENCLOSURE
9.8 OTHERS
10. GLOBAL PROTECTIVE BARRIER ENCLOSURE DEVICES MARKET, BY APPLICATION
10.1 OVERVIEW
10.2 POWER GENERATION AND DISTRIBUTION
10.2.1 PROTECTIVE BARRIER ENCLOSURE DEVICES
10.2.2 PROTECTIVE BARRIER ENCLOSURE ACCESSORIES
10.3 OIL & GAS
10.3.1 PROTECTIVE BARRIER ENCLOSURE DEVICES
10.3.2 PROTECTIVE BARRIER ENCLOSURE ACCESSORIES
10.4 METALS & MINING
10.4.1 PROTECTIVE BARRIER ENCLOSURE DEVICES
10.4.2 PROTECTIVE BARRIER ENCLOSURE ACCESSORIES
10.5 TELECOMMUNITCATION
10.5.1 PROTECTIVE BARRIER ENCLOSURE DEVICES
10.5.2 PROTECTIVE BARRIER ENCLOSURE ACCESSORIES
10.6 SOLAR POWER
10.6.1 PROTECTIVE BARRIER ENCLOSURE DEVICES
10.6.2 PROTECTIVE BARRIER ENCLOSURE ACCESSORIES
10.7 RAIL INDUSTRY
10.7.1 PROTECTIVE BARRIER ENCLOSURE DEVICES
10.7.2 PROTECTIVE BARRIER ENCLOSURE ACCESSORIES
10.8 CABLE/WIRE MANAGEMENT
10.8.1 PROTECTIVE BARRIER ENCLOSURE DEVICES
10.8.2 PROTECTIVE BARRIER ENCLOSURE ACCESSORIES
10.9 MEDICAL
10.9.1 PROTECTIVE BARRIER ENCLOSURE DEVICES
10.9.2 PROTECTIVE BARRIER ENCLOSURE ACCESSORIES
10.10 PULP & PAPER
10.10.1 PROTECTIVE BARRIER ENCLOSURE DEVICES
10.10.2 PROTECTIVE BARRIER ENCLOSURE ACCESSORIES
10.11 TRANSPORTATION
10.11.1 PROTECTIVE BARRIER ENCLOSURE DEVICES
10.11.2 PROTECTIVE BARRIER ENCLOSURE ACCESSORIES
10.12 FOOD & BEVERAGES
10.12.1 PROTECTIVE BARRIER ENCLOSURE DEVICES
10.12.2 PROTECTIVE BARRIER ENCLOSURE ACCESSORIES
10.13 OTHERS
11. GLOBAL PROTECTIVE BARRIER ENCLOSURE DEVICES MARKET, BY DISTRIBUTION CHANNEL
11.1 OVERVIEW
11.2 DIRECT TENDER
11.3 RETAIL SALES
11.4 OTHERS
12. GLOBAL PROTECTIVE BARRIER ENCLOSURE DEVICES MARKET, BY REGION
12.1 GLOBAL PROTECTIVE BARRIER ENCLOSURE DEVICES MARKET, (ALL SEGMENTATION PROVIDED ABOVE IS REPRESENTED IN THIS CHAPTER BY COUNTRY)
12.1.1 NORTH AMERICA
12.1.1.1. U.S.
12.1.1.1.1. PROTECTIVE BARRIER ENCLOSURE DEVICES MARKET, BY PRODUCT TYPE
12.1.1.1.2. PROTECTIVE BARRIER ENCLOSURE DEVICES MARKET, BY MOUNTING TYPE
12.1.1.1.3. PROTECTIVE BARRIER ENCLOSURE DEVICES MARKET, BY APPLICATION
12.1.1.1.4. PROTECTIVE BARRIER ENCLOSURE DEVICES MARKET, BY DISTRIBUTION CHANNEL
12.1.1.2. CANADA
12.1.1.3. MEXICO
12.1.2 EUROPE
12.1.2.1. GERMANY
12.1.2.2. FRANCE
12.1.2.3. U.K.
12.1.2.4. ITALY
12.1.2.5. SPAIN
12.1.2.6. RUSSIA
12.1.2.7. TURKEY
12.1.2.8. BELGIUM
12.1.2.9. NETHERLANDS
12.1.2.10. SWITZERLAND
12.1.2.11. REST OF EUROPE
12.1.3 ASIA-PACIFIC
12.1.3.1. JAPAN
12.1.3.2. CHINA
12.1.3.3. SOUTH KOREA
12.1.3.4. INDIA
12.1.3.5. AUSTRALIA
12.1.3.6. SINGAPORE
12.1.3.7. THAILAND
12.1.3.8. MALAYSIA
12.1.3.9. INDONESIA
12.1.3.10. PHILIPPINES
12.1.3.11. REST OF ASIA-PACIFIC
12.1.4 SOUTH AMERICA
12.1.4.1. BRAZIL
12.1.4.2. ARGENTINA
12.1.4.3. REST OF SOUTH AMERICA
12.1.5 MIDDLE EAST AND AFRICA
12.1.5.1. SOUTH AFRICA
12.1.5.2. SAUDI ARABIA
12.1.5.3. UAE
12.1.5.4. EGYPT
12.1.5.5. ISRAEL
12.1.5.6. REST OF MIDDLE EAST AND AFRICA
12.2 KEY PRIMARY INSIGHTS: BY MAJOR COUNTRIES
13. GLOBAL PROTECTIVE BARRIER ENCLOSURE DEVICES MARKET, SWOT AND DBMR ANALYSIS
14. GLOBAL PROTECTIVE BARRIER ENCLOSURE DEVICES MARKET, COMPANY LANDSCAPE
14.1 COMPANY SHARE ANALYSIS: GLOBAL
14.2 COMPANY SHARE ANALYSIS: NORTH AMERICA
14.3 COMPANY SHARE ANALYSIS: EUROPE
14.4 COMPANY SHARE ANALYSIS: ASIA-PACIFIC
14.5 MERGERS & ACQUISITIONS
14.6 NEW PRODUCT DEVELOPMENT & APPROVALS
14.7 EXPANSIONS
14.8 REGULATORY CHANGES
14.9 PARTNERSHIP AND OTHER STRATEGIC DEVELOPMENTS
15. GLOBAL PROTECTIVE BARRIER ENCLOSURE DEVICES MARKET, COMPANY PROFILE
15.1 RITTAL GMBH & CO. KG
15.1.1 COMPANY OVERVIEW
15.1.2 REVENUE ANALYSIS
15.1.3 GEOGRAPHIC PRESENCE
15.1.4 PRODUCT PORTFOLIO
15.1.5 RECENT DEVELOPEMENTS
15.2 SCHNEIDER ELECTRIC
15.2.1 COMPANY OVERVIEW
15.2.2 REVENUE ANALYSIS
15.2.3 GEOGRAPHIC PRESENCE
15.2.4 PRODUCT PORTFOLIO
15.2.5 RECENT DEVELOPEMENTS
15.3 PENTAIR
15.3.1 COMPANY OVERVIEW
15.3.2 REVENUE ANALYSIS
15.3.3 GEOGRAPHIC PRESENCE
15.3.4 PRODUCT PORTFOLIO
15.3.5 RECENT DEVELOPEMENTS
15.4 ABB
15.4.1 COMPANY OVERVIEW
15.4.2 REVENUE ANALYSIS
15.4.3 GEOGRAPHIC PRESENCE
15.4.4 PRODUCT PORTFOLIO
15.4.5 RECENT DEVELOPEMENTS
15.5 HUBBELL
15.5.1 COMPANY OVERVIEW
15.5.2 REVENUE ANALYSIS
15.5.3 GEOGRAPHIC PRESENCE
15.5.4 PRODUCT PORTFOLIO
15.5.5 RECENT DEVELOPEMENTS
15.6 EATON
15.6.1 COMPANY OVERVIEW
15.6.2 REVENUE ANALYSIS
15.6.3 GEOGRAPHIC PRESENCE
15.6.4 PRODUCT PORTFOLIO
15.6.5 RECENT DEVELOPEMENTS
15.7 FIBOX GROUP
15.7.1 COMPANY OVERVIEW
15.7.2 REVENUE ANALYSIS
15.7.3 GEOGRAPHIC PRESENCE
15.7.4 PRODUCT PORTFOLIO
15.7.5 RECENT DEVELOPEMENTS
15.8 GENERAL ELECTRIC COMPANY
15.8.1 COMPANY OVERVIEW
15.8.2 REVENUE ANALYSIS
15.8.3 GEOGRAPHIC PRESENCE
15.8.4 PRODUCT PORTFOLIO
15.8.5 RECENT DEVELOPEMENTS
15.9 EMERSON ELECTRIC CO.
15.9.1 COMPANY OVERVIEW
15.9.2 REVENUE ANALYSIS
15.9.3 GEOGRAPHIC PRESENCE
15.9.4 PRODUCT PORTFOLIO
15.9.5 RECENT DEVELOPEMENTS
15.10 NVENT
15.10.1 COMPANY OVERVIEW
15.10.2 REVENUE ANALYSIS
15.10.3 GEOGRAPHIC PRESENCE
15.10.4 PRODUCT PORTFOLIO
15.10.5 RECENT DEVELOPEMENTS
15.11 NITTO KOGYO CORPORATION
15.11.1 COMPANY OVERVIEW
15.11.2 REVENUE ANALYSIS
15.11.3 GEOGRAPHIC PRESENCE
15.11.4 PRODUCT PORTFOLIO
15.11.5 RECENT DEVELOPEMENTS
15.12 ENSTO
15.12.1 COMPANY OVERVIEW
15.12.2 REVENUE ANALYSIS
15.12.3 GEOGRAPHIC PRESENCE
15.12.4 PRODUCT PORTFOLIO
15.12.5 RECENT DEVELOPEMENTS
15.13 SIEMENS
15.13.1 COMPANY OVERVIEW
15.13.2 REVENUE ANALYSIS
15.13.3 GEOGRAPHIC PRESENCE
15.13.4 PRODUCT PORTFOLIO
15.13.5 RECENT DEVELOPEMENTS
15.14 LEGRAND
15.14.1 COMPANY OVERVIEW
15.14.2 REVENUE ANALYSIS
15.14.3 GEOGRAPHIC PRESENCE
15.14.4 PRODUCT PORTFOLIO
15.14.5 RECENT DEVELOPEMENTS
15.15 ADALET
15.15.1 COMPANY OVERVIEW
15.15.2 REVENUE ANALYSIS
15.15.3 GEOGRAPHIC PRESENCE
15.15.4 PRODUCT PORTFOLIO
15.15.5 RECENT DEVELOPEMENTS
15.16 ALLIED MOULDED PRODUCT TYPE (U.S.)
15.16.1 COMPANY OVERVIEW
15.16.2 REVENUE ANALYSIS
15.16.3 GEOGRAPHIC PRESENCE
15.16.4 PRODUCT PORTFOLIO
15.16.5 RECENT DEVELOPEMENTS
15.17 BOXCO
15.17.1 COMPANY OVERVIEW
15.17.2 REVENUE ANALYSIS
15.17.3 GEOGRAPHIC PRESENCE
15.17.4 PRODUCT PORTFOLIO
15.17.5 RECENT DEVELOPEMENTS
15.18 BISON PROFAB
15.18.1 COMPANY OVERVIEW
15.18.2 REVENUE ANALYSIS
15.18.3 GEOGRAPHIC PRESENCE
15.18.4 PRODUCT PORTFOLIO
15.18.5 RECENT DEVELOPEMENTS
15.19 ITS ENCLOSURES
15.19.1 COMPANY OVERVIEW
15.19.2 REVENUE ANALYSIS
15.19.3 GEOGRAPHIC PRESENCE
15.19.4 PRODUCT PORTFOLIO
15.19.5 RECENT DEVELOPEMENTS
15.20 THERMAL EDGE INC.
15.20.1 COMPANY OVERVIEW
15.20.2 REVENUE ANALYSIS
15.20.3 GEOGRAPHIC PRESENCE
15.20.4 PRODUCT PORTFOLIO
15.20.5 RECENT DEVELOPEMENTS
15.21 SIMSCALE
15.21.1 COMPANY OVERVIEW
15.21.2 REVENUE ANALYSIS
15.21.3 GEOGRAPHIC PRESENCE
15.21.4 PRODUCT PORTFOLIO
15.21.5 RECENT DEVELOPEMENTS
15.22 FANDIS S.P.A.
15.22.1 COMPANY OVERVIEW
15.22.2 REVENUE ANALYSIS
15.22.3 GEOGRAPHIC PRESENCE
15.22.4 PRODUCT PORTFOLIO
15.22.5 RECENT DEVELOPEMENTS
15.23 INTEGRA ENGINEERING INDIA LIMITED
15.23.1 COMPANY OVERVIEW
15.23.2 REVENUE ANALYSIS
15.23.3 GEOGRAPHIC PRESENCE
15.23.4 PRODUCT PORTFOLIO
15.23.5 RECENT DEVELOPEMENTS
15.24 GANGA METCO
15.24.1 COMPANY OVERVIEW
15.24.2 REVENUE ANALYSIS
15.24.3 GEOGRAPHIC PRESENCE
15.24.4 PRODUCT PORTFOLIO
15.24.5 RECENT DEVELOPEMENTS
15.25 JAY ENGINEERS
15.25.1 COMPANY OVERVIEW
15.25.2 REVENUE ANALYSIS
15.25.3 GEOGRAPHIC PRESENCE
15.25.4 PRODUCT PORTFOLIO
15.25.5 RECENT DEVELOPEMENTS
15.26 ROLEC GEHÄUSE-SYSTEME GMBH
15.26.1 COMPANY OVERVIEW
15.26.2 REVENUE ANALYSIS
15.26.3 GEOGRAPHIC PRESENCE
15.26.4 PRODUCT PORTFOLIO
15.26.5 RECENT DEVELOPEMENTS
15.27 GEORG SCHLEGEL GMBH & CO. KG
15.27.1 COMPANY OVERVIEW
15.27.2 REVENUE ANALYSIS
15.27.3 GEOGRAPHIC PRESENCE
15.27.4 PRODUCT PORTFOLIO
15.27.5 RECENT DEVELOPEMENTS
15.28 OKW GEHÄUSESYSTEME
15.28.1 COMPANY OVERVIEW
15.28.2 REVENUE ANALYSIS
15.28.3 GEOGRAPHIC PRESENCE
15.28.4 PRODUCT PORTFOLIO
15.28.5 RECENT DEVELOPEMENTS
15.29 ROSE SYSTEMTECHNIK GMBH
15.29.1 COMPANY OVERVIEW
15.29.2 REVENUE ANALYSIS
15.29.3 GEOGRAPHIC PRESENCE
15.29.4 PRODUCT PORTFOLIO
15.29.5 RECENT DEVELOPEMENTS
*NOTE: THE COMPANIES PROFILED IS NOT EXHAUSTIVE LIST AND IS AS PER OUR PREVIOUS CLIENT REQUIREMENT. WE PROFILE MORE THAN 100 COMPANIES IN OUR STUDY AND HENCE THE LIST OF COMPANIES CAN BE MODIFIED OR REPLACED ON REQUEST RELATED REPORTS
16. RELATED REPORTS
17. QUESTIONNAIRE
18. ABOUT DATA BRIDGE MARKET RESEARCH
Data collection and base year analysis are done using data collection modules with large sample sizes. The stage includes obtaining market information or related data through various sources and strategies. It includes examining and planning all the data acquired from the past in advance. It likewise envelops the examination of information inconsistencies seen across different information sources. The market data is analysed and estimated using market statistical and coherent models. Also, market share analysis and key trend analysis are the major success factors in the market report. To know more, please request an analyst call or drop down your inquiry.
The key research methodology used by DBMR research team is data triangulation which involves data mining, analysis of the impact of data variables on the market and primary (industry expert) validation. Data models include Vendor Positioning Grid, Market Time Line Analysis, Market Overview and Guide, Company Positioning Grid, Patent Analysis, Pricing Analysis, Company Market Share Analysis, Standards of Measurement, Global versus Regional and Vendor Share Analysis. To know more about the research methodology, drop in an inquiry to speak to our industry experts.
Data Bridge Market Research is a leader in advanced formative research. We take pride in servicing our existing and new customers with data and analysis that match and suits their goal. The report can be customized to include price trend analysis of target brands understanding the market for additional countries (ask for the list of countries), clinical trial results data, literature review, refurbished market and product base analysis. Market analysis of target competitors can be analyzed from technology-based analysis to market portfolio strategies. We can add as many competitors that you require data about in the format and data style you are looking for. Our team of analysts can also provide you data in crude raw excel files pivot tables (Fact book) or can assist you in creating presentations from the data sets available in the report.


