
Global Sports Apparel Market
Market Size in USD Billion
 USD
213.31 Billion
USD
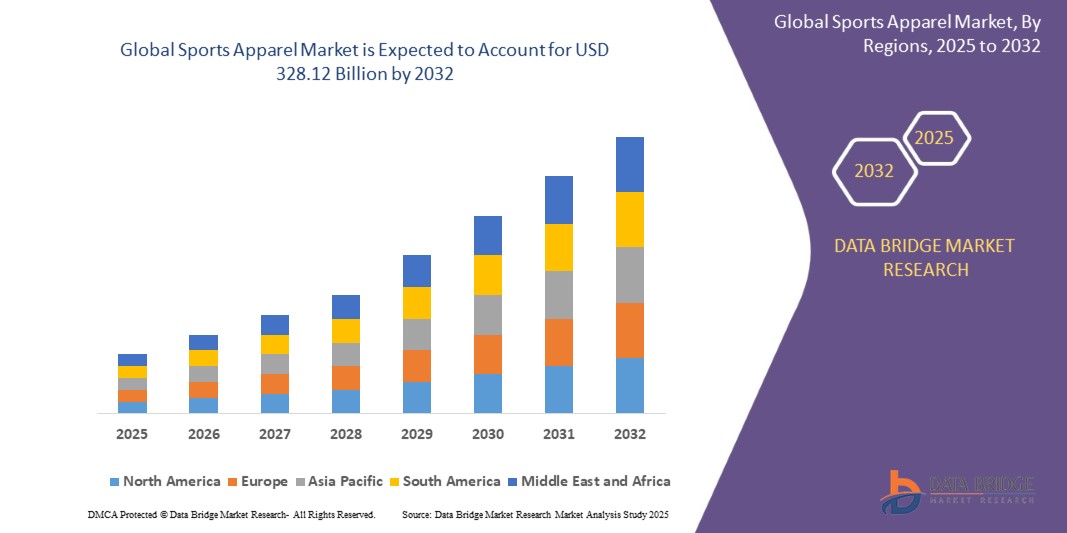
328.12 Billion
2024
2032
USD
213.31 Billion
USD
328.12 Billion
2024
2032
| 2025 - 2032 | |
| USD 213.31 Billion | |
| USD 328.12 Billion | |
| % | |
|
Sports Apparel Market Size
- The global sports apparel market size was valued at USD 213.31 billion in 2024 and is expected to reach USD 328.12 billion by 2032, at a CAGR of 5.53% during the forecast period
- The market growth is largely fuelled by the rising health awareness among consumers, increased participation in fitness and recreational activities, and the growing influence of athleisure fashion across all age groups
- The surge in demand for comfortable, functional, and aesthetically appealing athletic wear is further supported by influencer marketing, celebrity endorsements, and fitness-oriented social media trends
Sports Apparel Market Analysis
- The market is witnessing rapid transformation due to the merging of fashion and functionality, with consumers seeking performance-driven yet stylish clothing for both athletic and casual wear
- Increasing female participation in sports and fitness programs is creating new demand across product categories such as leggings, sports bras, and activewear sets
- North America dominated the sports apparel market with the largest revenue share in 2024, driven by strong consumer inclination toward fitness, increased participation in sports activities, and the rise of athleisure as everyday wear
- Europe region is expected to witness the highest growth rate in the global sports apparel market, driven by a surge in urban fitness trends, expanding digital retail channels, and consumer preference for eco-friendly, versatile clothing that supports both active lifestyles and fashion-forward choices
- The soccer segment dominated the market with the largest revenue share in 2024, driven by the global popularity of the sport, increasing participation across all age groups, and the high demand for team jerseys, shorts, and training kits. Soccer apparel benefits from major international events such as the FIFA World Cup and regional leagues, which consistently drive brand visibility and consumer engagement. The segment also thrives due to strong endorsements from top athletes and clubs
Report Scope and Sports Apparel Market Segmentation
|
Attributes |
Sports Apparel Key Market Insights |
|
Segments Covered |
|
|
Countries Covered |
North America
Europe
Asia-Pacific
Middle East and Africa
South America
|
|
Key Market Players |
|
|
Market Opportunities |
|
|
Value Added Data Infosets |
In addition to the insights on market scenarios such as market value, growth rate, segmentation, geographical coverage, and major players, the market reports curated by the Data Bridge Market Research also include in-depth expert analysis, pricing analysis, brand share analysis, consumer survey, demography analysis, supply chain analysis, value chain analysis, raw material/consumables overview, vendor selection criteria, PESTLE Analysis, Porter Analysis, and regulatory framework. |
Sports Apparel Market Trends
“Rise of Smart Sportswear and Performance-Enhancing Technology”
- Consumers are increasingly adopting smart sportswear that tracks physical metrics such as heart rate, steps, and calories burned
- Sensor-embedded fabrics are gaining popularity for offering real-time feedback on muscle movement and posture during workouts
- Brands are integrating wearable technology into activewear to improve performance and provide recovery insights
- Tech-focused consumers are drawn to garments that connect with smartphones and fitness apps for personalized health data
- For instance, Under Armour’s smart apparel line, which includes biometric shirts that sync with the UA Record app, has gained widespread adoption among athletes and gym users
Sports Apparel Market Dynamics
Driver
“Growing Health Awareness and Fitness-Oriented Lifestyle Adoption”
- Increasing health awareness is encouraging people across all age groups to engage in regular fitness activities and adopt athletic wear
- Consumers prefer sports apparel that is both performance-oriented and stylish enough for everyday use, leading to the rise of athleisure
- Health-focused campaigns and government wellness programs are boosting demand for comfortable and functional activewear
- Influencer-driven fitness trends on platforms such as Instagram and YouTube are shaping consumer preferences and boosting product visibility
- For instance, Nike reported a surge in global activewear sales in 2024, largely attributed to its expanding yoga and running gear collections catering to health-conscious millennials
Restraint/Challenge
“Rising Production Costs and Counterfeit Product Penetration”
- Fluctuating prices of raw materials such as polyester, spandex, and organic cotton are increasing manufacturing costs for sportswear brands
- Compliance with environmental regulations and demand for sustainable materials are pushing up the cost of production
- Counterfeit sports apparel is flooding the market, affecting the sales and reputation of leading brands
- Online marketplaces with weak quality checks are contributing to the proliferation of fake products that mimic original designs
- For instance, Adidas faced significant revenue losses in 2023 across Southeast Asia due to an influx of counterfeit activewear on third-party e-commerce platforms
Sports Apparel Market Scope
The market is segmented on the basis of sport, material, type of print, distribution channel, and end user.
• By Sport
On the basis of sport, the sports apparel market is segmented into soccer, basketball, baseball, and others. The soccer segment dominated the market with the largest revenue share in 2024, driven by the global popularity of the sport, increasing participation across all age groups, and the high demand for team jerseys, shorts, and training kits. Soccer apparel benefits from major international events such as the FIFA World Cup and regional leagues, which consistently drive brand visibility and consumer engagement. The segment also thrives due to strong endorsements from top athletes and clubs.
The basketball segment is expected to witness the fastest growth rate from 2025 to 2032, fuelled by its rising global influence and growing youth interest. Basketball-inspired fashion trends, combined with demand for breathable and stylish jerseys and shorts, are boosting segment growth. Collaborations between sportswear brands and basketball players also contribute to expanding consumer reach and brand loyalty.
• By Material
On the basis of material, the sports apparel market is segmented into natural and synthetic. The synthetic segment held the largest market revenue share in 2024, supported by the widespread use of polyester and elastane fabrics that offer superior flexibility, moisture-wicking properties, and durability during athletic performance. The affordability and adaptability of synthetic materials for high-performance gear make them the preferred choice for both athletes and casual users.
The natural segment is expected to witness the fastest growth rate from 2025 to 2032, driven by increasing consumer preference for eco-friendly and sustainable products. Materials such as organic cotton and bamboo blends are gaining attention for their softness, breathability, and biodegradability, particularly among environmentally conscious consumers.
• By Type of Print
On the basis of type of print, the market is segmented into water based, silicone emboss, reflective transfer, pigment, high density, foil, glitter, cracking ink, discharge, all over print, photo print, and others. The pigment print segment held the largest revenue share in 2024 due to its versatility, affordability, and wide application across t-shirts, hoodies, and team apparel. It is widely preferred for creating bold and durable designs on both cotton and synthetic fabrics.
The reflective transfer segment is expected to witness the fastest growth rate from 2025 to 2032, owing to increasing consumer demand for safety and visibility in activewear, especially in outdoor or nighttime activities. Reflective prints are gaining popularity in running gear, cycling apparel, and gym wear, contributing to their rapid market adoption.
• By Distribution Channel
On the basis of distribution channel, the sports apparel market is segmented into e-commerce, supermarket/hypermarket, brand outlets, discount stores, and others. The e-commerce segment captured the largest revenue share in 2024, supported by the convenience of online shopping, wide product availability, and rising mobile commerce. Consumers increasingly prefer digital platforms for accessing the latest collections, personalized deals, and hassle-free returns.
The brand outlets segment is expected to witness the fastest growth rate from 2025 to 2032, driven by the in-store experience, exclusive collections, and loyalty programs offered by global sportswear brands. These physical outlets allow customers to try products, receive expert assistance, and engage with the brand more deeply, enhancing consumer retention.
• By End User
On the basis of end user, the market is segmented into men, women, and children. The men segment dominated the market in 2024 with the highest revenue share, primarily due to strong demand for gym wear, running apparel, and sport-specific clothing. The category benefits from a broad product range and frequent new launches by key brands targeting male fitness enthusiasts and athletes.
The women segment is expected to witness the fastest growth rate from 2025 to 2032
, driven by increasing female participation in sports and fitness activities such as yoga, pilates, and running. Stylish, high-performance apparel that caters to comfort and body movement is expanding the female consumer base, making this a dynamic growth area in the industry.
Sports Apparel Market Regional Analysis
- North America dominated the sports apparel market with the largest revenue share in 2024, driven by strong consumer inclination toward fitness, increased participation in sports activities, and the rise of athleisure as everyday wear
- Consumers in the region favor sports apparel that blends performance with style, fueling demand for innovative, breathable, and moisture-wicking fabrics that support both workouts and casual wear
- This growth is further propelled by the presence of major brands, high disposable incomes, and the influence of sports celebrities and social media fitness trends, positioning sports apparel as a mainstream fashion category
U.S. Sports Apparel Market Insight
The U.S. sports apparel market captured the largest revenue share in North America in 2024, supported by a growing fitness culture and strong demand for athleisure wear across all age groups. Consumers in the U.S. are increasingly investing in performance-oriented and fashion-forward athletic wear that suits both gym use and daily routines. The country’s robust e-commerce infrastructure, coupled with widespread promotional campaigns by leading brands, continues to boost market visibility. Collaborations between sportswear companies and athletes, influencers, and designers further fuel brand engagement and consumer loyalty.
Europe Sports Apparel Market Insight
The Europe sports apparel market is expected to witness the fastest growth rate from 2025 to 2032, driven by heightened awareness of health and wellness and increasing participation in sports and recreational activities. European consumers prioritize quality, functionality, and sustainable production, prompting brands to introduce eco-conscious apparel collections. Rising interest in outdoor fitness and yoga, along with growing fashion consciousness, is also influencing product design. Both established and emerging sportswear brands are expanding their presence in the region through retail and online channels.
U.K. Sports Apparel Market Insight
The U.K. sports apparel market is expected to witness the fastest growth rate from 2025 to 2032, fueled by the rising popularity of gym culture, fitness boot camps, and home workout programs. British consumers are embracing sports apparel as a part of their everyday wardrobe, with a strong preference for trend-driven, comfortable, and functional clothing. Sustainability and ethical sourcing are also gaining traction among U.K. buyers, prompting brands to adapt accordingly. The influence of fashion-forward athletes and fitness influencers further drives market expansion.
Germany Sports Apparel Market Insight
The Germany sports apparel market is expected to witness the fastest growth rate from 2025 to 2032, supported by a growing base of health-conscious consumers and a well-established sports culture. German consumers value innovation, technical quality, and durability in athletic wear, contributing to sustained demand for performance-oriented fabrics and ergonomic designs. The country’s strong retail infrastructure and digital commerce landscape support both domestic and international brands in gaining market share. In addition, the emphasis on eco-friendly and functional products aligns with evolving consumer preferences.
Asia-Pacific Sports Apparel Market Insight
The Asia-Pacific sports apparel market is expected to witness the fastest growth rate from 2025 to 2032, driven by increasing urbanization, fitness awareness, and a rising middle-class population in countries such as China, India, and Japan. The market is experiencing a rapid shift toward active lifestyles, further supported by government-led health initiatives and fitness campaigns. Additionally, the booming e-commerce sector and growing influence of Western fashion trends are enhancing the visibility and adoption of sportswear across the region.
Japan Sports Apparel Market Insight
The Japan sports apparel market is expected to witness the fastest growth rate from 2025 to 2032, as consumers embrace health-oriented lifestyles and multifunctional clothing. Fitness activities such as running, yoga, and cycling are becoming more popular, and the demand for lightweight, high-tech apparel is rising. Japanese consumers show a strong preference for products that combine aesthetics with innovation. The market is also witnessing increased interest in eco-conscious materials and minimalist designs. Major brands are responding by tailoring offerings to match the unique cultural and functional expectations of Japanese buyers.
China Sports Apparel Market Insight
The China sports apparel market held the largest revenue share in Asia Pacific in 2024, driven by the country’s expanding fitness culture, young population, and growing sports participation. Rapid urbanization and the popularity of athleisure have made sportswear a fashion staple among millennials and Gen Z consumers. The proliferation of local and international brands, coupled with extensive online retail networks, supports continuous market expansion. In addition, China’s government support for national fitness programs and its hosting of major sporting events further stimulate apparel demand across diverse user groups.
Sports Apparel Market Share
The Sports Apparel industry is primarily led by well-established companies, including:
- V.F. Corporation (U.S.)
- Columbia Sportswear Company (U.S.)
- Adidas (Germany)
- Amer Sports (Finland)
- DESCENTE LTD (Japan)
- Decathlon Sports India Pvt Ltd (India)
- Lafuma (France)
- Group Rossignol Inc. (U.S.)
- Volcom, LLC. (U.S.)
- Spyder (U.S.)
- Halti Global Store. (Finland)
- Under Armour Inc, (U.S.)
- BOGNER (U.S.)
- Trek Kit India (India)
- Tube Pro, Inc (Canada)
- Airhead (U.S.)
- L.L. Bean(U.S.)
- Agit Global, Inc. (U.S.)
- Emsco Group (U.S.)
- SLIPPERY RACER (U.S.)
- Gizmo Riders by Plastkon (U.S.)
- Zipfy Inc. (Canada)
SKU-

- Interactive Data Analysis Dashboard
- Company Analysis Dashboard for high growth potential opportunities
- Research Analyst Access for customization & queries
- Competitor Analysis with Interactive dashboard
- Latest News, Updates & Trend analysis
- Harness the Power of Benchmark Analysis for Comprehensive Competitor Tracking
Data collection and base year analysis are done using data collection modules with large sample sizes. The stage includes obtaining market information or related data through various sources and strategies. It includes examining and planning all the data acquired from the past in advance. It likewise envelops the examination of information inconsistencies seen across different information sources. The market data is analysed and estimated using market statistical and coherent models. Also, market share analysis and key trend analysis are the major success factors in the market report. To know more, please request an analyst call or drop down your inquiry.
The key research methodology used by DBMR research team is data triangulation which involves data mining, analysis of the impact of data variables on the market and primary (industry expert) validation. Data models include Vendor Positioning Grid, Market Time Line Analysis, Market Overview and Guide, Company Positioning Grid, Patent Analysis, Pricing Analysis, Company Market Share Analysis, Standards of Measurement, Global versus Regional and Vendor Share Analysis. To know more about the research methodology, drop in an inquiry to speak to our industry experts.
Data Bridge Market Research is a leader in advanced formative research. We take pride in servicing our existing and new customers with data and analysis that match and suits their goal. The report can be customized to include price trend analysis of target brands understanding the market for additional countries (ask for the list of countries), clinical trial results data, literature review, refurbished market and product base analysis. Market analysis of target competitors can be analyzed from technology-based analysis to market portfolio strategies. We can add as many competitors that you require data about in the format and data style you are looking for. Our team of analysts can also provide you data in crude raw excel files pivot tables (Fact book) or can assist you in creating presentations from the data sets available in the report.


