
Middle East And Africa Digital Therapeutics Market
Market Size in USD Billion
 USD
5.66 Billion
USD
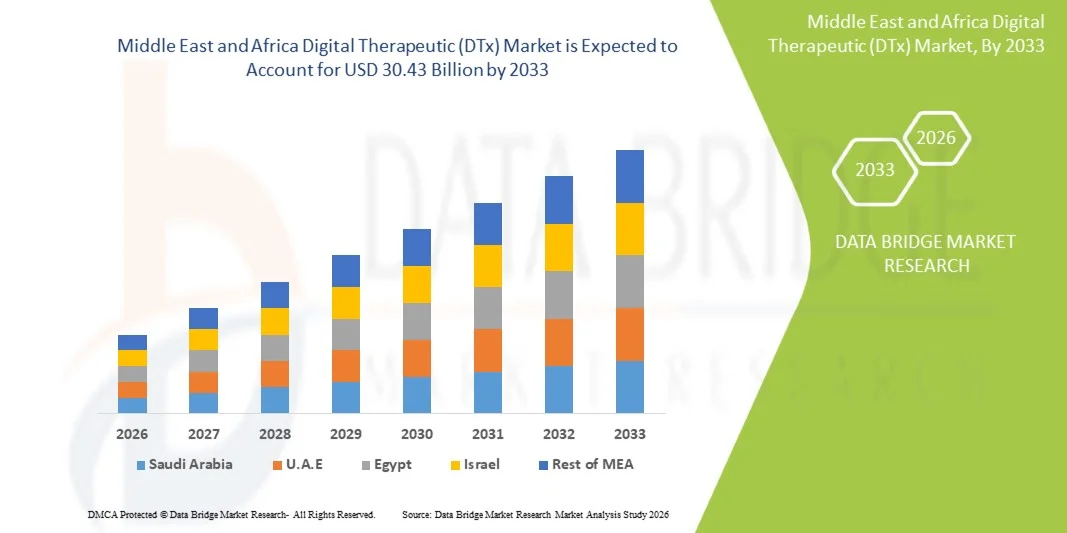
30.43 Billion
2025
2033
USD
5.66 Billion
USD
30.43 Billion
2025
2033
| 2026 - 2033 | |
| USD 5.66 Billion | |
| USD 30.43 Billion | |
| % | |
|
Middle East and Africa Digital Therapeutic (DTx) Market Size
- The Middle East and Africa Digital Therapeutic (DTx) market size was valued at USD 5.66 billion in 2025 and is expected to reach USD 30.43 billion by 2033, at a CAGR of 23.4% during the forecast period
- The market growth is largely fueled by the ongoing digital transformation in healthcare across the region, with increased adoption of mobile‑ and cloud‑based therapies, government‑backed digital health initiatives, and rising prevalence of chronic diseases driving demand for evidence‑based digital therapeutic solutions
- Furthermore, growing consumer and provider demand for scalable, patient‑centric, and cost‑effective therapeutic tools–from chronic condition management to mental health interventions is positioning DTx as an integrated component of modern healthcare delivery. These converging factors are accelerating adoption of digital therapeutic platforms, thereby significantly boosting the industry’s growth
Middle East and Africa Digital Therapeutic (DTx) Market Analysis
- Digital therapeutics (DTx), providing evidence-based software-driven interventions to prevent, manage, or treat medical conditions, are increasingly becoming essential components of modern healthcare delivery across both patient self-management and clinical care settings due to their accessibility, personalized care capabilities, and seamless integration with broader digital health ecosystems
- The escalating demand for DTx is primarily fueled by increasing smartphone and internet penetration, growing prevalence of chronic diseases, heightened focus on mental health, and supportive government initiatives promoting digital health solutions across the Middle East and Africa
- Saudi Arabia dominated the Middle East and Africa DTx market with a combined revenue share of 35.2% in 2025, characterized by high digital literacy, advanced healthcare infrastructure, and rising healthcare expenditure, with significant growth in treatment/care-related applications for chronic disease management and mental health interventions
- South Africa is expected to be the fastest-growing country in the Middle East and Africa Digital Therapeutic (DTx) market during the forecast period due to expanding digital infrastructure, increasing telemedicine adoption, and growing awareness of preventive applications
- Solutions/software segment dominated the Middle East and Africa Digital Therapeutic (DTx) market with a market share of 52.9% in 2025, driven by scalability, ease of deployment, and integration with existing healthcare services
Report Scope and Middle East and Africa Digital Therapeutic (DTx) Market Segmentation
|
Attributes |
Middle East and Africa Digital Therapeutic (DTx) Key Market Insights |
|
Segments Covered |
|
|
Countries Covered |
Middle East and Africa
|
|
Key Market Players |
|
|
Market Opportunities |
|
|
Value Added Data Infosets |
In addition to the insights on market scenarios such as market value, growth rate, segmentation, geographical coverage, and major players, the market reports curated by the Data Bridge Market Research also include in-depth expert analysis, patient epidemiology, pipeline analysis, pricing analysis, and regulatory framework |
Middle East and Africa Digital Therapeutic (DTx) Market Trends
“Personalized AI-Driven Digital Therapeutics”
- A significant and accelerating trend in the Middle East and Africa DTx market is the integration of artificial intelligence (AI) for personalized interventions, allowing therapies to adapt to individual patient behaviors and treatment responses
- For instance, Kaia Health’s AI-enabled musculoskeletal therapy platform adjusts exercise intensity based on user progress and adherence, providing a tailored care experience
- AI in DTx enables predictive analytics for chronic disease management, suggesting optimized intervention plans and generating intelligent health alerts based on patient activity patterns, improving clinical outcomes
- Integration with mobile and wearable devices facilitates continuous monitoring and real-time feedback, allowing patients and healthcare providers to track progress and make data-driven treatment adjustments
- Growing adoption of gamification features in DTx applications enhances patient engagement and adherence, encouraging consistent participation in therapy programs
- This trend towards more personalized, adaptive, and technology-driven therapeutic solutions is transforming patient expectations for digital healthcare, with companies such as Omada Health developing AI-powered programs for diabetes and mental health management
- The demand for AI-enabled, personalized digital therapeutics is growing rapidly across both preventive and treatment applications, as healthcare providers and patients increasingly prioritize scalable, evidence-based, and data-driven interventions
Middle East and Africa Digital Therapeutic (DTx) Market Dynamics
Driver
“Rising Chronic Disease Burden and Digital Health Adoption”
- The increasing prevalence of chronic diseases such as diabetes, cardiovascular disorders, and mental health conditions, combined with the accelerating adoption of digital health solutions, is a significant driver for DTx demand
- For instance, in March 2025, Happify Health partnered with UAE hospitals to deploy mental health-focused DTx programs, expanding access to digital behavioral therapy solutions
- As patients seek convenient, continuous, and personalized care outside traditional clinical settings, DTx offers mobile, evidence-based interventions, enhancing adherence and treatment effectiveness
- Government initiatives supporting digital health infrastructure, telemedicine, and reimbursement models in countries such as Saudi Arabia and UAE are further facilitating DTx adoption
- The convenience of mobile delivery, real-time monitoring, and integration with existing healthcare systems are key factors propelling DTx uptake, while rising patient awareness and provider endorsement amplify adoption rates
- Increasing partnerships between DTx providers and insurance companies create reimbursement opportunities, encouraging broader adoption among cost-conscious patients
- Rising investment in digital health startups across the Middle East and Africa is fostering innovation in DTx, introducing new therapy types and expanding market penetration
Restraint/Challenge
“Data Privacy Concerns and Regulatory Barriers”
- Concerns regarding patient data security and privacy in connected digital therapeutic platforms pose a significant challenge to market expansion across the region
- For instance, reports of potential vulnerabilities in mobile health applications have made some patients and providers cautious about using DTx solutions for sensitive medical data
- Addressing these concerns requires robust encryption, secure authentication protocols, and compliance with healthcare data regulations to build trust and ensure safe adoption
- In addition, inconsistent regulatory frameworks and limited reimbursement policies for DTx in certain Middle East and Africa countries can hinder broader deployment and investment in digital therapeutics
- Overcoming these challenges through strong cybersecurity measures, regulatory harmonization, and patient education will be crucial for sustained growth and wider adoption of DTx platforms
- Limited digital literacy in some regions restricts patient engagement and adherence to DTx programs, especially among older populations unfamiliar with mobile applications
- High initial development and implementation costs for advanced AI-enabled DTx platforms may slow adoption among smaller healthcare providers and startups in developing markets
Middle East and Africa Digital Therapeutic (DTx) Market Scope
The market is segmented on the basis of product and service type, application, purchase mode, and sales channel.
- By Product and Service Type
On the basis of product and service type, the DTx market is segmented into hardware products, solutions/software, and service. The Solutions/Software segment dominated the market with a largest revenue share of 52.9% in 2025, driven by its scalability and ability to deliver personalized, evidence-based therapeutic interventions to large patient populations. Solutions/software platforms allow healthcare providers to monitor patient progress remotely, provide adaptive treatment plans, and integrate with wearable devices and mobile applications for continuous health tracking. The segment’s dominance is also supported by the growing preference for mobile and cloud-based interventions, which reduce the need for physical infrastructure. In addition, software solutions are increasingly adopted in both preventive and treatment/care-related applications, allowing healthcare systems in Saudi Arabia, UAE, and South Africa to expand their digital health portfolios efficiently. Providers also value these solutions for their ability to generate analytics and insights to optimize clinical outcomes.
The Hardware Products segment is expected to witness the fastest growth at a CAGR of 19.5% from 2026 to 2033, driven by the adoption of wearable devices, smart monitoring sensors, and connected medical equipment that enhance patient engagement. Hardware products such as smart patches, wearable glucose monitors, or connected ECG devices enable real-time monitoring, improving adherence to therapeutic regimens. The increasing integration of these devices with software platforms provides a seamless experience for patients and clinicians, fueling adoption across both chronic disease and preventive care applications. Furthermore, rising investment in IoT-enabled healthcare devices in the UAE, Saudi Arabia, and South Africa contributes to the rapid expansion of this segment.
- By Application
On the basis of application, the market is segmented into treatment/care-related applications and preventive applications. The Treatment/Care-Related Applications segment dominated the market with a share of 61% in 2025, owing to the growing burden of chronic diseases such as diabetes, cardiovascular conditions, and mental health disorders in the Middle East and Africa. DTx solutions in this segment provide structured, evidence-based programs that supplement traditional therapy, improve medication adherence, and enable clinicians to remotely track patient progress. The dominance of this segment is supported by the increasing focus of healthcare providers and insurers on reducing hospitalization and improving long-term health outcomes. Solutions/software targeting treatment applications also allow for integration with telemedicine platforms, enhancing the continuity of care for patients with complex health conditions.
The Preventive Applications segment is expected to witness the fastest growth at a CAGR of 21.3% from 2026 to 2033, driven by rising awareness of lifestyle-related health risks and government-led preventive healthcare initiatives. Digital interventions for preventive care include wellness programs, behavioral therapy apps, and early screening platforms that empower individuals to manage risk factors before disease onset. Adoption is fueled by smartphone penetration, wearable device usage, and the growing demand for self-managed, proactive healthcare solutions. Countries such as UAE and South Africa are seeing increasing deployment of preventive-focused DTx programs in corporate wellness and community health initiatives.
- By Purchase Mode
On the basis of purchase mode, the market is segmented into Group Purchase Organization and Individual. The Individual purchase mode dominated the market with 67% share in 2025, driven by the rising adoption of mobile-based therapeutic apps directly by patients seeking convenient, personalized healthcare solutions. Individual purchases are preferred for mental health and chronic disease management applications, where patients value flexible access to therapy and real-time tracking of progress. The growing digital literacy and smartphone penetration in countries such as Saudi Arabia and UAE further support the dominance of this segment.
The Group Purchase Organization segment is expected to witness the fastest growth at a CAGR of 22.1% from 2026 to 2033, fueled by hospitals, clinics, and insurance providers adopting DTx platforms for large patient populations. These organizations seek scalable solutions that reduce treatment costs, improve patient adherence, and integrate with hospital management systems. The rise of corporate wellness programs and government-backed digital health initiatives across the region also drives bulk adoption in this segment.
- By Sales Channel
On the basis of sales channel, the market is segmented into B2B and B2C. The B2B segment dominated the market with a 61% share in 2025, as hospitals, clinics, and insurers increasingly procure DTx solutions for large patient cohorts. B2B adoption is supported by the integration of DTx platforms with telemedicine services, remote monitoring infrastructure, and hospital electronic health records. Providers benefit from analytics, reporting, and compliance features that help streamline patient care and improve outcomes. Countries such as UAE, Saudi Arabia, and South Africa are witnessing strong B2B uptake due to increasing investments in digital health infrastructure.
The B2C segment is expected to witness the fastest growth at a CAGR of 23.4% from 2026 to 2033, driven by the rising awareness and adoption of self-managed digital therapeutics via mobile apps and wearable devices. Consumers increasingly seek preventive and treatment solutions for mental health, fitness, and chronic disease management directly, bypassing traditional healthcare intermediaries. Smartphone penetration, digital literacy, and the popularity of health and wellness apps in the Middle East and Africa contribute to the rapid expansion of the B2C segment.
Middle East and Africa Digital Therapeutic (DTx) Market Regional Analysis
- Saudi Arabia dominated the Middle East and Africa DTx market with a combined revenue share of 35.2% in 2025, characterized by high digital literacy, advanced healthcare infrastructure, and rising healthcare expenditure, with significant growth in treatment/care-related applications for chronic disease management and mental health interventions
- Patients and healthcare providers in these countries highly value the accessibility, personalized interventions, and real-time monitoring offered by DTx solutions, which enhance treatment adherence and outcomes across chronic disease management and mental health programs
- This widespread adoption is further supported by high smartphone penetration, advanced digital infrastructure, and the integration of DTx platforms with telemedicine and hospital management systems, establishing digital therapeutics as a preferred solution for both individual patients and healthcare institutions
The Saudi Arabia Digital Therapeutic Market Insight
The Saudi Arabia DTx market captured the largest revenue share of 35.2% in 2025, driven by rapid adoption of digital health platforms, supportive government initiatives such as Vision 2030, and rising healthcare expenditure. Patients and healthcare providers increasingly prioritize mobile- and cloud-based therapeutic solutions for chronic disease management and mental health interventions. The growing integration of DTx with telemedicine platforms and hospital systems is expanding accessibility and improving treatment adherence. Moreover, high smartphone penetration and digital literacy are significantly contributing to the market’s growth.
United Arab Emirates (UAE) Digital Therapeutic Market Insight
The UAE DTx market is projected to expand at a substantial CAGR throughout the forecast period, fueled by government-backed digital health programs, increasing investment in healthcare technology, and rising awareness of preventive and treatment-focused digital therapeutics. Growing adoption of wearable devices and mobile applications, combined with a strong focus on patient-centric care, is accelerating uptake. The country’s advanced infrastructure and willingness to adopt innovative healthcare solutions further bolster market expansion across residential, clinical, and corporate wellness applications.
South Africa Digital Therapeutic Market Insight
The South Africa DTx market is expected to witness the fastest growth during the forecast period due to expanding digital infrastructure, increasing telemedicine adoption, and rising chronic disease prevalence. Patients and healthcare providers are increasingly turning to mobile- and web-based DTx platforms for remote monitoring, personalized interventions, and preventive care programs. Government and private sector initiatives promoting digital healthcare access in urban and semi-urban areas are supporting rapid adoption. The growing emphasis on preventive health and wellness programs in corporate and community settings further drives market expansion.
Egypt Digital Therapeutic Market Insight
The Egypt DTx market is gaining momentum due to increasing healthcare digitization, government efforts to improve healthcare access, and rising chronic disease burden. Patients are adopting DTx platforms for both mental health and chronic condition management, with a focus on mobile app-based interventions. Integration with telemedicine platforms and hospital systems enhances real-time monitoring and treatment adherence. Increasing awareness among clinicians and patients, coupled with support from private healthcare providers, is propelling market growth in both urban and semi-urban regions.
Middle East and Africa Digital Therapeutic (DTx) Market Share
The Middle East and Africa Digital Therapeutic (DTx) industry is primarily led by well-established companies, including:
- Pear Therapeutics, Inc. (U.S.)
- Akili Interactive Labs, Inc. (U.S.)
- Teladoc Health, Inc. (U.S.)
- Omada Health, Inc. (U.S.)
- ResMed, Inc. (U.S.)
- Canary Health, Inc. (U.S.)
- Click Therapeutics, Inc. (U.S.)
- 2Morrow, Inc. (U.S.)
- WellDoc, Inc. (U.S.)
- Ayogo Health Inc. (Canada)
- Kaia Health Software GmbH (Germany)
- Noom, Inc. (U.S.)
- Medtronic plc (Ireland)
- DarioHealth Corp. (U.S.)
- Big Health Ltd (U.K.)
- GAIA AG (Switzerland)
- Voluntis, Inc. (France)
- CogniFit Ltd. (Spain)
- Happify, Inc. (U.S.)
- Better Therapeutics, Inc. (U.S.)
What are the Recent Developments in Middle East and Africa Digital Therapeutic (DTx) Market?
- In October 2025, Saudi Arabia’s national Sehaty app integrated an AI‑powered health coach developed with Google Cloud, offering real‑time voice and video interaction to provide personalised preventive care guidance and health recommendations based on each user’s verified medical history. This represents a significant step in the country’s Vision 2030 healthcare transformation, bringing AI‑assisted digital support directly to patients for proactive health management
- In September 2025, Turn.io announced the cohort for its 2025 Chat for Health & AI Accelerator, a 24‑week programme that selects 10 organisations globally including several from Africa to scale AI‑powered conversational health solutions designed to improve patient access, appointment management, treatment adherence, and behaviour‑change support using WhatsApp and other chat platforms
- In April 2025, Shezlong launched the region’s first AI‑powered therapy assistant designed to support mental health professionals and patients by generating personalised treatment insights, tracking emotional patterns, and offering adaptive self‑care activities between sessions. This innovation aims to enhance the effectiveness of digital mental health care across the Middle East and Africa by boosting patient engagement, improving therapist‑patient matching, and accelerating therapeutic outcomes through data‑driven, AI‑enabled support
- In February 2025, Aster DM Healthcare launched its myAster digital health app in Saudi Arabia, featuring AI‑ and generative‑AI voice‑enabled Arabic symptom analysis powered by Google Cloud, teleconsultations, e‑pharmacy, appointment scheduling, chronic condition tracking, and health record access. The launch reflects a major regional push toward integrated digital care that combines remote monitoring with personalised, AI‑assisted interaction bridging language and accessibility gaps in the Kingdom’s healthcare system
- In March 2022, Altibbi the largest Arabic‑first digital health platform raised USD 44 million in Series B funding to advance its integrated primary care and digital health services across Saudi Arabia, UAE, and the broader MENA region. While not exclusively labelled “digital therapeutics,” this investment significantly expanded the platform’s ability to deliver telehealth, AI‑assisted care, and remote clinical support key enablers of DTx uptake in the region
SKU-

- Interactive Data Analysis Dashboard
- Company Analysis Dashboard for high growth potential opportunities
- Research Analyst Access for customization & queries
- Competitor Analysis with Interactive dashboard
- Latest News, Updates & Trend analysis
- Harness the Power of Benchmark Analysis for Comprehensive Competitor Tracking
Data collection and base year analysis are done using data collection modules with large sample sizes. The stage includes obtaining market information or related data through various sources and strategies. It includes examining and planning all the data acquired from the past in advance. It likewise envelops the examination of information inconsistencies seen across different information sources. The market data is analysed and estimated using market statistical and coherent models. Also, market share analysis and key trend analysis are the major success factors in the market report. To know more, please request an analyst call or drop down your inquiry.
The key research methodology used by DBMR research team is data triangulation which involves data mining, analysis of the impact of data variables on the market and primary (industry expert) validation. Data models include Vendor Positioning Grid, Market Time Line Analysis, Market Overview and Guide, Company Positioning Grid, Patent Analysis, Pricing Analysis, Company Market Share Analysis, Standards of Measurement, Global versus Regional and Vendor Share Analysis. To know more about the research methodology, drop in an inquiry to speak to our industry experts.
Data Bridge Market Research is a leader in advanced formative research. We take pride in servicing our existing and new customers with data and analysis that match and suits their goal. The report can be customized to include price trend analysis of target brands understanding the market for additional countries (ask for the list of countries), clinical trial results data, literature review, refurbished market and product base analysis. Market analysis of target competitors can be analyzed from technology-based analysis to market portfolio strategies. We can add as many competitors that you require data about in the format and data style you are looking for. Our team of analysts can also provide you data in crude raw excel files pivot tables (Fact book) or can assist you in creating presentations from the data sets available in the report.


