
Middle East And Africa Natural Vitamins Market
Market Size in USD Million
 USD
443.69 Million
USD
712.53 Million
2024
2032
USD
443.69 Million
USD
712.53 Million
2024
2032
| 2025 - 2032 | |
| USD 443.69 Million | |
| USD 712.53 Million | |
| % | |
|
Natural Vitamins Market Size
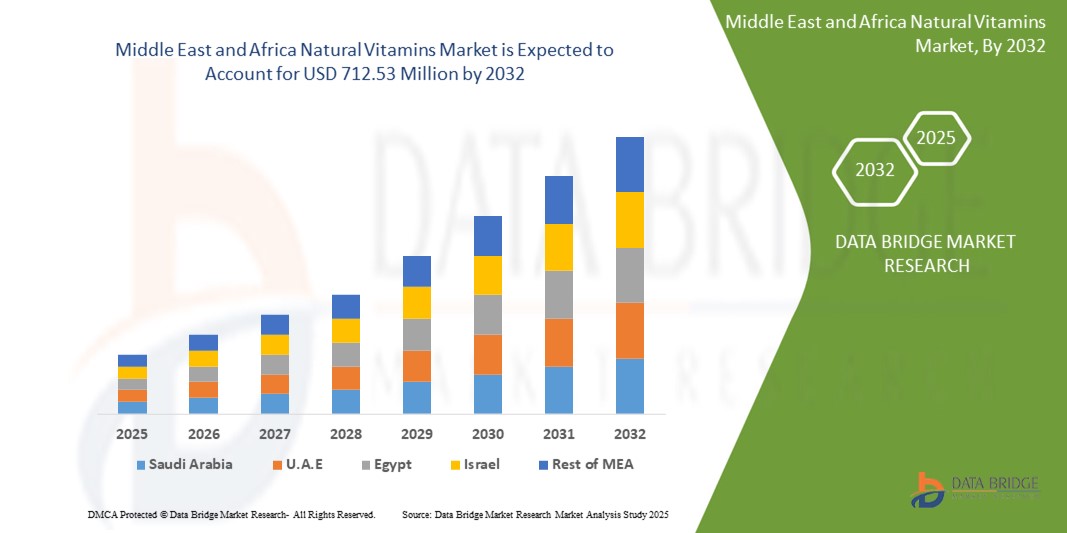
- The Middle East and Africa natural vitamins market size was valued at USD 443.69 million in 2024 and is expected to reach USD 712.53 million by 2032, at a CAGR of 6.1% during the forecast period
- The market growth is driven by increasing consumer awareness of health and wellness, rising demand for natural and organic products, and growing adoption of dietary supplements in the region
- In addition, the shift toward preventive healthcare and the rising popularity of natural vitamins in food, beverage, and personal care applications are key factors accelerating market expansion
Natural Vitamins Market Analysis
- Natural vitamins, derived from natural sources such as plants, fruits, and herbs, are increasingly vital in supporting health and wellness across various applications, including food & beverages, feed, and personal care products, due to their perceived safety and efficacy
- The demand for natural vitamins is fueled by growing health consciousness, increasing prevalence of vitamin deficiencies, and a preference for clean-label, sustainable products
- South Africa dominated the Middle East and Africa natural vitamins market with the largest revenue share of 38.5% in 2024, driven by a well-established health and wellness industry, high consumer awareness, and the presence of key market players. The country is witnessing significant growth in natural vitamin consumption, particularly in fortified foods and dietary supplements
- The U.A.E. is expected to be the fastest-growing country in the natural vitamins market during the forecast period, propelled by rapid urbanization, rising disposable incomes, and increasing demand for premium health and wellness products
- The Vitamin C segment dominated the largest market revenue share of 32.5% in 2024, driven by its widespread use in dietary supplements and fortified foods due to its immune-boosting properties and high consumer awareness
Report Scope and Natural Vitamins Market Segmentation
|
Attributes |
Natural Vitamins Key Market Insights |
|
Segments Covered |
|
|
Countries Covered |
Middle East and Africa
|
|
Key Market Players |
|
|
Market Opportunities |
|
|
Value Added Data Infosets |
In addition to the insights on market scenarios such as market value, growth rate, segmentation, geographical coverage, and major players, the market reports curated by the Data Bridge Market Research also include in-depth expert analysis, pricing analysis, brand share analysis, consumer survey, demography analysis, supply chain analysis, value chain analysis, raw material/consumables overview, vendor selection criteria, PESTLE Analysis, Porter Analysis, and regulatory framework. |
Natural Vitamins Market Trends
“Increasing Adoption of Clean-Label and Organic Products”
- The Middle East and Africa natural vitamins market is experiencing a significant trend toward clean-label and organic products, driven by growing consumer awareness of health and wellness
- Consumers are increasingly seeking natural vitamins derived from plant and animal sources, perceiving them as healthier and more sustainable compared to synthetic alternatives
- This trend is boosting demand for vitamins in various forms, such as powders and liquids, used in applications such as food & beverages, feed, and personal care products
- For instances, companies are developing organic, whole-food-based vitamin supplements to cater to health-conscious consumers, particularly in urban areas of South Africa and the U.A.E
- The clean-label movement is also influencing product formulations, with manufacturers emphasizing transparency in sourcing and production to build consumer trust
- Natural vitamins, such as Vitamin C from fruits or Vitamin D from natural sources, are gaining traction for their perceived benefits in supporting immunity and overall health
Natural Vitamins Market Dynamics
Driver
“Rising Health Awareness and Demand for Nutritional Supplements”
- Increasing consumer awareness of the nutritional benefits of vitamins, coupled with rising health consciousness, is a major driver for the Middle East and Africa natural vitamins market
- Natural vitamins enhance health by supporting immunity, metabolism, and overall well-being, addressing deficiencies caused by modern diets and lifestyles
- Government initiatives in countries such as South Africa and the U.A.E. to promote fortified foods and nutritional supplements are further accelerating market growth
- The expansion of e-commerce platforms in the region is improving access to natural vitamin products, with online distribution channels growing rapidly, particularly in the U.A.E
- The demand for functional foods and beverages fortified with natural vitamins, such as Vitamin A, B, C, D, E, and K, is rising, especially in urban centers where consumers prioritize convenience and nutrition
Restraint/Challenge
“High Production Costs and Regulatory Complexities”
- The high cost of sourcing and producing natural vitamins, particularly from organic and plant-based materials, poses a significant barrier to market growth, especially in cost-sensitive regions of Africa
- Extracting vitamins from natural sources, such as fruits, vegetables, or animal-based materials, requires complex processes, increasing production costs compared to synthetic alternatives
- Data privacy and regulatory compliance concerns also present challenges, as the collection and use of consumer data for personalized nutrition products must adhere to varying regulations across Middle Eastern and African countries
- The fragmented regulatory landscape, with differing standards for food safety, labeling, and health claims in countries such as South Africa, the U.A.E., and Saudi Arabia, complicates operations for manufacturers and distributors
- These factors can deter smaller companies and limit market expansion, particularly in regions with lower disposable incomes or stringent regulatory environments
Natural Vitamins market Scope
The market is segmented on the basis of ingredient type, form, application, material, and distribution channel.
- By Ingredient Type
On the basis of ingredient type, the Middle East and Africa natural vitamins market is segmented into Vitamin A, Vitamin B, Vitamin C, Vitamin D, Vitamin E, and Vitamin K. The Vitamin C segment dominated the largest market revenue share of 32.5% in 2024, driven by its widespread use in dietary supplements and fortified foods due to its immune-boosting properties and high consumer awareness.
The Vitamin D segment is expected to witness the fastest growth rate from 2025 to 2032, fueled by increasing awareness of its role in bone health and immunity, particularly in regions with limited sunlight exposure. Rising demand for fortified food products and supplements in the Middle East and Africa further accelerates adoption.
- By Form
On the basis of form, the Middle East and Africa natural vitamins market is segmented into powder and liquid. The powder segment is expected to hold the largest market revenue share of 68.5% in 2024, primarily due to its longer shelf life, ease of storage, and versatility in applications such as food fortification and dietary supplements.
The liquid segment is anticipated to witness the fastest growth rate of 8.2% from 2025 to 2032, driven by increasing consumer preference for convenient, easy-to-consume formats such as syrups and gummies, particularly among children and the elderly.
- By Application
On the basis of application, the Middle East and Africa natural vitamins market is segmented into food & beverages, feed, personal care products, and others. The food & beverages segment is expected to hold the largest market revenue share of 45.5% in 2024, driven by the rising demand for fortified foods and functional beverages to address nutritional deficiencies across the region.
The personal care products segment is anticipated to experience robust growth from 2025 to 2032. Increasing consumer interest in natural and organic skincare and haircare products, incorporating vitamins such as E and C for their antioxidant properties, is boosting adoption in the Middle East and Africa.
- By Material
On the basis of material, the Middle East and Africa natural vitamins market is segmented into steel, iron, and other materials. The steel segment is expected to hold the largest market revenue share of 55.5% in 2024, owing to its widespread use in packaging and processing equipment for natural vitamins, ensuring durability and compliance with food safety standards.
The other materials segment is anticipated to witness significant growth from 2025 to 2032, driven by the increasing adoption of sustainable and eco-friendly packaging materials, such as biodegradable plastics and glass, aligning with consumer preferences for environmentally responsible products.
- By Distribution Channel
On the basis of distribution channel, the Middle East and Africa natural vitamins market is segmented into online and offline. The offline segment dominated the market revenue share of 70.5% in 2024, driven by the widespread presence of supermarkets, pharmacies, and specialty stores, particularly in South Africa, where consumers prefer purchasing nutritional products in-store for convenience and trust.
The online segment is expected to witness rapid growth of 10.5% from 2025 to 2032, fueled by the increasing penetration of e-commerce platforms and digital retail in the U.A.E., where rising disposable incomes and smartphone usage enhance accessibility to natural vitamin products.
Natural Vitamins Market Regional Analysis
- South Africa dominated the Middle East and Africa natural vitamins market with the largest revenue share of 38.5% in 2024, driven by a well-established health and wellness industry, high consumer awareness, and the presence of key market players. The country is witnessing significant growth in natural vitamin consumption, particularly in fortified foods and dietary supplements
- The U.A.E. is expected to be the fastest-growing country in the natural vitamins market during the forecast period, propelled by rapid urbanization, rising disposable incomes, and increasing demand for premium health and wellness products
South Africa Natural Vitamins Market Insight
South Africa dominated the Middle East and Africa natural vitamins market with the highest revenue share 0f 68.9% in 2024, driven by high consumption of nutrition-rich food products and strong consumer preference for convenient, vitamin-fortified products. The trend towards health-conscious diets and increasing awareness of natural vitamin benefits fuel market expansion. The integration of vitamins in functional foods and supplements, along with robust offline distribution channels, supports sustained market growth.
U.A.E. Natural Vitamins Market Insight
The U.A.E. is expected to witness the fastest growth rate in the Middle East and Africa natural vitamins market, propelled by rising awareness of the importance of natural vitamins in food, feed, and personal care products. Urbanization, increasing disposable incomes, and a growing expatriate population drive demand for health-focused products. Evolving regulations promoting clean-label and natural ingredients further encourage the adoption of advanced vitamin formulations.Natural Vitamins Market Share
The natural vitamins industry is primarily led by well-established companies, including:
- BASF SE (Germany)
- DSM Nutritional Products (Netherlands)
- Archer Daniels Midland Company (U.S.)
- Glanbia Plc (Ireland)
- Nature’s Bounty (U.S.)
- Amway (U.S.)
- Nestlé Health Science (Switzerland)
- Herbalife Nutrition (U.S.)
- Vitabiotics Ltd. (U.K.)
- Solgar Inc. (U.S.)
- NOW Foods (U.S.)
- Blackmores Limited (Australia)
- NutraMarks, Inc. (U.S.)
- Pharmavite LLC (U.S.)
- Himalaya Wellness (India)
- Zand Herbal (U.S.)
What are the Recent Developments in Middle East and Africa Natural Vitamins Market?
- In October 2024, Zinereo Pharma, a subsidiary of the Zendal Group, entered a strategic partnership with Cigalah Medpharm to expand its natural vitamins and probiotics portfolio across the Middle East. The collaboration focuses on distributing Zinereo’s flagship brands—Fertibiome and Flowbiotic—in six countries, addressing rising demand for digestive and fertility health solutions. Cigalah Medpharm, part of the Yousuf M.A. Naghi & Sons Group, brings strong regional expertise in pharmaceutical and healthcare distribution, enabling Zinereo to strengthen its footprint in a rapidly growing market for high-quality, science-backed supplements
- In July 2023, PepsiCo expanded its MTN Dew Rise Energy line—a functional beverage enriched with vitamins A and C, citicoline, and zinc—to retail markets across the Middle East and Africa. Developed in collaboration with NBA icon LeBron James, the drink was designed to provide a morning energy boost with natural ingredients, zero added sugar, and 180 mg of caffeine. The launch aligned with rising regional demand for vitamin-enhanced functional beverages, especially among health-conscious consumers seeking alternatives to traditional energy drinks
- In April 2022, Nestlé did not acquire Vital Health Foods. Instead, the company was acquired by EXEO Capital, a pan-African investment firm, through its platform Nurture Brands (Pty) Ltd. The acquisition aimed to scale Vital’s presence in the functional and convenience foods sector, leveraging its strong brand recognition and distribution network across South Africa and international markets. Vital Health Foods, with a 75-year legacy, continues to be a trusted name in natural vitamin supplements throughout the region
- In October 2021, Tikun Olam-Cannbit, a leading Israeli medical cannabis company, partnered with Ambrosia-SupHerb, Israel’s largest nutritional supplement manufacturer, to co-develop a line of natural vitamin supplements infused with cannabis and medicinal mushroom components. The collaboration launched a joint R&D pilot aimed at creating innovative formulations that combine CBD and other cannabis-derived compounds with functional mushrooms to support immune health, digestion, and overall wellness. Targeting markets in the Middle East and Africa, the partnership reflects growing consumer interest in plant-based, synergistic health solutions that blend traditional botanicals with cutting-edge science
- In September 2021, Royal DSM renewed its collaboration with UNICEF and the nutrition think tank Sight and Life to improve access to natural vitamin-based supplements for vulnerable children and mothers in South Africa and other regions. This initiative aimed to combat micronutrient deficiencies by delivering science-backed nutritional solutions to those most in need. The partnership reflects DSM’s broader commitment to advancing public health, supporting sustainable development, and expanding its presence in emerging markets through impactful, purpose-driven programs that address malnutrition at scale
SKU-

- Interactive Data Analysis Dashboard
- Company Analysis Dashboard for high growth potential opportunities
- Research Analyst Access for customization & queries
- Competitor Analysis with Interactive dashboard
- Latest News, Updates & Trend analysis
- Harness the Power of Benchmark Analysis for Comprehensive Competitor Tracking
Middle East And Africa Natural Vitamins Market, Supply Chain Analysis and Ecosystem Framework
To support market growth and help clients navigate the impact of geopolitical shifts, DBMR has integrated in-depth supply chain analysis into its Middle East And Africa Natural Vitamins Market research reports. This addition empowers clients to respond effectively to global changes affecting their industries. The supply chain analysis section includes detailed insights such as Middle East And Africa Natural Vitamins Market consumption and production by country, price trend analysis, the impact of tariffs and geopolitical developments, and import and export trends by country and HSN code. It also highlights major suppliers with data on production capacity and company profiles, as well as key importers and exporters. In addition to research, DBMR offers specialized supply chain consulting services backed by over a decade of experience, providing solutions like supplier discovery, supplier risk assessment, price trend analysis, impact evaluation of inflation and trade route changes, and comprehensive market trend analysis.
Data collection and base year analysis are done using data collection modules with large sample sizes. The stage includes obtaining market information or related data through various sources and strategies. It includes examining and planning all the data acquired from the past in advance. It likewise envelops the examination of information inconsistencies seen across different information sources. The market data is analysed and estimated using market statistical and coherent models. Also, market share analysis and key trend analysis are the major success factors in the market report. To know more, please request an analyst call or drop down your inquiry.
The key research methodology used by DBMR research team is data triangulation which involves data mining, analysis of the impact of data variables on the market and primary (industry expert) validation. Data models include Vendor Positioning Grid, Market Time Line Analysis, Market Overview and Guide, Company Positioning Grid, Patent Analysis, Pricing Analysis, Company Market Share Analysis, Standards of Measurement, Global versus Regional and Vendor Share Analysis. To know more about the research methodology, drop in an inquiry to speak to our industry experts.
Data Bridge Market Research is a leader in advanced formative research. We take pride in servicing our existing and new customers with data and analysis that match and suits their goal. The report can be customized to include price trend analysis of target brands understanding the market for additional countries (ask for the list of countries), clinical trial results data, literature review, refurbished market and product base analysis. Market analysis of target competitors can be analyzed from technology-based analysis to market portfolio strategies. We can add as many competitors that you require data about in the format and data style you are looking for. Our team of analysts can also provide you data in crude raw excel files pivot tables (Fact book) or can assist you in creating presentations from the data sets available in the report.


