
Market Analysis and Size
Various type of power tools available in corded and cordless platforms possessing power capacities are being widely deployed. The functionality and penetration of use for large scale jobs has improved due to the enhanced mechanisms and batteries.
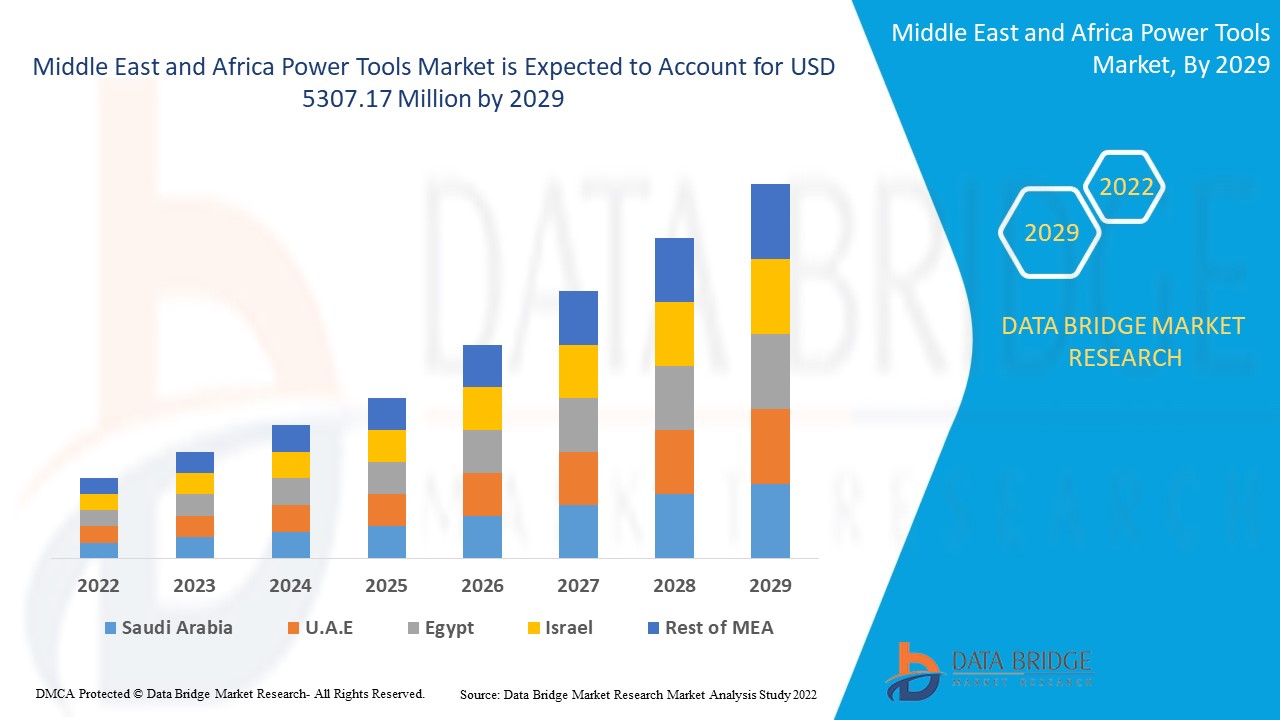
Middle East and Africa power tools market was valued at USD 3721.31 million in 2021 and is expected to reach USD 5307.17 million by 2029, registering a CAGR of 6.10% during the forecast period of 2022-2029. Drilling and Fastening Tools accounts for the largest type segment in the end use industry owing to their easy use and they are cheaper as compared to other power tools. The market report curated by the Data Bridge Market Research team includes in-depth expert analysis, import/export analysis, pricing analysis, production consumption analysis, and pestle analysis.
Market Definition
From the name itself, it is clear that power tools are the semiconductor tools that are used for a range of industrial applications when actuated by an additional power source. Circular saws, jigsaws, drills, hammer-drills, sanders, grinders, routers and numerous others are the examples of power tools. However, if not operated with due considerations and carefulness, power tools can bring along numerous hazards.
Report Scope and Market Segmentation
|
Report Metric |
Details |
|
Forecast Period |
2022 to 2029 |
|
Base Year |
2021 |
|
Historic Years |
2020 (Customizable to 2019 - 2014) |
|
Quantitative Units |
Revenue in USD Million, Volumes in Units, Pricing in USD |
|
Segments Covered |
Type (Sawing and Cutting Tools, Drilling and Fastening Tools, Demolition Tools, Routing Tools, Portable Nibblers, Air-Powered Tools, Material Removal Tools, Electric Cords and Plugs, Accessories, Others), Mode of Operation (Electric, Liquid Fuel Tool, Hydraulic, Pneumatic, Powder-Actuated Tools), Application (Concrete and Construction, Woodworking, Metalworking, Welding, Others), Material (Concrete, Wood/Metal, Brick/Block, Glass, Others), End User (Industrial/Professional, Residential), Sales Channel (Indirect Sales, Direct Sales) |
|
Countries Covered |
Saudi Arabia, U.A.E, South Africa, Egypt, Israel, Rest of Middle East and Africa (MEA). |
|
Market Players Covered |
Stanley Black & Decker, Inc. (US), Robert Bosch GmbH (Germany), Techtronic Industries Co. Ltd. (Hong Kong), Makita Corporation (Japan), Hilti Corporation (Liechtenstein), Atlas Copco AB (Sweden), Ingersoll Rand (US), Snap-on Incorporated (US), Apex Tool Group (US), Koki Holding Co., Ltd. (Japan), Honeywell International Inc. (US), 3M (US), Emerson Electric Co. (US), Festool GmbH (Germany), KYOCERA Corporation (Japan), Makita Corporation (Japan), Hilti AG (Liechtenstein) and Husqvarna AB (Sweden) |
|
Market Opportunities |
|
Middle East and Africa Power Tools Market Dynamics
This section deals with understanding the market drivers, opportunities, restraints and challenges. All of this is discussed in detail as below:
Drivers:
- Growth in investment for research and development to carve way for innovations
The rising number of strategic market collaborations has led to the rise in funds to be allocated for the growth and development of advanced and automated technology/ machinery. Further, growth in the level of investment for research and development proficiencies would carve the way for innovations in manufacturing technology.
- Increased proliferation of electronics globally to induce greater demand and supply in emerging nations
Growing proliferation and penetration of electronic tools and equipment is one of the major factors fostering the growth of the market. In other words, increased demand and availability of electric nut wrenches, power fretsaws, power screwdrivers, electric hammers, and power compactors, is directly influencing the growth rate of the market. Also, growing acceptance and application by the aerospace industry will further carve the way for the market growth.
- Growth and expansion of end user verticals to present numerous opportunities for small scale businesses
Owing to the global economic rise, there is a huge scope of growth for the semiconductors and electronics industry. There is an increased focus of the major manufacturers on the application of advanced technologies which will widen the scope of growth.
Opportunities:
- Buildings and construction industry to present many opportunities
Rising urbanization, modernization, and globalization drive market value growth. In other words, growing number of buildings and construction activities especially in the developing economies to develop the infrastructure will present very many opportunities for the growth of the market.
Growing industrial infrastructure and remodelling of concrete structures, increasing advancement in the technology to improve the functioning of semiconductor tools, and increased awareness regarding vehicle safety and technological advancements by the automotive industry are other market growth determinants. Furthermore, advancements in manufacturing technology extend profitable opportunities to the market players in the forecast period of 2022 to 2029. Additionally, rising adoption of battery-powered power tools globally, and surging demand for electric fastening tools in industrial environment will further expand the future growth of the market.
Restrictions/ challenges Middle East and Africa Power Tools Market
- Increased number of regulations to limit the scope of growth in the long run
Rising enforcement of stringent environmental regulations imposed on the industries will create hindrances for the growth of the market. Also, stringent regulations on product approvals will narrow down the scope of growth for the market. Further, suspension of business activity on account of the coronavirus pandemic will yet again create hindrances.
- Supply chain disruptions will pose a threat to the unprecedentedly growing market demand
With the rising number of restrictions around the globe due to pandemic, there has been a hit in the demand and supply of display materials. Also, fluctuations in the prices of raw materials will prove to be a demerit for the market. Therefore, this will challenge the market growth rate.
Also, dearth of awareness in underdeveloped regions and high costs associated with manufacturing activities will act as growth restraints for the market. Lack of strong infrastructural facilities in the backward economies, declining sales of commercial vehicles due to COVID-19 and accidents and health issues associated with power tools will also challenge the market growth rate.
This power tools market report provides details of new recent developments, trade regulations, import-export analysis, production analysis, value chain optimization, market share, impact of domestic and localized market players, analyses opportunities in terms of emerging revenue pockets, changes in market regulations, strategic market growth analysis, market size, category market growths, application niches and dominance, product approvals, product launches, geographic expansions, technological innovations in the market. To gain more info on the power tools market contact Data Bridge Market Research for an Analyst Brief, our team will help you take an informed market decision to achieve market growth.
Covid-19 Impact on Middle East and Africa Power Tools Market
The COVID-19 has impacted power tools market. The limited investment costs and lack of employees hampered sales and production of power tools technology. However, government and market key players adopted new safety measures for developing the practices. The advancements in the technology escalated the sales rate of the thermocouple temperature sensors as it targeted the right audience. The increase in industrialization across the globe is expected to further drive the market growth in the post-pandemic scenario.
Recent Developments
- In March 2020, Robert Bosch GmbH announced the launch of virtually dustless drilling. The cordless dust extractor is fitted into Bosch’s hammers for protection against the dust while drilling and scaffolding. The new product increased the product portfolio of the company.
- In March 2019, Festool GmbH announced the launch of Vecturo OSC 18 cordless oscillating tool. The new cordless tool consists of 18-volt li-ion battery pack and brushless EC-TEC motor provide. The product offers precise cutting, scraping and sawing. The new product increased the product portfolio of the company.
Middle East and Africa Power Tools Market Scope
The power tools market is segmented on the basis of type, mode of operation, application, material, end user, and sales channel. The growth amongst these segments will help you analyze meagre growth segments in the industries and provide the users with a valuable market overview and market insights to help them make strategic decisions for identifying core market applications.
Type
- Sawing and Cutting Tools
- Drilling and Fastening Tools
- Demolition Tools
- Routing Tools
- Portable Nibblers
- Air-Powered Tools
- Material Removal Tools
- Electric Cords and Plugs
- Accessories
- Others
Mode of operation
- Electric
- Liquid Fuel Tool
- Hydraulic
- Pneumatic
- Powder-Actuated Tools
Application
- Concrete and Construction
- Woodworking
- Metalworking
- Welding
- Others
Material
- Concrete
- Wood/Metal
- Brick/Block
- Glass
- Others
End user
- Industrial/Professional
- Residential
Middle East and Africa Power Tools Market Regional Analysis/Insights
The power tools market is analyzed and market size insights and trends are provided by country, type, mode of operation, application, material, end user, and sales channel as referenced above.
The countries covered in the power tools market report are Saudi Arabia, U.A.E, South Africa, Egypt, Israel, Rest of Middle East and Africa (MEA).
Israel is dominating in the Middle East & Africa region due to increased government initiatives taken to boost the construction projects which require power tools for better productivity and efficiency in work.
The country section of the report also provides individual market impacting factors and changes in regulation in the market domestically that impacts the current and future trends of the market. Data points like down-stream and upstream value chain analysis, technical trends and porter's five forces analysis, case studies are some of the pointers used to forecast the market scenario for individual countries. Also, the presence and availability of global brands and their challenges faced due to large or scarce competition from local and domestic brands, impact of domestic tariffs and trade routes are considered while providing forecast analysis of the country data.
Competitive Landscape and Middle East and Africa Power Tools Market
The power tools market competitive landscape provides details by competitor. Details included are company overview, company financials, revenue generated, market potential, investment in research and development, new market initiatives, global presence, production sites and facilities, production capacities, company strengths and weaknesses, product launch, product width and breadth, application dominance. The above data points provided are only related to the companies' focus related to power tools market.
Some of the major players operating in the power tools market are
- Stanley Black & Decker, Inc. (US)
- Robert Bosch GmbH (Germany)
- Techtronic Industries Co. Ltd. (Hong Kong)
- Makita Corporation (Japan)
- Hilti Corporation (Liechtenstein)
- Atlas Copco AB (Sweden)
- Ingersoll Rand (US)
- Snap-on Incorporated (US)
- Apex Tool Group (US)
- Koki Holding Co., Ltd. (Japan)
- Honeywell International Inc. (US)
- 3M (US)
- Emerson Electric Co. (US)
- Festool GmbH (Germany)
- KYOCERA Corporation (Japan)
- Makita Corporation (Japan),
- Hilti AG (Liechtenstein)
- Husqvarna AB (Sweden)
SKU-

- Interactive Data Analysis Dashboard
- Company Analysis Dashboard for high growth potential opportunities
- Research Analyst Access for customization & queries
- Competitor Analysis with Interactive dashboard
- Latest News, Updates & Trend analysis
- Harness the Power of Benchmark Analysis for Comprehensive Competitor Tracking
Table of Content
1 INTRODUCTION
1.1 OBJECTIVES OF THE STUDY
1.2 MARKET DEFINITION
1.3 OVERVIEW OF MIDDLE EAST AND AFRICA POWER TOOLS MARKET
1.4 CURRENCY AND PRICING
1.5 LIMITATIONS
1.6 MARKETS COVERED
2 MARKET SEGMENTATION
2.1 MARKETS COVERED
2.2 GEOGRAPHICAL SCOPE
2.3 YEARS CONSIDERED FOR THE STUDY
2.4 DBMR TRIPOD DATA VALIDATION MODEL
2.5 PRIMARY INTERVIEWS WITH KEY OPINION LEADERS
2.6 DBMR MARKET POSITION GRID
2.7 VENDOR SHARE ANALYSIS
2.8 MULTIVARIATE MODELING
2.9 TYPE TIMELINE CURVE
2.1 MARKET APPLICATION COVERAGE GRID
2.11 SECONDARY SOURCES
2.12 ASSUMPTIONS
3 EXECUTIVE SUMMARY
4 PREMIUM INSIGHTS
4.1 PREMIUM INSIGHTS
5 MARKET OVERVIEW
5.1 DRIVERS
5.1.1 INCREASE IN THE GROWTH OF CORDLESS POWER TOOLS
5.1.2 INTEGRATION OF BRUSHLESS MOTORS IN POWER TOOLS
5.1.3 INCREASING GROWTH IN INFRASTRUCTURE PROJECTS MIDDLE EAST AND AFRICALY
5.1.4 BETTER OFFERING THAN HAND TOOLS
5.1.5 EXPANSION OF THE MOTOR VEHICLE MAINTENANCE MARKET AS VEHICLE OWNERSHIP RATE INCREASES
5.2 RESTRAINTS
5.2.1 HIGH MAINTENANCE OF POWER TOOLS
5.2.2 FLUCTUATION IN THE PRICES OF RAW MATERIALS
5.2.3 LIMITATIONS INVOLVED IN LI-ION BATTERY USAGE FOR CORDLESS POWER TOOLS
5.3 OPPORTUNITIES
5.3.1 GROWTH IN WIND ENERGY INDUSTRY AIDING THE POWER TOOLS MARKET
5.3.2 SMART CONNECTIVITY IN POWER TOOLS
5.3.3 TECHNOLOGICAL INNOVATIONS IN INDUSTRY 4.0
5.3.4 POWER TOOLS BEING MADE AVAILABLE ON E-COMMERCE PLATFORM
5.4 CHALLENGES
5.4.1 DESIGNING ERGONOMIC AND LIGHTWEIGHT POWER TOOLS
5.4.2 REGULATORY COMPLIANCE AND POWER TOOL SAFETY
6 ANALYSIS OF IMPACT OF COVID-19 PANDEMIC ON THE MIDDLE EAST AND AFRICA POWER TOOLS MARKET
6.1 AFTERMATH OF COVID-19 AND GOVERNMENT INITIATIVE TO BOOST THE MARKET
6.2 STRATEGIC DECISIONS FOR MANUFACTURERS AFTER COVID-19 TO GAIN COMPETITIVE MARKET SHARE
6.3 IMPACT ON DEMAND
6.4 IMPACT ON SUPPLY CHAIN
6.5 CONCLUSION
7 MIDDLE EAST AND AFRICA POWER TOOLS MARKET, BY TYPE
7.1 OVERVIEW
7.2 SAWING AND CUTTING TOOLS
7.2.1 CIRCULAR SAWS
7.2.2 JIGSAWS
7.2.3 MULTI-CUTTER SAWS
7.2.4 CHOP SAWS
7.2.5 BAND SAWS
7.2.6 RECIPROCATING SAWS
7.2.7 SHEARS AND NIBBLERS
7.3 DRILLING AND FASTENING TOOLS
7.3.1 DRILLS
7.3.2 SCREWDRIVERS AND NUTRUNNERS
7.3.3 IMPACT WRENCHES
7.3.4 IMPACT DRIVERS
7.4 DEMOLITION TOOLS
7.4.1 DEMOLITION HAMMER
7.4.2 HAMMER DRILL
7.4.3 BREAKER
7.4.4 ROTARY HAMMER
7.4.5 OTHERS
7.5 ROUTING TOOLS
7.5.1 ROUTERS/PLANER
7.5.2 JOINERS
7.6 PORTABLE NIBBLERS
7.7 AIR-POWERED TOOLS
7.7.1 AIR HOSES
7.7.2 AIR HAMMERS
7.7.3 AIR SCALERS
7.7.4 OTHERS
7.8 MATERIAL REMOVAL TOOLS
7.8.1 GRINDERS
7.8.1.1 DIE AND STRAIGHT GRINDER
7.8.1.2 ANGLE GRINDER
7.8.1.3 ROTARY FILES
7.8.1.4 BENCH GRINDER
7.8.1.5 PENCIL GRINDERS
7.8.2 SANDERS
7.8.3 POLISHERS/BUFFERS
7.9 ELECTRIC CORDS AND PLUGS
7.1 ACCESSORIES
7.11 OTHERS
8 MIDDLE EAST AND AFRICA POWER TOOLS MARKET, BY MODE OF OPERATION
8.1 OVERVIEW
8.2 ELECTRIC
8.2.1 CORDED TOOL
8.2.2 CORDLESS TOOL
8.3 LIQUID FUEL TOOL
8.4 HYDRAULIC
8.5 PNEUMATIC
8.6 POWDER-ACTUATED TOOLS
9 MIDDLE EAST AND AFRICA POWER TOOLS MARKET, BY APPLICATION
9.1 OVERVIEW
9.2 CONCRETE AND CONSTRUCTION
9.3 WOODWORKING
9.4 METALWORKING
9.5 WELDING
9.6 OTHERS
10 MIDDLE EAST AND AFRICA POWER TOOLS MARKET, BY MATERIAL
10.1 OVERVIEW
10.2 CONCRETE
10.3 WOOD/METAL
10.4 BRICK/BLOCK
10.5 GLASS
10.6 OTHERS
11 MIDDLE EAST AND AFRICA POWER TOOLS MARKET, BY END USER
11.1 OVERVIEW
11.2 INDUSTRIAL/PROFESSIONAL
11.2.1 BY TYPE
11.2.1.1 Sawing and Cutting Tools
11.2.1.2 Drilling and Fastening Tools
11.2.1.3 Demolition Tools
11.2.1.4 Routing Tools
11.2.1.5 Portable Nibblers
11.2.1.6 Air-Powered Tools
11.2.1.7 Material Removal Tools
11.2.1.8 Electric Cords and Plugs
11.2.1.9 Others
11.2.2 BY MODE OF OPERATION
11.2.2.1 Electric
11.2.2.2 Liquid Fuel Tool
11.2.2.3 Hydraulic
11.2.2.4 Pneumatic
11.2.2.5 Powder-Actuated Tools
11.3 RESIDENTIAL
11.3.1 ELECTRIC
11.3.2 LIQUID FUEL TOOL
11.3.3 HYDRAULIC
11.3.4 PNEUMATIC
11.3.5 POWDER-ACTUATED TOOLS
12 MIDDLE EAST AND AFRICA POWER TOOLS MARKET, BY SALES CHANNEL
12.1 OVERVIEW
12.2 INDIRECT SALES
12.3 DIRECT SALES
13 MIDDLE EAST AND AFRICA POWER TOOLS MARKET, BY GEOGRAPHY
13.1 MIDDLE EAST AND AFRICA
13.1.1 ISRAEL
13.1.2 SAUDI ARABIA
13.1.3 SOUTH AFRICA
13.1.4 U.A.E.
13.1.5 EGYPT
13.1.6 REST OF MIDDLE EAST AND AFRICA
14 MIDDLE EAST AND AFRICA POWER TOOLS MARKET, COMPANY LANDSCAPE
14.1 COMPANY SHARE ANALYSIS: MIDDLE EAST AND AFRICA
15 SWOT
16 COMPANY PROFILES
16.1 TECHTRONIC INDUSTRIES CO. LTD.
16.1.1 COMPANY SNAPSHOT
16.1.2 REVENUE ANALYSIS
16.1.3 COMPANY SHARE ANALYSIS
16.1.4 PRODUCT PORTFOLIO
16.1.5 RECENT DEVELOPMENTS
16.2 STANLEY BLACK & DECKER, INC.
16.2.1 COMPANY SNAPSHOT
16.2.2 REVENUE ANALYSIS
16.2.3 COMPANY SHARE ANALYSIS
16.2.4 PRODUCT PORTFOLIO
16.2.5 RECENT DEVELOPMENTS
16.3 MAKITA CORPORATION
16.3.1 COMPANY SNAPSHOT
16.3.2 REVENUE ANALYSIS
16.3.3 COMPANY SHARE ANALYSIS
16.3.4 PRODUCT PORTFOLIO
16.3.5 RECENT DEVELOPMENTS
16.4 ROBERT BOSCH GMBH
16.4.1 COMPANY SNAPSHOT
16.4.2 REVENUE ANALYSIS
16.4.3 COMPANY SHARE ANALYSIS
16.4.4 PRODUCT PORTFOLIO
16.4.5 RECENT DEVELOPMENTS
16.5 HILTI AG
16.5.1 COMPANY SNAPSHOT
16.5.2 REVENUE ANALYSIS
16.5.3 COMPANY SHARE ANALYSIS
16.5.4 PRODUCT PORTFOLIO
16.5.5 RECENT DEVELOPMENTS
16.6 3M
16.6.1 COMPANY SNAPSHOT
16.6.2 REVENUE ANALYSIS
16.6.3 PRODUCT PORTFOLIO
16.6.4 RECENT DEVELOPMENT
16.7 APEX TOOL GROUP, LLC
16.7.1 COMPANY SNAPSHOT
16.7.2 PRODUCT PORTFOLIO
16.7.3 RECENT DEVELOPMENTS
16.8 ATLAS COPCO AB
16.8.1 COMPANY SNAPSHOT
16.8.2 REVENUE ANALYSIS
16.8.3 PRODUCT PORTFOLIO
16.8.4 RECENT DEVELOPMENT
16.9 C. & E. FEIN GMBH
16.9.1 COMPANY SNAPSHOT
16.9.2 PRODUCT PORTFOLIO
16.9.3 RECENT DEVELOPMENT
16.1 DELTA POWER EQUIPMENT CORPORATION
16.10.1 COMPANY SNAPSHOT
16.10.2 PRODUCT PORTFOLIO
16.10.3 RECENT DEVELOPMENT
16.11 EMERSON ELECTRIC CO.
16.11.1 COMPANY SNAPSHOT
16.11.2 REVENUE ANALYSIS
16.11.3 PRODUCT PORTFOLIO
16.11.4 RECENT DEVELOPMENT
16.12 FERM INTERNATIONAL B.V.
16.12.1 COMPANY SNAPSHOT
16.12.2 PRODUCT PORTFOLIO
16.12.3 RECENT DEVELOPMENT
16.13 FESTOOL GMBH
16.13.1 COMPANY SNAPSHOT
16.13.2 PRODUCT PORTFOLIO
16.13.3 RECENT DEVELOPMENT
16.14 HUSQVARNA AB
16.14.1 COMPANY SNAPSHOT
16.14.2 REVENUE ANALYSIS
16.14.3 PRODUCT PORTFOLIO
16.14.4 RECENT DEVELOPMENTS
16.15 INGERSOLL RAND
16.15.1 COMPANY SNAPSHOT
16.15.2 REVENUE ANALYSIS
16.15.3 PRODUCT PORTFOLIO
16.15.4 RECENT DEVELOPMENT
16.16 INTERSKOL
16.16.1 COMPANY SNAPSHOT
16.16.2 PRODUCT PORTFOLIO
16.16.3 RECENT DEVELOPMENTS
16.17 KOKI HOLDINGS CO., LTD.
16.17.1 COMPANY SNAPSHOT
16.17.2 PRODUCT PORTFOLIO
16.17.3 RECENT DEVELOPMENT
16.18 KYOCERA CORPORATION
16.18.1 COMPANY SNAPSHOT
16.18.2 REVENUE ANALYSIS
16.18.3 PRODUCT PORTFOLIO
16.18.4 RECENT DEVELOPMENTS
16.19 PANASONIC CORPORATION OF NORTH AMERICA (A SUBSIDIARY OF PANASONIC CORPORATION)
16.19.1 COMPANY SNAPSHOT
16.19.2 REVENUE ANALYSIS
16.19.3 PRODUCT PORTFOLIO
16.19.4 RECENT DEVELOPMENT
16.2 SNAP-ON INCORPORATED
16.20.1 COMPANY SNAPSHOT
16.20.2 REVENUE ANALYSIS
16.20.3 PRODUCT PORTFOLIO
16.20.4 RECENT DEVELOPMENTS
17 QUESTIONNAIRE
18 RELATED REPORTS
List of Table
LIST OF TABLES
TABLE 1 MIDDLE EAST AND AFRICA POWER TOOLS MARKET, BY TYPE, MARKET FORECAST 2020-2027 (USD MILLION)
TABLE 2 MIDDLE EAST AND AFRICA SAWING AND CUTTING TOOLS IN POWER TOOLS MARKET, BY REGION,2018-2027, (USD MILLION)
TABLE 3 MIDDLE EAST AND AFRICA SAWING AND CUTTING TOOLS IN POWER TOOLS MARKET, BY TYPE,2018-2027, (USD MILLION)
TABLE 4 MIDDLE EAST AND AFRICA SERVICES IN POWER TOOLS MARKET, BY REGION,2018-2027, (USD MILLION)
TABLE 5 MIDDLE EAST AND AFRICA DRILLING AND FASTENING TOOLS IN POWER TOOLS MARKET, BY TYPE,2018-2027, (USD MILLION)
TABLE 6 MIDDLE EAST AND AFRICA DEMOLITION TOOLS IN POWER TOOLS MARKET, BY REGION,2018-2027, (USD MILLION)
TABLE 7 MIDDLE EAST AND AFRICA DEMOLITION TOOLS IN POWER TOOLS MARKET, BY TYPE,2018-2027, (USD MILLION)
TABLE 8 MIDDLE EAST AND AFRICA ROUTING TOOLS IN POWER TOOLS MARKET, BY REGION,2018-2027, (USD MILLION)
TABLE 9 MIDDLE EAST AND AFRICA ROUTING TOOLS IN POWER TOOLS MARKET, BY TYPE,2018-2027, (USD MILLION)
TABLE 10 MIDDLE EAST AND AFRICA PORTABLE NIBBLERS IN POWER TOOLS MARKET, BY REGION,2018-2027, (USD MILLION)
TABLE 11 MIDDLE EAST AND AFRICA AIR-POWERED TOOLS IN POWER TOOLS MARKET, BY REGION,2018-2027, (USD MILLION)
TABLE 12 MIDDLE EAST AND AFRICA AIR-POWERED TOOLS IN POWER TOOLS MARKET, BY TYPE,2018-2027, (USD MILLION)
TABLE 13 MIDDLE EAST AND AFRICA MATERIAL REMOVAL TOOLS IN POWER TOOLS MARKET, BY REGION,2018-2027, (USD MILLION)
TABLE 14 MIDDLE EAST AND AFRICA MATERIAL REMOVAL TOOLS IN POWER TOOLS MARKET, BY TYPE,2018-2027, (USD MILLION)
TABLE 15 MIDDLE EAST AND AFRICA GRINDERS IN POWER TOOLS MARKET, BY TYPE,2018-2027, (USD MILLION)
TABLE 16 MIDDLE EAST AND AFRICA ELECTRIC CORDS AND PLUGS IN POWER TOOLS MARKET, BY REGION,2018-2027, (USD MILLION)
TABLE 17 MIDDLE EAST AND AFRICA ACCESSORIES IN POWER TOOLS MARKET, BY REGION,2018-2027, (USD MILLION)
TABLE 18 MIDDLE EAST AND AFRICA OTHERS IN POWER TOOLS MARKET, BY REGION,2018-2027, (USD MILLION)
TABLE 19 MIDDLE EAST AND AFRICA POWER TOOLS MARKET, BY MODE OF OPERATION, MARKET FORECAST 2020-2027 (USD MILLION)
TABLE 20 MIDDLE EAST AND AFRICA ELECTRIC IN POWER TOOLS MARKET, BY REGION,2018-2027, (USD MILLION)
TABLE 21 MIDDLE EAST AND AFRICA ELECTRIC TOOLS IN POWER TOOLS MARKET, BY TYPE,2018-2027, (USD MILLION)
TABLE 22 MIDDLE EAST AND AFRICA LIQUID FUEL TOOL IN POWER TOOLS MARKET, BY REGION,2018-2027, (USD MILLION)
TABLE 23 MIDDLE EAST AND AFRICA HYDRAULIC IN POWER TOOLS MARKET, BY REGION,2018-2027, (USD MILLION)
TABLE 24 MIDDLE EAST AND AFRICA LIQUID FUEL TOOL IN POWER TOOLS MARKET, BY REGION,2018-2027, (USD MILLION)
TABLE 25 MIDDLE EAST AND AFRICA LIQUID FUEL TOOL IN POWER TOOLS MARKET, BY REGION,2018-2027, (USD MILLION)
TABLE 26 MIDDLE EAST AND AFRICA POWER TOOLS MARKET, BY APPLICATION, MARKET FORECAST 2020-2027 (USD MILLION)
TABLE 27 MIDDLE EAST AND AFRICA CONCRETE AND CONSTRUCTION IN POWER TOOLS MARKET, BY REGION,2018-2027, (USD MILLION)
TABLE 28 MIDDLE EAST AND AFRICA WOODWORKING IN POWER TOOLS MARKET, BY REGION,2018-2027, (USD MILLION)
TABLE 29 MIDDLE EAST AND AFRICA METALWORKING IN POWER TOOLS MARKET, BY REGION,2018-2027, (USD MILLION)
TABLE 30 MIDDLE EAST AND AFRICA WELDING IN POWER TOOLS MARKET, BY REGION,2018-2027, (USD MILLION)
TABLE 31 MIDDLE EAST AND AFRICA OTHERS IN POWER TOOLS MARKET, BY REGION,2018-2027, (USD MILLION)
TABLE 32 MIDDLE EAST AND AFRICA POWER TOOLS MARKET, BY MATERIAL, MARKET FORECAST 2020-2027 (USD MILLION)
TABLE 33 MIDDLE EAST AND AFRICA CONCRETE IN POWER TOOLS MARKET, BY REGION,2018-2027, (USD MILLION)
TABLE 34 MIDDLE EAST AND AFRICA WOOD/METAL IN POWER TOOLS MARKET, BY REGION,2018-2027, (USD MILLION)
TABLE 35 MIDDLE EAST AND AFRICA BRICK/BLOCK IN POWER TOOLS MARKET, BY REGION,2018-2027, (USD MILLION)
TABLE 36 MIDDLE EAST AND AFRICA GLASS IN POWER TOOLS MARKET, BY REGION,2018-2027, (USD MILLION)
TABLE 37 MIDDLE EAST AND AFRICA OTHERS IN POWER TOOLS MARKET, BY REGION,2018-2027, (USD MILLION)
TABLE 38 MIDDLE EAST AND AFRICA POWER TOOLS MARKET, BY END USER, MARKET FORECAST 2020-2027 (USD MILLION)
TABLE 39 MIDDLE EAST AND AFRICA AUTOMOTIVE LOAN IN POWER TOOLS MARKET, BY REGION,2018-2027, (USD MILLION)
TABLE 40 MIDDLE EAST AND AFRICA INDUSTRIAL/PROFESSIONAL IN POWER TOOLS MARKET, BY TYPE,2018-2027, (USD MILLION)
TABLE 41 MIDDLE EAST AND AFRICA INDUSTRIAL/PROFESSIONAL IN POWER TOOLS MARKET, BY MODE OF OPERATION,2018-2027, (USD MILLION)
TABLE 42 MIDDLE EAST AND AFRICA RESIDENTIAL IN POWER TOOLS MARKET, BY REGION,2018-2027, (USD MILLION)
TABLE 43 MIDDLE EAST AND AFRICA RESIDENTIAL IN POWER TOOLS MARKET, BY MODE OF OPERATION,2018-2027, (USD MILLION)
TABLE 44 MIDDLE EAST AND AFRICA POWER TOOLS MARKET, BY SALES CHANNEL, MARKET FORECAST 2020-2027 (USD MILLION)
TABLE 45 MIDDLE EAST AND AFRICA INDIRECT SALES IN POWER TOOLS MARKET, BY REGION,2018-2027, (USD MILLION)
TABLE 46 MIDDLE EAST AND AFRICA DIRECT SALES IN POWER TOOLS MARKET, BY REGION,2018-2027, (USD MILLION)
TABLE 47 MIDDLE EAST AND AFRICA POWER TOOLS MARKET, BY COUNTRY, 2018-2027 (USD MILLION)
TABLE 48 MIDDLE EAST AND AFRICA POWER TOOLS MARKET, BY TYPE, 2018-2027 (USD MILLION)
TABLE 49 MIDDLE EAST AND AFRICA SAWING AND CUTTING TOOLS IN POWER TOOLS MARKET, BY TYPE, 2018-2027 (USD MILLION)
TABLE 50 MIDDLE EAST AND AFRICA DRILLING AND FASTENING TOOLS IN POWER TOOLS MARKET, BY TYPE, 2018-2027 (USD MILLION)
TABLE 51 MIDDLE EAST AND AFRICA DEMOLITION TOOLS IN POWER TOOLS MARKET, BY TYPE, 2018-2027 (USD MILLION)
TABLE 52 MIDDLE EAST AND AFRICA ROUTING TOOLS IN POWER TOOLS MARKET, BY TYPE, 2018-2027 (USD MILLION)
TABLE 53 MIDDLE EAST AND AFRICA AIR-POWERED TOOLS IN POWER TOOLS MARKET, BY TYPE, 2018-2027 (USD MILLION)
TABLE 54 MIDDLE EAST AND AFRICA MATERIAL REMOVAL TOOLS IN POWER TOOLS MARKET, BY TYPE, 2018-2027 (USD MILLION)
TABLE 55 MIDDLE EAST AND AFRICA GRINDERS IN POWER TOOLS MARKET, BY TYPE, 2018-2027 (USD MILLION)
TABLE 56 MIDDLE EAST AND AFRICA POWER TOOLS MARKET, BY MODE OF OPERATION, 2018-2027 (USD MILLION)
TABLE 57 MIDDLE EAST AND AFRICA ELECTRIC IN POWER TOOLS MARKET, BY MODE OF OPERATION, 2018-2027 (USD MILLION)
TABLE 58 MIDDLE EAST AND AFRICA POWER TOOLS MARKET, BY APPLICATION, 2018-2027 (USD MILLION)
TABLE 59 MIDDLE EAST AND AFRICA POWER TOOLS MARKET, BY MATERIAL, 2018-2027 (USD MILLION)
TABLE 60 MIDDLE EAST AND AFRICA POWER TOOLS MARKET, BY END USER, 2018-2027 (USD MILLION)
TABLE 61 MIDDLE EAST AND AFRICA INDUSTRIAL/PROFESSIONAL IN POWER TOOLS MARKET, BY TYPE, 2018-2027 (USD MILLION)
TABLE 62 MIDDLE EAST AND AFRICA INDUSTRIAL/PROFESSIONAL IN POWER TOOLS MARKET, BY MODE OF OPERATION, 2018-2027 (USD MILLION)
TABLE 63 MIDDLE EAST AND AFRICA RESIDENTIAL IN POWER TOOLS MARKET, BY MODE OF OPERATION, 2018-2027 (USD MILLION)
TABLE 64 MIDDLE EAST AND AFRICA POWER TOOLS MARKET, BY SALES CHANNEL, 2018-2027 (USD MILLION)
TABLE 65 ISRAEL POWER TOOLS MARKET, BY TYPE, 2018-2027 (USD MILLION)
TABLE 66 ISRAEL SAWING AND CUTTING TOOLS IN POWER TOOLS MARKET, BY TYPE, 2018-2027 (USD MILLION)
TABLE 67 ISRAEL DRILLING AND FASTENING TOOLS IN POWER TOOLS MARKET, BY TYPE, 2018-2027 (USD MILLION)
TABLE 68 ISRAEL DEMOLITION TOOLS IN POWER TOOLS MARKET, BY TYPE, 2018-2027 (USD MILLION)
TABLE 69 ISRAEL ROUTING TOOLS IN POWER TOOLS MARKET, BY TYPE, 2018-2027 (USD MILLION)
TABLE 70 ISRAEL AIR-POWERED TOOLS IN POWER TOOLS MARKET, BY TYPE, 2018-2027 (USD MILLION)
TABLE 71 ISRAEL MATERIAL REMOVAL TOOLS IN POWER TOOLS MARKET, BY TYPE, 2018-2027 (USD MILLION)
TABLE 72 ISRAEL GRINDERS IN POWER TOOLS MARKET, BY TYPE, 2018-2027 (USD MILLION)
TABLE 73 ISRAEL POWER TOOLS MARKET, BY MODE OF OPERATION, 2018-2027 (USD MILLION)
TABLE 74 ISRAEL ELECTRIC IN POWER TOOLS MARKET, BY MODE OF OPERATION, 2018-2027 (USD MILLION)
TABLE 75 ISRAEL POWER TOOLS MARKET, BY APPLICATION, 2018-2027 (USD MILLION)
TABLE 76 ISRAEL POWER TOOLS MARKET, BY MATERIAL, 2018-2027 (USD MILLION)
TABLE 77 ISRAEL POWER TOOLS MARKET, BY END USER, 2018-2027 (USD MILLION)
TABLE 78 ISRAEL INDUSTRIAL/PROFESSIONAL IN POWER TOOLS MARKET, BY TYPE, 2018-2027 (USD MILLION)
TABLE 79 ISRAEL INDUSTRIAL/PROFESSIONAL IN POWER TOOLS MARKET, BY MODE OF OPERATION, 2018-2027 (USD MILLION)
TABLE 80 ISRAEL RESIDENTIAL IN POWER TOOLS MARKET, BY MODE OF OPERATION, 2018-2027 (USD MILLION)
TABLE 81 ISRAEL POWER TOOLS MARKET, BY SALES CHANNEL, 2018-2027 (USD MILLION)
TABLE 82 SAUDI ARABIA POWER TOOLS MARKET, BY TYPE, 2018-2027 (USD MILLION)
TABLE 83 SAUDI ARABIA SAWING AND CUTTING TOOLS IN POWER TOOLS MARKET, BY TYPE, 2018-2027 (USD MILLION)
TABLE 84 SAUDI ARABIA DRILLING AND FASTENING TOOLS IN POWER TOOLS MARKET, BY TYPE, 2018-2027 (USD MILLION)
TABLE 85 SAUDI ARABIA DEMOLITION TOOLS IN POWER TOOLS MARKET, BY TYPE, 2018-2027 (USD MILLION)
TABLE 86 SAUDI ARABIA ROUTING TOOLS IN POWER TOOLS MARKET, BY TYPE, 2018-2027 (USD MILLION)
TABLE 87 SAUDI ARABIA AIR-POWERED TOOLS IN POWER TOOLS MARKET, BY TYPE, 2018-2027 (USD MILLION)
TABLE 88 SAUDI ARABIA MATERIAL REMOVAL TOOLS IN POWER TOOLS MARKET, BY TYPE, 2018-2027 (USD MILLION)
TABLE 89 SAUDI ARABIA GRINDERS IN POWER TOOLS MARKET, BY TYPE, 2018-2027 (USD MILLION)
TABLE 90 SAUDI ARABIA POWER TOOLS MARKET, BY MODE OF OPERATION, 2018-2027 (USD MILLION)
TABLE 91 SAUDI ARABIA ELECTRIC IN POWER TOOLS MARKET, BY MODE OF OPERATION, 2018-2027 (USD MILLION)
TABLE 92 SAUDI ARABIA POWER TOOLS MARKET, BY APPLICATION, 2018-2027 (USD MILLION)
TABLE 93 SAUDI ARABIA POWER TOOLS MARKET, BY MATERIAL, 2018-2027 (USD MILLION)
TABLE 94 SAUDI ARABIA POWER TOOLS MARKET, BY END USER, 2018-2027 (USD MILLION)
TABLE 95 SAUDI ARABIA INDUSTRIAL/PROFESSIONAL IN POWER TOOLS MARKET, BY TYPE, 2018-2027 (USD MILLION)
TABLE 96 SAUDI ARABIA INDUSTRIAL/PROFESSIONAL IN POWER TOOLS MARKET, BY MODE OF OPERATION, 2018-2027 (USD MILLION)
TABLE 97 SAUDI ARABIA RESIDENTIAL IN POWER TOOLS MARKET, BY MODE OF OPERATION, 2018-2027 (USD MILLION)
TABLE 98 SAUDI ARABIA POWER TOOLS MARKET, BY SALES CHANNEL, 2018-2027 (USD MILLION)
TABLE 99 SOUTH AFRICA POWER TOOLS MARKET, BY TYPE, 2018-2027 (USD MILLION)
TABLE 100 SOUTH AFRICA SAWING AND CUTTING TOOLS IN POWER TOOLS MARKET, BY TYPE, 2018-2027 (USD MILLION)
TABLE 101 SOUTH AFRICA DRILLING AND FASTENING TOOLS IN POWER TOOLS MARKET, BY TYPE, 2018-2027 (USD MILLION)
TABLE 102 SOUTH AFRICA DEMOLITION TOOLS IN POWER TOOLS MARKET, BY TYPE, 2018-2027 (USD MILLION)
TABLE 103 SOUTH AFRICA ROUTING TOOLS IN POWER TOOLS MARKET, BY TYPE, 2018-2027 (USD MILLION)
TABLE 104 SOUTH AFRICA AIR-POWERED TOOLS IN POWER TOOLS MARKET, BY TYPE, 2018-2027 (USD MILLION)
TABLE 105 SOUTH AFRICA MATERIAL REMOVAL TOOLS IN POWER TOOLS MARKET, BY TYPE, 2018-2027 (USD MILLION)
TABLE 106 SOUTH AFRICA GRINDERS IN POWER TOOLS MARKET, BY TYPE, 2018-2027 (USD MILLION)
TABLE 107 SOUTH AFRICA POWER TOOLS MARKET, BY MODE OF OPERATION, 2018-2027 (USD MILLION)
TABLE 108 SOUTH AFRICA ELECTRIC IN POWER TOOLS MARKET, BY MODE OF OPERATION, 2018-2027 (USD MILLION)
TABLE 109 SOUTH AFRICA POWER TOOLS MARKET, BY APPLICATION, 2018-2027 (USD MILLION)
TABLE 110 SOUTH AFRICA POWER TOOLS MARKET, BY MATERIAL, 2018-2027 (USD MILLION)
TABLE 111 SOUTH AFRICA POWER TOOLS MARKET, BY END USER, 2018-2027 (USD MILLION)
TABLE 112 SOUTH AFRICA INDUSTRIAL/PROFESSIONAL IN POWER TOOLS MARKET, BY TYPE, 2018-2027 (USD MILLION)
TABLE 113 SOUTH AFRICA INDUSTRIAL/PROFESSIONAL IN POWER TOOLS MARKET, BY MODE OF OPERATION, 2018-2027 (USD MILLION)
TABLE 114 SOUTH AFRICA RESIDENTIAL IN POWER TOOLS MARKET, BY MODE OF OPERATION, 2018-2027 (USD MILLION)
TABLE 115 SOUTH AFRICA POWER TOOLS MARKET, BY SALES CHANNEL, 2018-2027 (USD MILLION)
TABLE 116 U.A.E. POWER TOOLS MARKET, BY TYPE, 2018-2027 (USD MILLION)
TABLE 117 U.A.E. SAWING AND CUTTING TOOLS IN POWER TOOLS MARKET, BY TYPE, 2018-2027 (USD MILLION)
TABLE 118 U.A.E. DRILLING AND FASTENING TOOLS IN POWER TOOLS MARKET, BY TYPE, 2018-2027 (USD MILLION)
TABLE 119 U.A.E. DEMOLITION TOOLS IN POWER TOOLS MARKET, BY TYPE, 2018-2027 (USD MILLION)
TABLE 120 U.A.E. ROUTING TOOLS IN POWER TOOLS MARKET, BY TYPE, 2018-2027 (USD MILLION)
TABLE 121 U.A.E. AIR-POWERED TOOLS IN POWER TOOLS MARKET, BY TYPE, 2018-2027 (USD MILLION)
TABLE 122 U.A.E. MATERIAL REMOVAL TOOLS IN POWER TOOLS MARKET, BY TYPE, 2018-2027 (USD MILLION)
TABLE 123 U.A.E. GRINDERS IN POWER TOOLS MARKET, BY TYPE, 2018-2027 (USD MILLION)
TABLE 124 U.A.E. POWER TOOLS MARKET, BY MODE OF OPERATION, 2018-2027 (USD MILLION)
TABLE 125 U.A.E. ELECTRIC IN POWER TOOLS MARKET, BY MODE OF OPERATION, 2018-2027 (USD MILLION)
TABLE 126 U.A.E. POWER TOOLS MARKET, BY APPLICATION, 2018-2027 (USD MILLION)
TABLE 127 U.A.E. POWER TOOLS MARKET, BY MATERIAL, 2018-2027 (USD MILLION)
TABLE 128 U.A.E. POWER TOOLS MARKET, BY END USER, 2018-2027 (USD MILLION)
TABLE 129 U.A.E. INDUSTRIAL/PROFESSIONAL IN POWER TOOLS MARKET, BY TYPE, 2018-2027 (USD MILLION)
TABLE 130 U.A.E. INDUSTRIAL/PROFESSIONAL IN POWER TOOLS MARKET, BY MODE OF OPERATION, 2018-2027 (USD MILLION)
TABLE 131 U.A.E. RESIDENTIAL IN POWER TOOLS MARKET, BY MODE OF OPERATION, 2018-2027 (USD MILLION)
TABLE 132 U.A.E. POWER TOOLS MARKET, BY SALES CHANNEL, 2018-2027 (USD MILLION)
TABLE 133 EGYPT POWER TOOLS MARKET, BY TYPE, 2018-2027 (USD MILLION)
TABLE 134 EGYPT SAWING AND CUTTING TOOLS IN POWER TOOLS MARKET, BY TYPE, 2018-2027 (USD MILLION)
TABLE 135 EGYPT DRILLING AND FASTENING TOOLS IN POWER TOOLS MARKET, BY TYPE, 2018-2027 (USD MILLION)
TABLE 136 EGYPT DEMOLITION TOOLS IN POWER TOOLS MARKET, BY TYPE, 2018-2027 (USD MILLION)
TABLE 137 EGYPT ROUTING TOOLS IN POWER TOOLS MARKET, BY TYPE, 2018-2027 (USD MILLION)
TABLE 138 EGYPT AIR-POWERED TOOLS IN POWER TOOLS MARKET, BY TYPE, 2018-2027 (USD MILLION)
TABLE 139 EGYPT MATERIAL REMOVAL TOOLS IN POWER TOOLS MARKET, BY TYPE, 2018-2027 (USD MILLION)
TABLE 140 EGYPT GRINDERS IN POWER TOOLS MARKET, BY TYPE, 2018-2027 (USD MILLION)
TABLE 141 EGYPT POWER TOOLS MARKET, BY MODE OF OPERATION, 2018-2027 (USD MILLION)
TABLE 142 EGYPT ELECTRIC IN POWER TOOLS MARKET, BY MODE OF OPERATION, 2018-2027 (USD MILLION)
TABLE 143 EGYPT POWER TOOLS MARKET, BY APPLICATION, 2018-2027 (USD MILLION)
TABLE 144 EGYPT POWER TOOLS MARKET, BY MATERIAL, 2018-2027 (USD MILLION)
TABLE 145 EGYPT POWER TOOLS MARKET, BY END USER, 2018-2027 (USD MILLION)
TABLE 146 EGYPT INDUSTRIAL/PROFESSIONAL IN POWER TOOLS MARKET, BY TYPE, 2018-2027 (USD MILLION)
TABLE 147 EGYPT INDUSTRIAL/PROFESSIONAL IN POWER TOOLS MARKET, BY MODE OF OPERATION, 2018-2027 (USD MILLION)
TABLE 148 EGYPT RESIDENTIAL IN POWER TOOLS MARKET, BY MODE OF OPERATION, 2018-2027 (USD MILLION)
TABLE 149 EGYPT POWER TOOLS MARKET, BY SALES CHANNEL, 2018-2027 (USD MILLION)
TABLE 150 REST OF MIDDLE EAST AND AFRICA POWER TOOLS MARKET, BY TYPE, 2018-2027 (USD MILLION)
List of Figure
LIST OF FIGURES
FIGURE 1 MIDDLE EAST AND AFRICA POWER TOOLS MARKET: SEGMENTATION
FIGURE 2 MIDDLE EAST AND AFRICA POWER TOOLS MARKET: DATA TRIANGULATION
FIGURE 3 MIDDLE EAST AND AFRICA POWER TOOLS MARKET: DROC ANALYSIS
FIGURE 4 MIDDLE EAST AND AFRICA POWER TOOLS MARKET: MIDDLE EAST AND AFRICA VS REGIONAL MARKET ANALYSIS
FIGURE 5 MIDDLE EAST AND AFRICA POWER TOOLS MARKET: COMPANY RESEARCH ANALYSIS
FIGURE 6 MIDDLE EAST AND AFRICA POWER TOOLS MARKET: INTERVIEW DEMOGRAPHICS
FIGURE 7 MIDDLE EAST AND AFRICA POWER TOOLS MARKET: DBMR MARKET POSITION GRID
FIGURE 8 MIDDLE EAST AND AFRICA POWER TOOLS MARKET: VENDOR SHARE ANALYSIS
FIGURE 9 MIDDLE EAST AND AFRICA POWER TOOLS MARKET: MARKET APPLICATION COVERAGE GRID
FIGURE 10 MIDDLE EAST AND AFRICA POWER TOOLS MARKET: SEGMENTATION
FIGURE 11 INCREASE IN THE GROWTH OF CORDLESS POWER TOOLS IS EXPECTED TO DRIVE MIDDLE EAST AND AFRICA POWER TOOLS MARKET IN THE FORECAST PERIOD OF 2020 TO 2027
FIGURE 12 SAWING AND CUTTING TOOLS SEGMENT IS EXPECTED TO ACCOUNT FOR THE LARGEST SHARE OF MIDDLE EAST AND AFRICA POWER TOOLS MARKET IN 2020 & 2027
FIGURE 13 DRIVERS, RESTRAINTS, OPPORTUNITIES AND CHALLENGES OF MIDDLE EAST AND AFRICA POWER TOOLS MARKET
FIGURE 14 MIDDLE EAST AND AFRICA POWER TOOLS MARKET: BY TYPE, 2019
FIGURE 15 MIDDLE EAST AND AFRICA POWER TOOLS MARKET: BY MODE OF OPERATION, 2019
FIGURE 16 MIDDLE EAST AND AFRICA POWER TOOLS MARKET: BY APPLICATION, 2019
FIGURE 17 MIDDLE EAST AND AFRICA POWER TOOLS MARKET: BY MATERIAL, 2019
FIGURE 18 MIDDLE EAST AND AFRICA POWER TOOLS MARKET: BY END USER, 2019
FIGURE 19 MIDDLE EAST AND AFRICA POWER TOOLS MARKET: BY SALES CHANNEL, 2019
FIGURE 20 MIDDLE EAST AND AFRICA POWER TOOLS MARKET: SNAPSHOT (2019)
FIGURE 21 MIDDLE EAST AND AFRICA POWER TOOLS MARKET: BY COUNTRY (2019)
FIGURE 22 MIDDLE EAST AND AFRICA POWER TOOLS MARKET: BY COUNTRY (2020 & 2027)
FIGURE 23 MIDDLE EAST AND AFRICA POWER TOOLS MARKET: BY COUNTRY (2019 & 2027)
FIGURE 24 MIDDLE EAST AND AFRICA POWER TOOLS MARKET: BY TYPE (2020-2027)
FIGURE 25 MIDDLE EAST AND AFRICA POWER TOOLS MARKET: COMPANY SHARE 2019 (%)
Middle East And Africa Power Tools Market, Supply Chain Analysis and Ecosystem Framework
To support market growth and help clients navigate the impact of geopolitical shifts, DBMR has integrated in-depth supply chain analysis into its Middle East And Africa Power Tools Market research reports. This addition empowers clients to respond effectively to global changes affecting their industries. The supply chain analysis section includes detailed insights such as Middle East And Africa Power Tools Market consumption and production by country, price trend analysis, the impact of tariffs and geopolitical developments, and import and export trends by country and HSN code. It also highlights major suppliers with data on production capacity and company profiles, as well as key importers and exporters. In addition to research, DBMR offers specialized supply chain consulting services backed by over a decade of experience, providing solutions like supplier discovery, supplier risk assessment, price trend analysis, impact evaluation of inflation and trade route changes, and comprehensive market trend analysis.
Data collection and base year analysis are done using data collection modules with large sample sizes. The stage includes obtaining market information or related data through various sources and strategies. It includes examining and planning all the data acquired from the past in advance. It likewise envelops the examination of information inconsistencies seen across different information sources. The market data is analysed and estimated using market statistical and coherent models. Also, market share analysis and key trend analysis are the major success factors in the market report. To know more, please request an analyst call or drop down your inquiry.
The key research methodology used by DBMR research team is data triangulation which involves data mining, analysis of the impact of data variables on the market and primary (industry expert) validation. Data models include Vendor Positioning Grid, Market Time Line Analysis, Market Overview and Guide, Company Positioning Grid, Patent Analysis, Pricing Analysis, Company Market Share Analysis, Standards of Measurement, Global versus Regional and Vendor Share Analysis. To know more about the research methodology, drop in an inquiry to speak to our industry experts.
Data Bridge Market Research is a leader in advanced formative research. We take pride in servicing our existing and new customers with data and analysis that match and suits their goal. The report can be customized to include price trend analysis of target brands understanding the market for additional countries (ask for the list of countries), clinical trial results data, literature review, refurbished market and product base analysis. Market analysis of target competitors can be analyzed from technology-based analysis to market portfolio strategies. We can add as many competitors that you require data about in the format and data style you are looking for. Our team of analysts can also provide you data in crude raw excel files pivot tables (Fact book) or can assist you in creating presentations from the data sets available in the report.


