
Market Analysis and Insights: North America Cosmetics Market
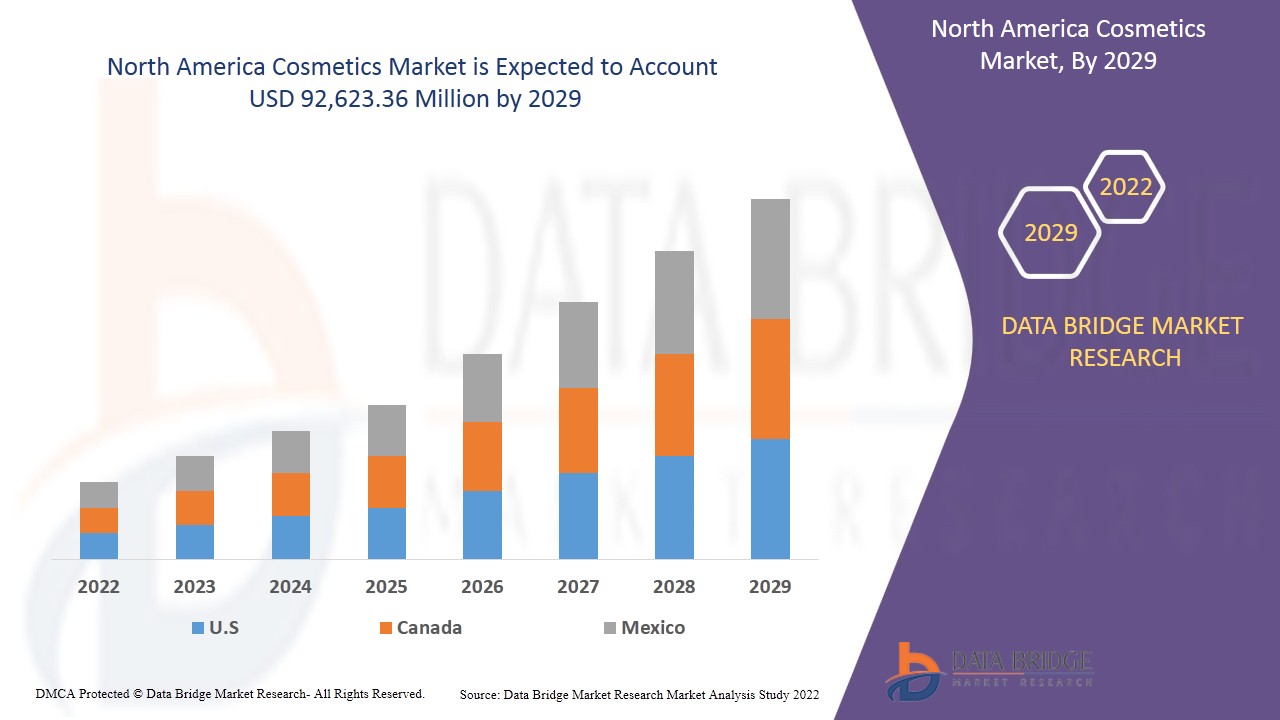
North America cosmetics market is expected to gain significant growth in the forecast period of 2022 to 2029. Data Bridge Market Research analyzes that the market is growing with the CAGR of 5.7% in the forecast period of 2022 to 2029 and expected to reach USD 92,623.36 million by 2029.
Cosmetics are used to enhance the beauty and physical appearance of a personage. Chiefly, these cosmetic products are manufactured from artificial sources. The purpose of cosmetic products is mainly intended for external cleaning, perfumes, changing appearances, correct body odor, protect skin, and conditioning among others. Ranging from antiperspirants, fragrances, make-up, and shampoos, to soaps, sunscreens, and toothpastes, cosmetics and personal care products play an essential role in in all stages of a consumer’s life.
Major factors driving the growth of the North America cosmetics market are rising awareness regarding skin care routine, innovative product branding and advertising strategies. Increasing developments in sustainable cosmetics are creating opportunities for the growth of the market. However, growing awareness regarding side effects of synthetic chemicals is acting as a major restraint for the market growth. Increasing movement across consumers for transparency and traceability of ingredients used in products are acting as a major challenge for the growth of the market.
The North America cosmetics market report provides details of market share, new developments, and product pipeline analysis, impact of domestic and localized market players, analyses opportunities in terms of emerging revenue pockets, changes in market regulations, product approvals, strategic decisions, product launches, geographical expansions, and technological innovations in the market. To understand the analysis and the market scenario contact us for an Analyst Brief, our team will help you create a revenue impact solution to achieve your desired goal.
North America Cosmetics Market Scope and Market Size
North America cosmetics market is segmented on the basis of are product type, nature, category, packaging type, distribution channel and application. The growth among segments helps you analyze niche pockets of growth and strategies to approach the market and determine your core application areas and the difference in your target markets.
- On the basis of product type, the North America cosmetics market is segmented into skin care, hair care, fragrances, make up, and others. In 2022, the skin care segment is expected to dominate the market as the consumers are becoming more concern for their healthy skin. Social media has also played an important role in advertising of skincare brands. Moreover, with increasing growth in organic products consumers are more confident in applying natural products to their skin for better results.
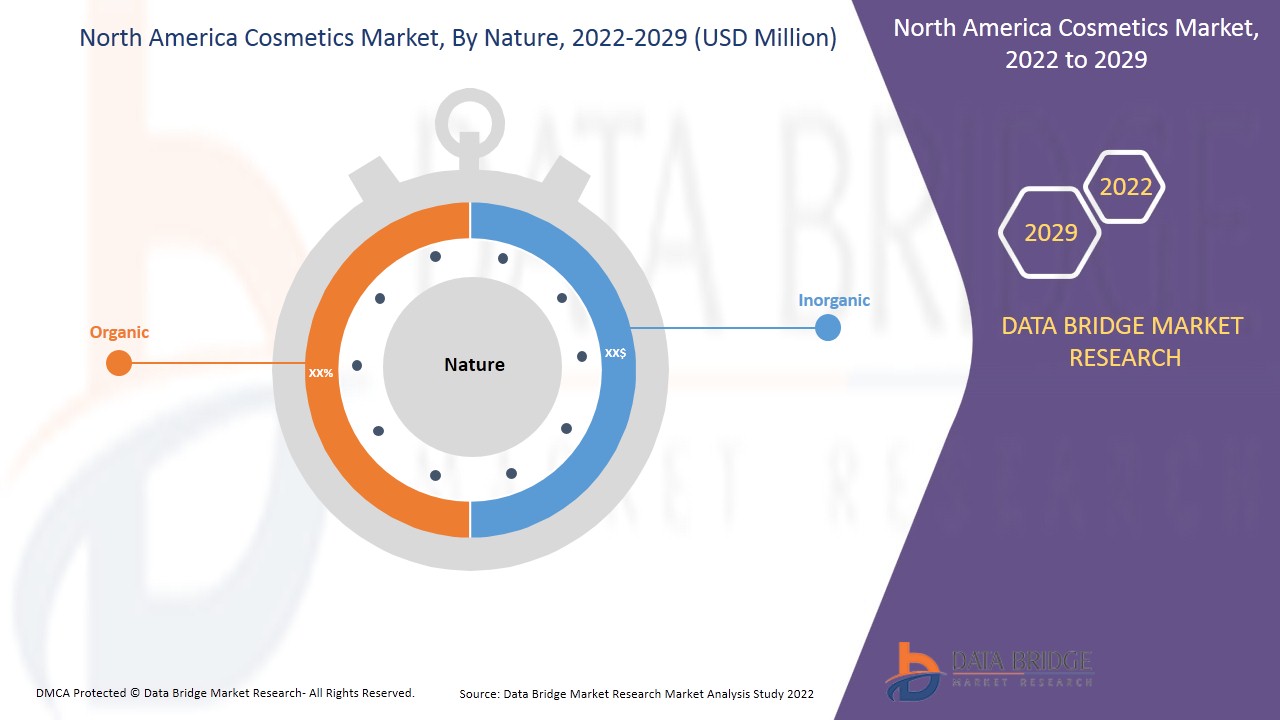
- On the basis of nature, the North America cosmetics market is segmented into organic and inorganic. In 2022, inorganic segment is expected to dominate the market as these products are highly affective. Hair colors, anti-acne creams, anti-wrinkle creams and various other products are manufactured with inorganic ingredients to enhance their outcome.
- On the basis of category, the North America cosmetics market is segmented into mass product, premium product, and professional product. In 2022, mass product segment is expected to dominate the market due to presence of wide product range, distribution network and affordable prices. The cosmetic products are being manufactured in mass due to increasing demand in market.
- On the basis of packaging type, the North America cosmetics market is segmented into bottles and jars, tubes, containers, pouches, sticks, pumps & dispensers, blisters and strip packs, and aerosol cans. In 2022, bottles and jars segment is expected to dominate the market as large portion of products are usually packaged in either a jar or bottle. Jars are good for products that may not pour well or that a customer may not want to buy in large portions, as jars come in a wide array of sizes. Bottles are good for liquid products that consumer want to be dispensed by a certain method (pump, sprayer) and want larger volumes of.
- On the basis of distribution channel, the North America cosmetics market is segmented into offline and online. In 2022, offline segment is expected to dominate the market as it is a traditional form of distribution channel focusing on bricks and mortar, with its sales through supermarkets, specialty stores, pharmacies, and salons. The customers can get a wide range of options, suggestions and samples through these stores that improve their decision making.
- On the basis of application, the North America cosmetics market is segmented into women and men. In 2022, women segment is expected to dominate the market as the cosmetic market is highly women centric with a wide range of products available for women beauty. Moreover, with increasing use of social media the demand of beauty products has increased among women.
North America Cosmetics Market Country Level Analysis
North America cosmetics market is analyzed and market size information is provided by the country, product type, nature, category, packaging type, distribution channel, and application.
The countries covered in North America cosmetics market report are the U.S., Canada and Mexico.
The U.S. accounted for maximum share in the North America cosmetics market owing to factors such as presence of large number of companies providing cosmetics.
The country section of the North America cosmetics market report also provides individual market impacting factors and changes in regulation in the market domestically that impacts the current and future trends of the market. Data points such as new sales, replacement sales, country demographics, regulatory acts and import-export analysis are some of the major pointers used to forecast the market scenario for individual countries. Also, presence and availability of North America brands and their challenges faced due to large or scarce competition from local and domestic brands, impact of sales channels are considered while providing forecast analysis of the country data.
Increasing Adoption of Cosmetics to Drive Market Growth
The North America cosmetics market also provides you with detailed market analysis for every country growth in installed base of different kind of products for North America cosmetics market, impact of technology using life line curves and changes in requirement of abrasives products, regulatory scenarios and their impact on the cosmetics market. The data is available for historic period 2012 to 2020.
Competitive Landscape and North America Cosmetics Market Share Analysis
The North America cosmetics market competitive landscape provides details by competitor. Details included are company overview, company financials, revenue generated, market potential, investment in research and development, new market initiatives, North America presence, production sites and facilities, company strengths and weaknesses, product launch, clinical trials pipelines, brand analysis, product approvals, patents, product width and breadth, application dominance, and technology lifeline curve. The above data points provided are only related to the companies’ focus related to North America cosmetics market.
Some of the major players operating in the North America cosmetics market report are Procter & Gamble, L'Oreal S.A., The Estee Lauder Companies Inc., Coty Inc., Shiseido Company, Limited, Colgate-Palmolive Company, Kao Corporation, Beiersdorf Group, Unilever, Amorepacific, Johnson & Johnson Services, Inc., Revlon, Inc., LMVH, Oriflame Cosmetics Global SA, Espa, Henkel AG & Co. KGaA, Mary Kay, Natura&Co, CHANEL, KOSÉ Corporation among others. DBMR analysts understand competitive strengths and provide competitive analysis for each competitor separately.
For instance,
- In September 2021, Unilever launched the Positive Beauty Growth Platform, a new initiative that aims to partner with scaleups and startups to drive innovation and brand growth. The platform aims at inviting new scaleups and startups through a series of pitch competitions. The company, through this platform, aims at harnessing startups’ disruptive approach to future-proof their brands and shaping the beauty industry.
- In November 2021, The Estée Lauder Companies Inc. announced the partnership with Florida A&M University for a new talent and development program to build the next generation of Black beauty leaders in Travel Retail. This development was in line with company’s commitment to Racial Equity. This enabled the company to create an exclusive internship and scholarship program with Florida A&M University.
SKU-

- Interactive Data Analysis Dashboard
- Company Analysis Dashboard for high growth potential opportunities
- Research Analyst Access for customization & queries
- Competitor Analysis with Interactive dashboard
- Latest News, Updates & Trend analysis
- Harness the Power of Benchmark Analysis for Comprehensive Competitor Tracking
Table of Content
1 INTRODUCTION
1.1 OBJECTIVES OF THE STUDY
1.2 MARKET DEFINITION
1.3 OVERVIEW OF NORTH AMERICA COSMETICS MARKET
1.4 CURRENCY AND PRICING
1.5 LIMITATIONS
1.6 MARKETS COVERED
2 MARKET SEGMENTATION
2.1 MARKETS COVERED
2.2 GEOGRAPHICAL SCOPE
2.3 YEARS CONSIDERED FOR THE STUDY
2.4 DBMR TRIPOD DATA VALIDATION MODEL
2.5 PRIMARY INTERVIEWS WITH KEY OPINION LEADERS
2.6 DBMR MARKET POSITION GRID
2.7 VENDOR SHARE ANALYSIS
2.8 APPLICATION COVERAGE GRID
2.9 MULTIVARIATE MODELING
2.1 PRODUCT TYPE TIMELINE CURVE
2.11 SECONDARY SOURCES
2.12 ASSUMPTIONS
3 EXECUTIVE SUMMARY
4 PREMIUM INSIGHTS
4.1 CONSUMER TRENDS AND PREFERENCES
4.2 FACTORS AFFECTING BUYING DECISION
4.3 CONSUMER PRODUCT ADOPTION
4.4 PORTERS FIVE FORCES
5 MARKET OVERVIEW
5.1 DRIVERS
5.1.1 RISING AWARENESS REGARDING SKIN CARE ROUTINE
5.1.2 INNOVATIVE PRODUCT BRANDING AND ADVERTISING STRATEGIES IS FUELLING DEMAND FOR COSMETICS
5.1.3 AVAILABILITY OF CUSTOMIZED BEAUTY & SKINCARE PRODUCTS
5.1.4 CHANGING LIFESTYLE AND INCREASING URBAN POPULATION
5.1.5 SURGE IN E-COMMERCE TO FUEL DEMAND IN COSMETICS PRODUCTS
5.2 RESTRAINTS
5.2.1 AWARENESS REGARDING SIDE EFFECTS DUE TO THE USE OF SYNTHETIC CHEMICALS
5.2.2 INCREASING TRENDS IN PRODUCT RECALLS
5.3 OPPORTUNITIES
5.3.1 INCREASING DEVELOPMENTS IN SUSTAINABLE COSMETICS
5.3.2 INCREASING DEMAND FOR VEGAN BEAUTY PRODUCTS
5.3.3 TECHNOLOGICAL INTEGRATION FOR OFFERING PERSONALISED BEAUTY EXPERIENCE
5.3.4 INCREASING DEMAND FOR COSMETICS AMONG AGING POPULATION
5.4 CHALLENGES
5.4.1 INCREASING MOVEMENT ACROSS CONSUMERS FOR TRANSPARENCY AND TRACEABILITY OF INGREDIENTS USED IN PRODUCTS
5.4.2 ISSUES IN PRODUCT DELIVERY LIFECYCLE ACROSS SUPPLY CHAINS
6 COVID-19 IMPACT ON THE NORTH AMERICA COSMETICS MARKET
6.1 ANALYSIS ON IMPACT OF COVID-19 ON THE MARKET
6.2 AFTERMATH OF COVID-19 AND GOVERNMENT INITIATIVE TO BOOST THE MARKET
6.3 STRATEGIC DECISIONS FOR MANUFACTURERS AFTER COVID-19 TO GAIN COMPETITIVE MARKET SHARE
6.4 IMPACT ON DEMAND
6.5 IMPACT ON SUPPLY CHAIN
6.6 PRICE IMPACT
6.7 CONCLUSION
7 NORTH AMERICA COSMETICS MARKET, BY PRODUCT TYPE
7.1 OVERVIEW
7.2 SKIN CARE
7.2.1 MASKS
7.2.2 MOISTURIZERS
7.2.3 BODY LOTIONS
7.2.4 TONERS
7.2.5 CLEANSING CREAM
7.2.6 FACIAL REMOVER
7.2.7 SUNSCREENS
7.2.8 BODY WASH
7.2.9 NIGHT SERUM
7.2.10 DAY CREAM
7.2.11 HAND & FOOT CREAMS
7.2.12 OTHERS
7.3 HAIR CARE
7.3.1 SHAMPOO
7.3.2 CONDITIONERS
7.3.3 HAIR COLOR
7.3.3.1 BY TYPE
7.3.3.1.1 HAIR DYES AND COLORS
7.3.3.1.2 HAIR BLEACHES
7.3.3.1.3 HAIR TINTS
7.3.3.1.4 OTHERS
7.3.3.2 BY HAIR TYPE
7.3.3.2.1 NORMAL
7.3.3.2.2 OILY
7.3.3.2.3 DRY
7.3.4 SERUMS
7.3.5 OIL
7.3.6 SPRAYS
7.3.7 OTHERS
7.4 MAKE UP
7.4.1 LIPSTICK
7.4.2 EYE SHADOW
7.4.3 MASCARA
7.4.4 FOUNDATION
7.4.5 BRONZER
7.4.6 BLUSH
7.4.7 OTHERS
7.5 FRAGRANCES
7.6 OTHERS
8 NORTH AMERICA COSMETICS MARKET, BY NATURE
8.1 OVERVIEW
8.2 INORGANIC
8.3 ORGANIC
9 NORTH AMERICA COSMETICS MARKET, BY CATEGORY
9.1 OVERVIEW
9.2 MASS PRODUCT
9.3 PREMIUM PRODUCT
9.4 PROFESSIONAL PRODUCT
10 NORTH AMERICA COSMETICS MARKET, BY PACKAGING TYPE
10.1 OVERVIEW
10.2 BOTTLES AND JARS
10.3 TUBES
10.4 CONTAINERS
10.5 PUMPS & DISPENSERS
10.6 STICKS
10.7 AEROSOL CANS
10.8 POUCHES
10.9 BLISTERS & STRIP PACKS
11 NORTH AMERICA COSMETICS MARKET, BY DISTRIBUTION CHANNEL
11.1 OVERVIEW
11.2 OFFLINE
11.2.1 COSMETICS STORES
11.2.2 PHARMACIES
11.2.3 SPECIALITY STORES
11.2.4 SUPERMARKETS/HYPERMARKETS
11.2.5 SALONS
11.2.6 OTHERS
11.3 ONLINE
12 NORTH AMERICA COSMETICS MARKET, BY APPLICATION
12.1 OVERVIEW
12.2 WOMEN
12.2.1 SKIN CARE
12.2.2 HAIR CARE
12.2.3 MAKE UP
12.2.4 FRAGRANCES
12.2.5 OTHERS
12.3 MEN
12.3.1 SKIN CARE
12.3.2 HAIR CARE
12.3.3 FRAGRANCES
12.3.4 MAKE UP
12.3.5 OTHERS
13 NORTH AMERICA COSMETICS MARKET, BY REGION
13.1 NORTH AMERICA
13.1.1 U.S.
13.1.2 CANADA
13.1.3 MEXICO
14 NORTH AMERICA COSMETICS MARKET: COMPANY LANDSCAPE
14.1 COMPANY SHARE ANALYSIS: NORTH AMERICA
15 SWOT ANALYSIS
16 COMPANY PROFILE
16.1 L’ORÉAL S.A.
16.1.1 COMPANY SNAPSHOT
16.1.2 REVENUE ANALYSIS
16.1.3 COMPANY SHARE ANALYSIS
16.1.4 PRODUCT PORTFOLIO
16.1.5 RECENT DEVELOPMENTS
16.2 UNILEVER
16.2.1 COMPANY SNAPSHOT
16.2.2 REVENUE ANALYSIS
16.2.3 COMPANY SHARE ANALYSIS
16.2.4 PRODUCT PORTFOLIO
16.2.5 RECENT DEVELOPMENTS
16.3 THE ESTÉE LAUDER COMPANIES INC.
16.3.1 COMPANY SNAPSHOT
16.3.2 REVENUE ANALYSIS
16.3.3 COMPANY SHARE ANALYSIS
16.3.4 PRODUCT PORTFOLIO
16.3.5 RECENT DEVELOPMENTS
16.4 PROCTER & GAMBLE
16.4.1 COMPANY SNAPSHOT
16.4.2 REVENUE ANALYSIS
16.4.3 COMPANY SHARE ANALYSIS
16.4.4 PRODUCT PORTFOLIO
16.4.5 RECENT DEVELOPMENTS
16.5 LVMH
16.5.1 COMPANY SNAPSHOT
16.5.2 REVENUE ANALYSIS
16.5.3 COMPANY SHARE ANALYSIS
16.5.4 PRODUCT PORTFOLIO
16.5.5 RECENT DEVELOPMENTS
16.6 AMOREPACIFIC
16.6.1 COMPANY SNAPSHOT
16.6.2 REVENUE ANALYSIS
16.6.3 PRODUCT PORTFOLIO
16.6.4 RECENT DEVELOPMENTS
16.7 BEIERSDORF GROUP
16.7.1 COMPANY SNAPSHOT
16.7.2 REVENUE ANALYSIS
16.7.3 PRODUCT PORTFOLIO
16.7.4 RECENT DEVELOPMENTS
16.8 CHANEL
16.8.1 COMPANY SNAPSHOT
16.8.2 PRODUCT PORTFOLIO
16.8.3 RECENT DEVELOPMENTS
16.9 COLGATE-PALMOLIVE COMPANY
16.9.1 COMPANY SNAPSHOT
16.9.2 REVENUE ANALYSIS
16.9.3 PRODUCT PORTFOLIO
16.9.4 RECENT DEVELOPMENTS
16.1 COTY INC.
16.10.1 COMPANY SNAPSHOT
16.10.2 REVENUE ANALYSIS
16.10.3 PRODUCT PORTFOLIO
16.10.4 RECENT DEVELOPMENTS
16.11 ESPA
16.11.1 COMPANY SNAPSHOT
16.11.2 PRODUCT PORTFOLIO
16.11.3 RECENT DEVELOPMENTS
16.12 HENKEL AG & CO. KGAA
16.12.1 COMPANY SNAPSHOT
16.12.2 REVENUE ANALYSIS
16.12.3 PRODUCT PORTFOLIO
16.12.4 RECENT DEVELOPMENTS
16.13 JOHNSON & JOHNSON SERVICES, INC.
16.13.1 COMPANY SNAPSHOT
16.13.2 REVENUE ANALYSIS
16.13.3 PRODUCT PORTFOLIO
16.13.4 RECENT DEVELOPMENTS
16.14 KAO CORPORATION
16.14.1 COMPANY SNAPSHOT
16.14.2 REVENUE ANALYSIS
16.14.3 PRODUCT PORTFOLIO
16.14.4 RECENT DEVELOPMENTS
16.15 KOSÉ CORPORATION
16.15.1 COMPANY SNAPSHOT
16.15.2 REVENUE ANALYSIS
16.15.3 PRODUCT PORTFOLIO
16.15.4 RECENT DEVELOPMENTS
16.16 MARY KAY
16.16.1 COMPANY SNAPSHOT
16.16.2 PRODUCT PORTFOLIO
16.16.3 RECENT DEVELOPMENTS
16.17 NATURA &CO
16.17.1 COMPANY SNAPSHOT
16.17.2 REVENUE ANALYSIS
16.17.3 PRODUCT PORTFOLIO
16.17.4 RECENT DEVELOPMENTS
16.18 ORIFLAME COSMETICS NORTH AMERICA SA
16.18.1 COMPANY SNAPSHOT
16.18.2 PRODUCT PORTFOLIO
16.18.3 RECENT DEVELOPMENTS
16.19 REVLON, INC.
16.19.1 COMPANY SNAPSHOT
16.19.2 REVENUE ANALYSIS
16.19.3 PRODUCT PORTFOLIO
16.19.4 RECENT DEVELOPMENTS
16.2 SHISEIDO COMPANY, LIMITED
16.20.1 COMPANY SNAPSHOT
16.20.2 REVENUE ANALYSIS
16.20.3 PRODUCT PORTFOLIO
16.20.4 RECENT DEVELOPMENTS
17 QUESTIONNAIRE
18 RELATED REPORTS
List of Table
TABLE 1 NORTH AMERICA COSMETICS MARKET, BY PRODUCT TYPE, 2020-2029 (USD MILLION)
TABLE 2 NORTH AMERICA SKIN CARE IN COSMETICS MARKET, BY REGION, 2020-2029 (USD MILLION)
TABLE 3 NORTH AMERICA SKIN CARE IN COSMETICS MARKET, BY TYPE, 2020-2029 (USD MILLION)
TABLE 4 NORTH AMERICA HAIR CARE IN COSMETICS MARKET, BY REGION, 2020-2029 (USD MILLION)
TABLE 5 NORTH AMERICA HAIR CARE IN COSMETICS MARKET, BY TYPE, 2020-2029 (USD MILLION)
TABLE 6 NORTH AMERICA HAIR COLOR IN COSMETICS MARKET, BY TYPE, 2020-2029 (USD MILLION)
TABLE 7 NORTH AMERICA HAIR COLOR IN COSMETICS MARKET, BY HAIR TYPE, 2020-2029 (USD MILLION)
TABLE 8 NORTH AMERICA MAKE UP IN COSMETICS MARKET, BY REGION, 2020-2029 (USD MILLION)
TABLE 9 NORTH AMERICA MAKE UP IN COSMETICS MARKET, BY TYPE, 2020-2029 (USD MILLION)
TABLE 10 NORTH AMERICA FRAGRANCES IN COSMETICS MARKET, BY REGION, 2020-2029 (USD MILLION)
TABLE 11 NORTH AMERICA OTHERS IN COSMETICS MARKET, BY REGION, 2020-2029 (USD MILLION)
TABLE 12 NORTH AMERICA COSMETICS MARKET, BY NATURE, 2020-2029 (USD MILLION)
TABLE 13 NORTH AMERICA INORGANIC IN COSMETICS MARKET, BY REGION, 2020-2029 (USD MILLION)
TABLE 14 NORTH AMERICA ORGANIC IN COSMETICS MARKET, BY REGION, 2020-2029 (USD MILLION)
TABLE 15 NORTH AMERICA COSMETICS MARKET, BY CATEGORY, 2020-2029 (USD MILLION)
TABLE 16 NORTH AMERICA MASS PRODUCT IN COSMETICS MARKET, BY REGION, 2020-2029 (USD MILLION)
TABLE 17 NORTH AMERICA PREMIUM PRODUCT IN COSMETICS MARKET, BY REGION,2020-2029, (USD MILLION)
TABLE 18 NORTH AMERICA PROFESSIONAL PRODUCT IN COSMETICS MARKET, BY REGION, 2020-2029 (USD MILLION)
TABLE 19 NORTH AMERICA COSMETICS MARKET, BY PACKAGING TYPE, 2020-2029 (USD MILLION)
TABLE 20 NORTH AMERICA BOTTLES AND JARS IN COSMETICS MARKET, BY REGION, 2020-2029 (USD MILLION)
TABLE 21 NORTH AMERICA TUBES IN COSMETICS MARKET, BY REGION,2020-2029 (USD MILLION)
TABLE 22 NORTH AMERICA CONTAINERS IN COSMETICS MARKET, BY REGION, 2020-2029 (USD MILLION)
TABLE 23 NORTH AMERICA PUMPS & DISPENSERS IN COSMETICS MARKET, BY REGION, 2020-2029 (USD MILLION)
TABLE 24 NORTH AMERICA STICKS IN COSMETICS MARKET, BY REGION, 2020-2029 (USD MILLION)
TABLE 25 NORTH AMERICA AEROSOL CANS IN COSMETICS MARKET, BY REGION, 2020-2029 (USD MILLION)
TABLE 26 NORTH AMERICA POUCHES IN COSMETICS MARKET, BY REGION, 2020-2029 (USD MILLION)
TABLE 27 NORTH AMERICA BLISTERS AND STRIP PACKS IN COSMETICS MARKET, BY REGION, 2020-2029 (USD MILLION)
TABLE 28 NORTH AMERICA COSMETICS MARKET, BY DISTRIBUTION CHANNEL, 2020-2029 (USD MILLION)
TABLE 29 NORTH AMERICA OFFLINE IN COSMETICS MARKET, BY REGION, 2020-2029 (USD MILLION)
TABLE 30 NORTH AMERICA OFFLINE IN COSMETICS MARKET, BY TYPE, 2020-2029 (USD MILLION)
TABLE 31 NORTH AMERICA ONLINE IN COSMETICS MARKET, BY REGION, 2020-2029 (USD MILLION)
TABLE 32 NORTH AMERICA COSMETICS MARKET, BY APPLICATION, 2020-2029 (USD MILLION)
TABLE 33 NORTH AMERICA WOMEN IN COSMETICS MARKET, BY REGION, 2020-2029 (USD MILLION)
TABLE 34 NORTH AMERICA WOMEN IN COSMETICS MARKET, BY PRODUCT TYPE, 2020-2029 (USD MILLION)
TABLE 35 NORTH AMERICA MEN IN COSMETICS MARKET, BY REGION, 2020-2029 (USD MILLION)
TABLE 36 NORTH AMERICA MEN IN COSMETICS MARKET, BY PRODUCT TYPE, 2020-2029 (USD MILLION)
TABLE 37 NORTH AMERICA COSMETICS MARKET, BY COUNTRY, 2020-2029 (USD MILLION)
TABLE 38 NORTH AMERICA COSMETICS MARKET, BY PRODUCT TYPE, 2020-2029 (USD MILLION)
TABLE 39 NORTH AMERICA SKIN CARE IN COSMETICS MARKET, BY TYPE, 2020-2029 (USD MILLION)
TABLE 40 NORTH AMERICA HAIR CARE IN COSMETICS MARKET, BY TYPE, 2020-2029 (USD MILLION)
TABLE 41 NORTH AMERICA HAIR COLOR IN COSMETICS MARKET, BY TYPE, 2020-2029 (USD MILLION)
TABLE 42 NORTH AMERICA HAIR COLOR IN COSMETICS MARKET, BY HAIR TYPE, 2020-2029 (USD MILLION)
TABLE 43 NORTH AMERICA MAKE UP IN COSMETICS MARKET, BY TYPE, 2020-2029 (USD MILLION)
TABLE 44 NORTH AMERICA COSMETICS MARKET, BY NATURE, 2020-2029 (USD MILLION)
TABLE 45 NORTH AMERICA COSMETICS MARKET, BY CATEGORY, 2020-2029 (USD MILLION)
TABLE 46 NORTH AMERICA COSMETICS MARKET, BY PACKAGING TYPE, 2020-2029 (USD MILLION)
TABLE 47 NORTH AMERICA COSMETICS MARKET, BY DISTRIBUTION CHANNEL, 2020-2029 (USD MILLION)
TABLE 48 NORTH AMERICA OFFLINE IN COSMETICS MARKET, BY TYPE, 2020-2029 (USD MILLION)
TABLE 49 NORTH AMERICA COSMETICS MARKET, BY APPLICATION, 2020-2029 (USD MILLION)
TABLE 50 NORTH AMERICA WOMEN IN COSMETICS MARKET, BY PRODUCT TYPE, 2020-2029 (USD MILLION)
TABLE 51 NORTH AMERICA MEN IN COSMETICS MARKET, BY PRODUCT TYPE, 2020-2029 (USD MILLION)
TABLE 52 U.S. COSMETICS MARKET, BY PRODUCT TYPE, 2020-2029 (USD MILLION)
TABLE 53 U.S. SKIN CARE IN COSMETICS MARKET, BY TYPE, 2020-2029 (USD MILLION)
TABLE 54 U.S. HAIR CARE IN COSMETICS MARKET, BY TYPE, 2020-2029 (USD MILLION)
TABLE 55 U.S. HAIR COLOR IN COSMETICS MARKET, BY TYPE, 2020-2029 (USD MILLION)
TABLE 56 U.S. HAIR COLOR IN COSMETICS MARKET, BY HAIR TYPE, 2020-2029 (USD MILLION)
TABLE 57 U.S. MAKE UP IN COSMETICS MARKET, BY TYPE, 2020-2029 (USD MILLION)
TABLE 58 U.S. COSMETICS MARKET, BY NATURE, 2020-2029 (USD MILLION)
TABLE 59 U.S. COSMETICS MARKET, BY CATEGORY, 2020-2029 (USD MILLION)
TABLE 60 U.S. COSMETICS MARKET, BY PACKAGING TYPE, 2020-2029 (USD MILLION)
TABLE 61 U.S. COSMETICS MARKET, BY DISTRIBUTION CHANNEL, 2020-2029 (USD MILLION)
TABLE 62 U.S. OFFLINE IN COSMETICS MARKET, BY TYPE, 2020-2029 (USD MILLION)
TABLE 63 U.S. COSMETICS MARKET, BY APPLICATION, 2020-2029 (USD MILLION)
TABLE 64 U.S. WOMEN IN COSMETICS MARKET, BY PRODUCT TYPE, 2020-2029 (USD MILLION)
TABLE 65 U.S. MEN IN COSMETICS MARKET, BY PRODUCT TYPE, 2020-2029 (USD MILLION)
TABLE 66 CANADA COSMETICS MARKET, BY PRODUCT TYPE, 2020-2029 (USD MILLION)
TABLE 67 CANADA SKIN CARE IN COSMETICS MARKET, BY TYPE, 2020-2029 (USD MILLION)
TABLE 68 CANADA HAIR CARE IN COSMETICS MARKET, BY TYPE, 2020-2029 (USD MILLION)
TABLE 69 CANADA HAIR COLOR IN COSMETICS MARKET, BY TYPE, 2020-2029 (USD MILLION)
TABLE 70 CANADA HAIR COLOR IN COSMETICS MARKET, BY HAIR TYPE, 2020-2029 (USD MILLION)
TABLE 71 CANADA MAKE UP IN COSMETICS MARKET, BY TYPE, 2020-2029 (USD MILLION)
TABLE 72 CANADA COSMETICS MARKET, BY NATURE, 2020-2029 (USD MILLION)
TABLE 73 CANADA COSMETICS MARKET, BY CATEGORY, 2020-2029 (USD MILLION)
TABLE 74 CANADA COSMETICS MARKET, BY PACKAGING TYPE, 2020-2029 (USD MILLION)
TABLE 75 CANADA COSMETICS MARKET, BY DISTRIBUTION CHANNEL, 2020-2029 (USD MILLION)
TABLE 76 CANADA OFFLINE IN COSMETICS MARKET, BY TYPE, 2020-2029 (USD MILLION)
TABLE 77 CANADA COSMETICS MARKET, BY APPLICATION, 2020-2029 (USD MILLION)
TABLE 78 CANADA WOMEN IN COSMETICS MARKET, BY PRODUCT TYPE, 2020-2029 (USD MILLION)
TABLE 79 CANADA MEN IN COSMETICS MARKET, BY PRODUCT TYPE, 2020-2029 (USD MILLION)
TABLE 80 MEXICO COSMETICS MARKET, BY PRODUCT TYPE, 2020-2029 (USD MILLION)
TABLE 81 MEXICO SKIN CARE IN COSMETICS MARKET, BY TYPE, 2020-2029 (USD MILLION)
TABLE 82 MEXICO HAIR CARE IN COSMETICS MARKET, BY TYPE, 2020-2029 (USD MILLION)
TABLE 83 MEXICO HAIR COLOR IN COSMETICS MARKET, BY TYPE, 2020-2029 (USD MILLION)
TABLE 84 MEXICO HAIR COLOR IN COSMETICS MARKET, BY HAIR TYPE, 2020-2029 (USD MILLION)
TABLE 85 MEXICO MAKE UP IN COSMETICS MARKET, BY TYPE, 2020-2029 (USD MILLION)
TABLE 86 MEXICO COSMETICS MARKET, BY NATURE, 2020-2029 (USD MILLION)
TABLE 87 MEXICO COSMETICS MARKET, BY CATEGORY, 2020-2029 (USD MILLION)
TABLE 88 MEXICO COSMETICS MARKET, BY PACKAGING TYPE, 2020-2029 (USD MILLION)
TABLE 89 MEXICO COSMETICS MARKET, BY DISTRIBUTION CHANNEL, 2020-2029 (USD MILLION)
TABLE 90 MEXICO OFFLINE IN COSMETICS MARKET, BY TYPE, 2020-2029 (USD MILLION)
TABLE 91 MEXICO COSMETICS MARKET, BY APPLICATION, 2020-2029 (USD MILLION)
TABLE 92 MEXICO WOMEN IN COSMETICS MARKET, BY PRODUCT TYPE, 2020-2029 (USD MILLION)
TABLE 93 MEXICO MEN IN COSMETICS MARKET, BY PRODUCT TYPE, 2020-2029 (USD MILLION)
List of Figure
FIGURE 1 NORTH AMERICA COSMETICS MARKET: SEGMENTATION
FIGURE 2 NORTH AMERICA COSMETICS MARKET: DATA TRIANGULATION
FIGURE 3 NORTH AMERICA COSMETICS MARKET: DROC ANALYSIS
FIGURE 4 NORTH AMERICA COSMETICS MARKET: NORTH AMERICA VS REGIONAL MARKET ANALYSIS
FIGURE 5 NORTH AMERICA COSMETICS MARKET: COMPANY RESEARCH ANALYSIS
FIGURE 6 NORTH AMERICA COSMETICS MARKET: INTERVIEW DEMOGRAPHICS
FIGURE 7 NORTH AMERICA COSMETICS MARKET: DBMR MARKET POSITION GRID
FIGURE 8 NORTH AMERICA COSMETICS MARKET: VENDOR SHARE ANALYSIS
FIGURE 9 NORTH AMERICA COSMETICS MARKET: APPLICATION COVERAGE GRID
FIGURE 10 NORTH AMERICA COSMETICS MARKET: SEGMENTATION
FIGURE 11 SURGE IN E-COMMERCE TO FUEL DEMANDS IN COSMETICS PRODUCTS IS EXPECTED TO DRIVE THE NORTH AMERICA COSMETICS MARKET IN THE FORECAST PERIOD OF 2022 TO 2029
FIGURE 12 SKIN CARE SEGMENT IS EXPECTED TO ACCOUNT FOR THE LARGEST SHARE OF THE NORTH AMERICA COSMETICS MARKET IN 2022 & 2029
FIGURE 13 ASIA-PACIFIC IS EXPECTED TO DOMINATE AND IS THE FASTEST-GROWING REGION IN THE NORTH AMERICA COSMETICS MARKET IN THE FORECAST PERIOD OF 2022 TO 2029
FIGURE 14 DRIVERS, RESTRAINTS, OPPORTUNITIES, AND CHALLENGES OF THE NORTH AMERICA COSMETICS MARKET
FIGURE 15 NORTH AMERICA COSMETICS MARKET, BY PRODUCT TYPE, 2021
FIGURE 16 NORTH AMERICA COSMETICS MARKET, BY NATURE, 2021
FIGURE 17 NORTH AMERICA COSMETICS MARKET, BY CATEGORY, 2021
FIGURE 18 NORTH AMERICA COSMETICS MARKET, BY PACKAGING TYPE, 2021
FIGURE 19 NORTH AMERICA COSMETICS MARKET, BY DISTRIBUTION CHANNEL, 2021
FIGURE 20 NORTH AMERICA COSMETICS MARKET, BY APPLICATION, 2021
FIGURE 21 NORTH AMERICA COSMETICS MARKET: SNAPSHOT (2021)
FIGURE 22 NORTH AMERICA COSMETICS MARKET: BY COUNTRY (2021)
FIGURE 23 NORTH AMERICA COSMETICS MARKET: BY COUNTRY (2022 & 2029)
FIGURE 24 NORTH AMERICA COSMETICS MARKET: BY COUNTRY (2021 & 2029)
FIGURE 25 NORTH AMERICA COSMETICS MARKET: BY PRODUCT TYPE (2022-2029)
FIGURE 26 NORTH AMERICA COSMETICS MARKET: COMPANY SHARE 2021 (%)
Data collection and base year analysis are done using data collection modules with large sample sizes. The stage includes obtaining market information or related data through various sources and strategies. It includes examining and planning all the data acquired from the past in advance. It likewise envelops the examination of information inconsistencies seen across different information sources. The market data is analysed and estimated using market statistical and coherent models. Also, market share analysis and key trend analysis are the major success factors in the market report. To know more, please request an analyst call or drop down your inquiry.
The key research methodology used by DBMR research team is data triangulation which involves data mining, analysis of the impact of data variables on the market and primary (industry expert) validation. Data models include Vendor Positioning Grid, Market Time Line Analysis, Market Overview and Guide, Company Positioning Grid, Patent Analysis, Pricing Analysis, Company Market Share Analysis, Standards of Measurement, Global versus Regional and Vendor Share Analysis. To know more about the research methodology, drop in an inquiry to speak to our industry experts.
Data Bridge Market Research is a leader in advanced formative research. We take pride in servicing our existing and new customers with data and analysis that match and suits their goal. The report can be customized to include price trend analysis of target brands understanding the market for additional countries (ask for the list of countries), clinical trial results data, literature review, refurbished market and product base analysis. Market analysis of target competitors can be analyzed from technology-based analysis to market portfolio strategies. We can add as many competitors that you require data about in the format and data style you are looking for. Our team of analysts can also provide you data in crude raw excel files pivot tables (Fact book) or can assist you in creating presentations from the data sets available in the report.


