
 Market Analysis and Insights: North America Flock Adhesives Market
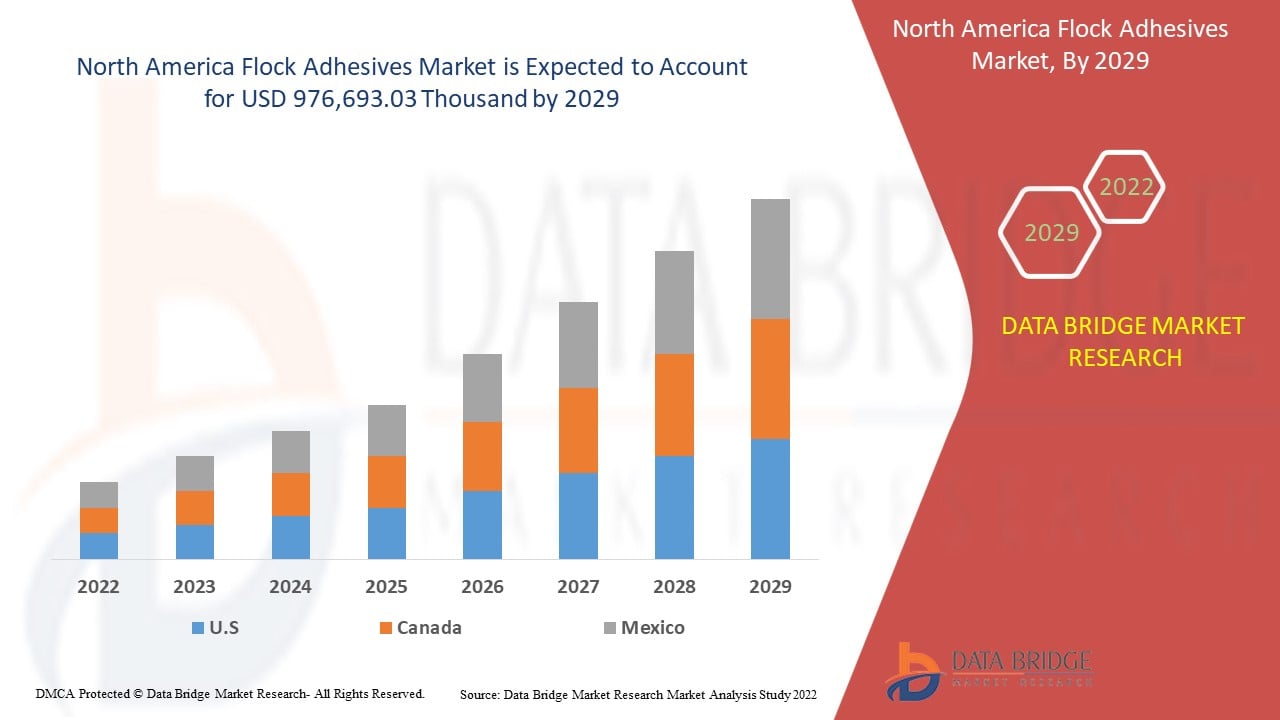
North America flock adhesives market is expected to gain market growth in the forecast period of 2022 to 2029. Data Bridge Market Research analyses that the market is growing at a CAGR of 5.0% in the forecast period of 2022 to 2029 and is expected to reach USD 976,693.03 thousand by 2029. The growing trend of lightweight and low carbon-emitting vehicles and positive outlook towards flock adhesives in the automotive and textile sectors are expected to drive the market.
Flock adhesives are binding materials used to bond various substrates, such as rubber, plastic, and metal. Adhesive flocking occurs when fiber particles are electrostatically incorporated into the adhesive layer. Most flocking uses finely chopped natural or synthetic fibers. The flocked external gives the surface decorative, functional properties.
The rising adoption of flock adhesives in thermal insulation manufacturing and shifting consumer preference for the quality level of the automotive interior are some of the key determinants which may favor the growth of the North America flock adhesives market during the forecast period.
However, volatility in raw material prices and the reaction of different composition structures may act as major restraints on the growth rate of the North America flock adhesives market. In addition, stringent regulations associated with the commercialization approval process can challenge the market’s growth during the forecast period.
The upsurge in the utilization of flock adhesives in the printing and packaging sectors may create lucrative opportunities for the market.
This North America flock adhesives market report provides details of market share, new developments, and product pipeline analysis, the impact of domestic and localized market players, analyses opportunities in terms of emerging revenue pockets, changes in market regulations, product approvals, strategic decisions, product launches, geographic expansions, and technological innovations in the market. To understand the analysis and the market scenario, contact us for an Analyst Brief; our team will help you create a revenue impact solution to achieve your desired goal.
 North America Flock Adhesives Market Scope and Market Size
North America flock adhesives market is segmented into four notable segments based on source, substrate, product, and application. The growth among segments helps you analyse niche pockets of growth and strategies to approach the market and determine your core application areas and the difference in your target markets.
- On the basis of source, the North America flock adhesives market is segmented into solvent-borne and water-borne. In 2022, the water-borne segment is projected to dominate the North American region as it consists of low melting temperature that helps maintain the softness of any product and raise its demand in the market.
- On the basis of substrate, the North America flock adhesives market is segmented into textile, plastic, metal, glass, wood, and others. In 2022, the plastic segment is projected to dominate the North American region as plastic has a high resistance capacity that helps sustain the temperature balance of any product and thus raises its demand in the market.
- On the basis of product, the North America flock adhesives market is segmented into polyurethane, acrylic, epoxy, and others. In 2022, the acrylic segment is projected to dominate the North American region as acrylic has good thermal conductivity and thus raising its demand in the market.
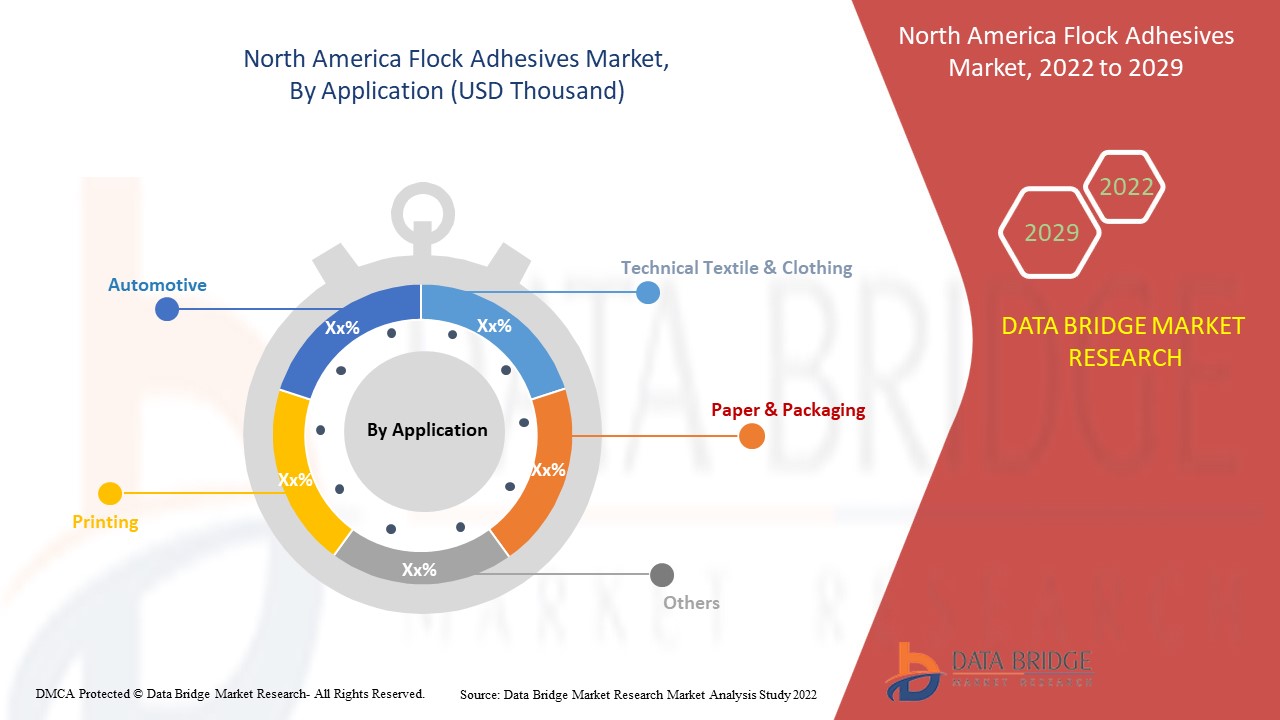
- On the basis of application, the North America flock adhesives market is segmented into automotive, technical textile & clothing, printing, paper & packaging, and others. In 2022, the automotive segment is projected to dominate the region as flock adhesives are very light weighted and used for making car interiors and thus increasing its demand in the market.
North America Flock Adhesives Market Country Level Analysis
North America flock adhesives market is segmented into four notable segments based on source, substrate, product, and application.
The countries covered in the North America flock adhesives market are the U.S., Canada, Mexico.
The country section of the report also provides individual market impacting factors and changes in market regulation that impact the current and future trends of the market. Data points such as new sales, replacement sales, country demographics, regulatory acts, and import-export tariffs are some of the major pointers used to forecast the market scenario for individual countries. Also, the presence and availability of North American brands and their challenges faced due to large or scarce competition from local and domestic brands, the impact of sales channels are considered while providing forecast analysis of the country data.
Growing Trend of Lightweight and Low Carbon-Emitting Vehicles
Lightweight materials used in the manufacture of automobiles offer great opportunities for weight reduction and other benefits when used in structural steel and cast iron in automotive applications. Electric vehicles have the most significant impact on reducing greenhouse gas emissions in most countries, and light gasoline vehicles achieve significant reductions. A 10% reduction in vehicle weight can improve fuel consumption by 6% and 8%.
Advanced electric vehicle manufacturing materials are essential to fuel the automotive market while maintaining safety and performance. Lightweight materials offer great potential to increase vehicle efficiency, as lighter objects require less energy to accelerate than heavier ones. Replacing cast iron and traditional steel parts with lightweight materials such as high-strength steel and magnesium alloys can reduce vehicle body and chassis weight by up to 50%, thus reducing fuel consumption.
- In conclusion, light vehicles are primarily made of aluminum or specialty light steel and emit fewer pollutant gases than other vehicles. For this reason, the growing trend of lightweight and low carbon-emitting vehicles is expected to act as a driver for boosting the demand of the North America flock adhesives market.
The North America flock adhesives market also provides you with a detailed market analysis for every country’s growth in a particular market. Additionally, it provides detailed information regarding the market players’ strategy and their geographical presence. The data is available for the historical period 2012 to 2020.
Competitive Landscape and North America Flock Adhesives Market Share Analysis
The North America flock adhesives market competitive landscape provides details by the competitor. Details included are company overview, company financials, revenue generated, market potential, investment in research and development, new market initiatives, North America presence, production sites and facilities, company strengths and weaknesses, product launch, clinical trials pipelines, brand analysis, product approvals, patents, product width and breadth, application dominance, technology lifeline curve. The above data points provided are only related to the focus of the North America flock adhesives market.
Some of the major market players engaged in the North America flock adhesives market are Sika AG, CHT Group, NYATEX, Arkema, H.B. Fuller Company, Dow, PARKER HANNIFIN CORP, Henkel AG & Co. KGaA, Stahl Holdings B.V, Avient Corporation, Kissel + Wolf GmbH, among other domestic players. DBMR analysts understand competitive strengths and provide competitive analysis for each competitor separately.
The companies also initiate many contracts and agreements, which accelerates the North America flock adhesives market.
For instance,
- In February 2021, PARKER HANNIFIN CORP participated in the Fluid Power Expo 2021 hosted in virtual mode. The company participated in the event to present its products to possible customers. It has helped the company expand its consumer base
- In August 2021, Arkema acquired Ashland’s Performance Adhesives business, a leading company in high-performance adhesives for industrial applications in the U.S. This has helped the company to expand its product portfolio in terms of adhesives and solutions
SKU-

- Interactive Data Analysis Dashboard
- Company Analysis Dashboard for high growth potential opportunities
- Research Analyst Access for customization & queries
- Competitor Analysis with Interactive dashboard
- Latest News, Updates & Trend analysis
- Harness the Power of Benchmark Analysis for Comprehensive Competitor Tracking
Table of Content
1 INTRODUCTION
1.1 OBJECTIVES OF THE STUDY
1.2 MARKET DEFINITION
1.3 OVERVIEW OF NORTH AMERICA FLOCK ADHESIVES MARKET
1.4 LIMITATIONS
1.5 MARKETS COVERED
2 MARKET SEGMENTATION
2.1 MARKETS COVERED
2.2 GEOGRAPHICAL SCOPE
2.3 YEARS CONSIDERED FOR THE STUDY
2.4 CURRENCY AND PRICING
2.5 DBMR TRIPOD DATA VALIDATION MODEL
2.6 THE PRODUCT LIFE LINE CURVE
2.7 MULTIVARIATE MODELING
2.8 PRIMARY INTERVIEWS WITH KEY OPINION LEADERS
2.9 DBMR MARKET POSITION GRID
2.1 MARKET APPLICATION COVERAGE GRID
2.11 DBMR MARKET CHALLENGE MATRIX
2.12 VENDOR SHARE ANALYSIS
2.13 IMPORT-EXPORT DATA
2.14 SECONDARY SOURCES
2.15 ASSUMPTIONS
3 EXECUTIVE SUMMARY
4 PREMIUM INSIGHTS
5 REGIONAL SUMMARY
5.1 NORTH AMERICA
5.2 NORTH AMERICA
5.3 ASIA-PACIFIC
5.4 EUROPE
5.5 SOUTH AMERICA
5.6 MIDDLE EAST AND AFRICA
6 MARKET OVERVIEW
6.1 DRIVERS
6.1.1 GROWING TREND OF LIGHTWEIGHT AND LOW CARBON-EMITTING VEHICLES
6.1.2 POSITIVE OUTLOOK TOWARDS FLOCK ADHESIVES IN AUTOMOTIVE AND TEXTILE SECTORS
6.1.3 RISING ADOPTION OF FLOCK ADHESIVES TO MANUFACTURE THERMAL INSULATION
6.1.4 SHIFTING CONSUMER PREFERENCE TOWARDS QUALITY LEVEL OF AUTOMOTIVE INTERIOR
6.2 RESTRAINTS
6.2.1 VOLATILITY IN RAW MATERIAL PRICES
6.2.2 REACTION OF DIFFERENT COMPOSITION STRUCTURE
6.2.3 RESTRICTED SUPPLY OF RAW MATERIALS FOR PRODUCING FLOCK ADHESIVES
6.3 OPPORTUNITIES
6.3.1 INCREASING R&D ACTIVITIES INVESTMENTS FOR THE DEVELOPMENT OF NEW PRODUCTS
6.3.2 UPSURGE IN UTILIZATION OF FLOCK ADHESIVES IN PRINTING AND PACKAGING SECTORS
6.3.3 FLAME RETARDING AND HIGH WASHABILITY QUALITIES BASED FLOCK ADHESIVES PRODUCTS CREATES LUCRATIVE OPPORTUNITIES
6.4 CHALLENGES
6.4.1 STRINGENT REGULATIONS ASSOCIATED WITH THE COMMERCIALIZATION APPROVAL PROCESS
6.4.2 LACK OF AWARENESS REGARDING FLOCK ADHESIVES IN SEVERAL EMERGING ECONOMIES
7 IMPACT OF COVID 19 IMPACT ON THE NORTH AMERICA FLOCK ADHESIVES MARKET
7.1 ANALYSIS ON IMPACT OF COVID-19 ON THE NORTH AMERICA FLOCK ADHESIVES MARKET
7.2 AFTERMATH OF COVID-19 AND GOVERNMENT INITIATIVE TO BOOST THE NORTH AMERICA FLOCK ADHESIVES MARKET
7.3 STRATEGIC DECISIONS FOR MANUFACTURERS AFTER COVID-19 TO GAIN COMPETITIVE MARKET SHARE
7.4 IMPACT ON PRICE
7.5 IMPACT ON DEMAND
7.6 IMPACT ON SUPPLY CHAIN
7.7 CONCLUSION
8 NORTH AMERICA FLOCK ADHESIVES MARKET, BY PRODUCT
8.1 OVERVIEW
8.2 ACRYLIC
8.3 POLYURETHANE
8.4 EPOXY
8.5 OTHERS
9 NORTH AMERICA FLOCK ADHESIVES MARKET, SOURCE
9.1 OVERVIEW
9.2 WATER-BORNE
9.3 SOLVENT-BORNE
10 NORTH AMERICA FLOCK ADHESIVES MARKET, BY SUBSTRATE
10.1 OVERVIEW
10.2 PLASTIC
10.3 METAL
10.4 TEXTILE
10.5 WOOD
10.6 GLASS
10.7 OTHERS
11 NORTH AMERICA FLOCK ADHESIVES MARKET, BY APPLICATION
11.1 OVERVIEW
11.2 AUTOMOTIVE
11.2.1 ACRYLIC
11.2.2 POLYURETHANE
11.2.3 EPOXY
11.2.4 OTHERS
11.3 TECHNICAL TEXTILE & CLOTHING
11.3.1 ACRYLIC
11.3.2 POLYURETHANE
11.3.3 EPOXY
11.3.4 OTHERS
11.4 PAPER & PACKAGING
11.4.1 ACRYLIC
11.4.2 POLYURETHANE
11.4.3 EPOXY
11.4.4 OTHERS
11.5 PRINTING
11.5.1 ACRYLIC
11.5.2 POLYURETHANE
11.5.3 EPOXY
11.5.4 OTHERS
11.6 OTHERS
11.6.1 ACRYLIC
11.6.2 POLYURETHANE
11.6.3 EPOXY
11.6.4 OTHERS
12 NORTH AMERICA FLOCK ADHESIVE MARKET, BY REGION
12.1 NORTH AMERICA
12.1.1 U.S.
12.1.2 CANADA
12.1.3 MEXICO
13 NORTH AMERICA FLOCK ADHESIVES MARKET: COMPANY LANDSCAPE
13.1 COMPANY SHARE ANALYSIS: NORTH AMERICA
14 SWOT ANALYSIS
15 COMPANY PROFILES
15.1 DOW
15.1.1 COMPANY SNAPSHOT
15.1.2 REVENUE ANALYSIS
15.1.3 COMPANY SHARE ANALYSIS
15.1.4 PRODUCT PORTFOLIO
15.1.5 RECENT UPDATE
15.2 SIKA AG
15.2.1 COMPANY SNAPSHOT
15.2.2 REVENUE ANALYSIS
15.2.3 COMPANY SHARE ANALYSIS
15.2.4 PRODUCT PORTFOLIO
15.2.5 RECENT UPDATES
15.3 HENKEL AG & CO. KGAA
15.3.1 COMPANY SNAPSHOT
15.3.2 REVENUE ANALYSIS
15.3.3 COMPANY SHARE ANALYSIS
15.3.4 PRODUCT PORTFOLIO
15.3.5 RECENT UPDATE
15.4 PARKER HANNIFIN CORP
15.4.1 COMPANY SNAPSHOT
15.4.2 REVENUE ANALYSIS
15.4.3 COMPANY SHARE ANALYSIS
15.4.4 PRODUCT PORTFOLIO
15.4.5 RECENT UPDATE
15.5 ARKEMA
15.5.1 COMPANY SNAPSHOT
15.5.2 REVENUE ANALYSIS
15.5.3 COMPANY SHARE ANALYSIS
15.5.4 PRODUCT PORTFOLIO
15.5.5 RECENT UPDATES
15.6 AVIENT CORPORATION
15.6.1 COMPANY SNAPSHOT
15.6.2 REVENUE ANALYSIS
15.6.3 PRODUCT PORTFOLIO
15.6.4 RECENT UPDATE
15.7 H.B. FULLER COMPANY
15.7.1 COMPANY SNAPSHOT
15.7.2 REVENUE ANALYSIS
15.7.3 PRODUCT PORTFOLIO
15.7.4 RECENT UPDATES
15.8 CHT GROUP
15.8.1 COMPANY SNAPSHOT
15.8.2 PRODUCT PORTFOLIO
15.8.3 RECENT UPDATES
15.9 KISSEL + WOLF GMBH
15.9.1 COMPANY SNAPSHOT
15.9.2 PRODUCT PORTFOLIO
15.9.3 RECENT UPDATE
15.1 NANPAO RESINS CHEMICAL GROUP
15.10.1 COMPANY SNAPSHOT
15.10.2 REVENUE ANALYSIS
15.10.3 PRODUCT PORTFOLIO
15.10.4 RECENT UPDATE
15.11 NYATEX
15.11.1 COMPANY SNAPSHOT
15.11.2 PRODUCT PORTFOLIO
15.11.3 RECENT UPDATE
15.12 STAHL HOLDINGS B.V
15.12.1 COMPANY SNAPSHOT
15.12.2 PRODUCT PORTFOLIO
15.12.3 RECENT UPDATE
15.13 SWISSFLOCK AG
15.13.1 COMPANY SNAPSHOT
15.13.2 PRODUCT PORTFOLIO
15.13.3 RECENT UPDATE
16 QUESTIONNAIRE
17 RELATED REPORTS
List of Table
TABLE 1 EXPORT DATA OF GLUES, PREPARED, AND OTHER PREPARED ADHESIVES, N.E.S., HS 350699 (USD THOUSAND)
TABLE 2 IMPORT DATA OF GLUES, PREPARED, AND OTHER PREPARED ADHESIVES, N.E.S., HS 350699 (USD THOUSAND)
TABLE 3 NORTH AMERICA FLOCK ADHESIVES MARKET, BY PRODUCT, 2020-2029 (USD THOUSAND)
TABLE 4 NORTH AMERICA FLOCK ADHESIVES MARKET, BY PRODUCT, 2020-2029 (TONS)
TABLE 5 NORTH AMERICA ACRYLIC IN FLOCK ADHESIVES MARKET, BY REGION, 2020-2029 (USD THOUSAND)
TABLE 6 NORTH AMERICA ACRYLIC IN FLOCK ADHESIVES MARKET, BY REGION, 2020-2029 (TONS)
TABLE 7 NORTH AMERICA POLYURETHANE IN FLOCK ADHESIVES MARKET, BY REGION, 2020-2029 (USD THOUSAND)
TABLE 8 NORTH AMERICA POLYURETHANE IN FLOCK ADHESIVES MARKET, BY REGION, 2020-2029 (TONS)
TABLE 9 NORTH AMERICA EPOXY IN FLOCK ADHESIVES MARKET, BY REGION, 2020-2029 (USD THOUSAND)
TABLE 10 NORTH AMERICA EPOXY IN FLOCK ADHESIVES MARKET, BY REGION, 2020-2029 (TONS)
TABLE 11 NORTH AMERICA OTHERS IN FLOCK ADHESIVES MARKET, BY REGION, 2020-2029 (USD THOUSAND)
TABLE 12 NORTH AMERICA OTHERS IN FLOCK ADHESIVES MARKET, BY REGION, 2020-2029 (TONS)
TABLE 13 NORTH AMERICA FLOCK ADHESIVES MARKET, BY SOURCE, 2022-2029 (USD THOUSAND)
TABLE 14 NORTH AMERICA WATER-BORNE IN FLOCK ADHESIVES MARKET, BY REGION, 2020-2029 (USD THOUSAND)
TABLE 15 NORTH AMERICA SOLVENT-BORNE IN FLOCK ADHESIVES MARKET, BY REGION, 2020-2029 (USD THOUSAND)
TABLE 16 NORTH AMERICA FLOCK ADHESIVES MARKET, BY SUBSTRATE, 2020-2029 (USD THOUSAND)
TABLE 17 NORTH AMERICA PLASTIC IN FLOCK ADHESIVES MARKET, BY REGION, 2020-2029 (USD THOUSAND)
TABLE 18 NORTH AMERICA METAL IN FLOCK ADHESIVES MARKET, BY REGION, 2020-2029 (USD THOUSAND)
TABLE 19 NORTH AMERICA TEXTILE IN FLOCK ADHESIVES MARKET, BY REGION, 2020-2029 (USD THOUSAND)
TABLE 20 NORTH AMERICA WOOD IN FLOCK ADHESIVES MARKET, BY REGION, 2020-2029 (USD THOUSAND)
TABLE 21 NORTH AMERICA GLASS IN FLOCK ADHESIVES MARKET, BY REGION, 2020-2029 (USD THOUSAND)
TABLE 22 NORTH AMERICA OTHERS IN FLOCK ADHESIVES MARKET, BY REGION, 2020-2029 (USD THOUSAND)
TABLE 23 NORTH AMERICA FLOCK ADHESIVES MARKET, BY APPLICATION, 2020-2029 (USD THOUSAND)
TABLE 24 NORTH AMERICA AUTOMOTIVE IN FLOCK ADHESIVES MARKET, BY REGION, 2020-2029 (USD THOUSAND)
TABLE 25 NORTH AMERICA AUTOMOTIVE IN FLOCK ADHESIVES MARKET, BY PRODUCT, 2020-2029 (USD THOUSAND)
TABLE 26 NORTH AMERICA TECHNICAL TEXTILE & CLOTHING IN FLOCK ADHESIVES MARKET, BY REGION, 2020-2029 (USD THOUSAND)
TABLE 27 NORTH AMERICA TECHNICAL TEXTILE & CLOTHING IN FLOCK ADHESIVES MARKET, BY PRODUCT, 2020-2029 (USD THOUSAND)
TABLE 28 NORTH AMERICA PAPER & PACKAGING IN FLOCK ADHESIVES MARKET, BY REGION, 2020-2029 (USD THOUSAND)
TABLE 29 NORTH AMERICA PAPER & PACKAGING IN FLOCK ADHESIVES MARKET, BY PRODUCT, 2020-2029 (USD THOUSAND)
TABLE 30 NORTH AMERICA PRINTING IN FLOCK ADHESIVES MARKET, BY REGION, 2020-2029 (USD THOUSAND)
TABLE 31 NORTH AMERICA PRINTING IN FLOCK ADHESIVES MARKET, BY PRODUCT, 2020-2029 (USD THOUSAND)
TABLE 32 NORTH AMERICA OTHERS IN FLOCK ADHESIVES MARKET, BY REGION, 2020-2029 (USD THOUSAND)
TABLE 33 NORTH AMERICA OTHERS IN FLOCK ADHESIVES MARKET, BY PRODUCT, 2020-2029 (USD THOUSAND)
TABLE 34 NORTH AMERICA FLOCK ADHESIVES MARKET, BY COUNTRY, 2020-2029 (USD THOUSAND)
TABLE 35 NORTH AMERICA FLOCK ADHESIVES MARKET, BY COUNTRY, 2020-2029 (TONS)
TABLE 36 NORTH AMERICA FLOCK ADHESIVES MARKET, BY PRODUCT, 2020-2029 (USD THOUSAND)
TABLE 37 NORTH AMERICA FLOCK ADHESIVES MARKET, BY PRODUCT, 2020-2029 (TONS)
TABLE 38 NORTH AMERICA FLOCK ADHESIVES MARKET, BY SOURCE, 2020-2029 (USD THOUSAND)
TABLE 39 NORTH AMERICA FLOCK ADHESIVES MARKET, BY SUBSTRATE, 2020-2029 (USD THOUSAND)
TABLE 40 NORTH AMERICA FLOCK ADHESIVES MARKET, BY APPLICATION, 2020-2029 (USD THOUSAND)
TABLE 41 NORTH AMERICA AUTOMOTIVE IN FLOCK ADHESIVES MARKET, BY PRODUCT, 2020-2029 (USD THOUSAND)
TABLE 42 NORTH AMERICA TECHNICAL TEXTILE & CLOTHING IN FLOCK ADHESIVES MARKET, BY PRODUCT, 2020-2029 (USD THOUSAND)
TABLE 43 NORTH AMERICA PAPER & PACKAGING IN FLOCK ADHESIVES MARKET, BY PRODUCT, 2020-2029 (USD THOUSAND)
TABLE 44 NORTH AMERICA PRINTING IN FLOCK ADHESIVES MARKET, BY PRODUCT, 2020-2029 (USD THOUSAND)
TABLE 45 NORTH AMERICA OTHERS IN FLOCK ADHESIVES MARKET, BY PRODUCT, 2020-2029 (USD THOUSAND)
TABLE 46 U.S. FLOCK ADHESIVES MARKET, BY PRODUCT, 2020-2029 (USD THOUSAND)
TABLE 47 US FLOCK ADHESIVES MARKET, BY PRODUCT, 2020-2029 (TONS)
TABLE 48 US FLOCK ADHESIVES MARKET, BY SOURCE, 2020-2029 (USD THOUSAND)
TABLE 49 US FLOCK ADHESIVES MARKET, BY SUBSTRATE, 2020-2029 (USD THOUSAND)
TABLE 50 US FLOCK ADHESIVES MARKET, BY APPLICATION, 2020-2029 (USD THOUSAND)
TABLE 51 US AUTOMOTIVE IN FLOCK ADHESIVES MARKET, BY PRODUCT, 2020-2029 (USD THOUSAND)
TABLE 52 US TECHNICAL TEXTILE & CLOTHING IN FLOCK ADHESIVES MARKET, BY PRODUCT, 2020-2029 (USD THOUSAND)
TABLE 53 US PAPER & PACKAGING IN FLOCK ADHESIVES MARKET, BY PRODUCT, 2020-2029 (USD THOUSAND)
TABLE 54 US PRINTING IN FLOCK ADHESIVES MARKET, BY PRODUCT, 2020-2029 (USD THOUSAND)
TABLE 55 US OTHERS IN FLOCK ADHESIVES MARKET, BY PRODUCT, 2020-2029 (USD THOUSAND)
TABLE 56 CANADA FLOCK ADHESIVES MARKET, BY PRODUCT, 2020-2029 (USD THOUSAND)
TABLE 57 CANADA FLOCK ADHESIVES MARKET, BY PRODUCT, 2020-2029 (TONS)
TABLE 58 CANADA FLOCK ADHESIVES MARKET, BY SOURCE, 2020-2029 (USD THOUSAND)
TABLE 59 CANADA FLOCK ADHESIVES MARKET, BY SUBSTRATE, 2020-2029 (USD THOUSAND)
TABLE 60 CANADA FLOCK ADHESIVES MARKET, BY APPLICATION, 2020-2029 (USD THOUSAND)
TABLE 61 CANADA AUTOMOTIVE IN FLOCK ADHESIVES MARKET, BY PRODUCT, 2020-2029 (USD THOUSAND)
TABLE 62 CANADA TECHNICAL TEXTILE & CLOTHING IN FLOCK ADHESIVES MARKET, BY PRODUCT, 2020-2029 (USD THOUSAND)
TABLE 63 CANADA PAPER & PACKAGING IN FLOCK ADHESIVES MARKET, BY PRODUCT, 2020-2029 (USD THOUSAND)
TABLE 64 CANADA PRINTING IN FLOCK ADHESIVES MARKET, BY PRODUCT, 2020-2029 (USD THOUSAND)
TABLE 65 CANADA OTHERS IN FLOCK ADHESIVES MARKET, BY PRODUCT, 2020-2029 (USD THOUSAND)
TABLE 66 MEXICO FLOCK ADHESIVES MARKET, BY PRODUCT, 2020-2029 (USD THOUSAND)
TABLE 67 MEXICO FLOCK ADHESIVES MARKET, BY PRODUCT, 2020-2029 (TONS)
TABLE 68 MEXICO FLOCK ADHESIVES MARKET, BY SOURCE, 2020-2029 (USD THOUSAND)
TABLE 69 MEXICO FLOCK ADHESIVES MARKET, BY SUBSTRATE, 2020-2029 (USD THOUSAND)
TABLE 70 MEXICO FLOCK ADHESIVES MARKET, BY APPLICATION, 2020-2029 (USD THOUSAND)
TABLE 71 MEXICO AUTOMOTIVE IN FLOCK ADHESIVES MARKET, BY PRODUCT, 2020-2029 (USD THOUSAND)
TABLE 72 MEXICO TECHNICAL TEXTILE & CLOTHING IN FLOCK ADHESIVES MARKET, BY PRODUCT, 2020-2029 (USD THOUSAND)
TABLE 73 MEXICO PAPER & PACKAGING IN FLOCK ADHESIVES MARKET, BY PRODUCT, 2020-2029 (USD THOUSAND)
TABLE 74 MEXICO PRINTING IN FLOCK ADHESIVES MARKET, BY PRODUCT, 2020-2029 (USD THOUSAND)
TABLE 75 MEXICO OTHERS IN FLOCK ADHESIVES MARKET, BY PRODUCT, 2020-2029 (USD THOUSAND)
List of Figure
FIGURE 1 NORTH AMERICA FLOCK ADHESIVES MARKET: SEGMENTATION
FIGURE 2 NORTH AMERICA FLOCK ADHESIVES MARKET: DATA TRIANGULATION
FIGURE 3 NORTH AMERICA FLOCK ADHESIVES MARKET: DROC ANALYSIS
FIGURE 4 NORTH AMERICA FLOCK ADHESIVES MARKET: NORTH AMERICA VS REGIONAL MARKET ANALYSIS
FIGURE 5 NORTH AMERICA FLOCK ADHESIVES MARKET: COMPANY RESEARCH ANALYSIS
FIGURE 6 NORTH AMERICA FLOCK ADHESIVES MARKET: THE PRODUCT LIFE LINE CURVE
FIGURE 7 NORTH AMERICA FLOCK ADHESIVES MARKET: MULTIVARIATE MODELLING
FIGURE 8 NORTH AMERICA FLOCK ADHESIVES MARKET: INTERVIEW DEMOGRAPHICS
FIGURE 9 NORTH AMERICA FLOCK ADHESIVES MARKET: DBMR MARKET POSITION GRID
FIGURE 10 NORTH AMERICA FLOCK ADHESIVES MARKET: MARKET APPLICATION COVERAGE GRID
FIGURE 11 NORTH AMERICA FLOCK ADHESIVES MARKET: THE MARKET CHALLENGE MATRIX
FIGURE 12 NORTH AMERICA FLOCK ADHESIVES MARKET: VENDOR SHARE ANALYSIS
FIGURE 13 NORTH AMERICA FLOCK ADHESIVES MARKET: SEGMENTATION
FIGURE 14 A POSITIVE OUTLOOK TOWARDS FLOCK ADHESIVES IN THE AUTOMOTIVE AND TEXTILE SECTORS IS EXPECTED TO DRIVE THE NORTH AMERICA FLOCK ADHESIVES MARKET IN THE FORECAST PERIOD OF 2022 TO 2029
FIGURE 15 ACRYLIC SEGMENT IS EXPECTED TO ACCOUNT FOR THE LARGEST SHARE OF THE NORTH AMERICA FLOCK ADHESIVES MARKET IN 2022 & 2029
FIGURE 16 DRIVERS, RESTRAINTS, OPPORTUNITIES, AND CHALLENGES OF NORTH AMERICA FLOCK ADHESIVES MARKET
FIGURE 17 PERCENTAGE OF LIGHTWEIGHT MATERIALS PRESENT IN TYPICAL VEHICLES (APPROXIMATE VALUE)
FIGURE 18 NORTH AMERICA FLOCK ADHESIVES MARKET, BY PRODUCT, 2021
FIGURE 19 NORTH AMERICA FLOCK ADHESIVES MARKET, BY SOURCE, 2021
FIGURE 20 NORTH AMERICA FLOCK ADHESIVES MARKET, BY SUBSTRATE, 2021
FIGURE 21 NORTH AMERICA FLOCK ADHESIVES MARKET, BY APPLICATION, 2021
FIGURE 22 NORTH AMERICA FLOCK ADHESIVES MARKET: SNAPSHOT (2021)
FIGURE 23 NORTH AMERICA FLOCK ADHESIVES MARKET: BY COUNTRY (2021)
FIGURE 24 NORTH AMERICA FLOCK ADHESIVES MARKET: BY COUNTRY (2022 & 2029)
FIGURE 25 NORTH AMERICA FLOCK ADHESIVES MARKET: BY COUNTRY (2021 & 2029)
FIGURE 26 NORTH AMERICA FLOCK ADHESIVES MARKET: BY PRODUCT (2022-2029)
FIGURE 27 NORTH AMERICA FLOCK ADHESIVES MARKET: COMPANY SHARE 2021 (%)
North America Flock Adhesives Market, Supply Chain Analysis and Ecosystem Framework
To support market growth and help clients navigate the impact of geopolitical shifts, DBMR has integrated in-depth supply chain analysis into its North America Flock Adhesives Market research reports. This addition empowers clients to respond effectively to global changes affecting their industries. The supply chain analysis section includes detailed insights such as North America Flock Adhesives Market consumption and production by country, price trend analysis, the impact of tariffs and geopolitical developments, and import and export trends by country and HSN code. It also highlights major suppliers with data on production capacity and company profiles, as well as key importers and exporters. In addition to research, DBMR offers specialized supply chain consulting services backed by over a decade of experience, providing solutions like supplier discovery, supplier risk assessment, price trend analysis, impact evaluation of inflation and trade route changes, and comprehensive market trend analysis.
Data collection and base year analysis are done using data collection modules with large sample sizes. The stage includes obtaining market information or related data through various sources and strategies. It includes examining and planning all the data acquired from the past in advance. It likewise envelops the examination of information inconsistencies seen across different information sources. The market data is analysed and estimated using market statistical and coherent models. Also, market share analysis and key trend analysis are the major success factors in the market report. To know more, please request an analyst call or drop down your inquiry.
The key research methodology used by DBMR research team is data triangulation which involves data mining, analysis of the impact of data variables on the market and primary (industry expert) validation. Data models include Vendor Positioning Grid, Market Time Line Analysis, Market Overview and Guide, Company Positioning Grid, Patent Analysis, Pricing Analysis, Company Market Share Analysis, Standards of Measurement, Global versus Regional and Vendor Share Analysis. To know more about the research methodology, drop in an inquiry to speak to our industry experts.
Data Bridge Market Research is a leader in advanced formative research. We take pride in servicing our existing and new customers with data and analysis that match and suits their goal. The report can be customized to include price trend analysis of target brands understanding the market for additional countries (ask for the list of countries), clinical trial results data, literature review, refurbished market and product base analysis. Market analysis of target competitors can be analyzed from technology-based analysis to market portfolio strategies. We can add as many competitors that you require data about in the format and data style you are looking for. Our team of analysts can also provide you data in crude raw excel files pivot tables (Fact book) or can assist you in creating presentations from the data sets available in the report.


