
North America Hyperspectral Imaging Systems Market
Market Size in USD Billion
 USD
1.46 Billion
USD
5.65 Billion
2025
2033
USD
1.46 Billion
USD
5.65 Billion
2025
2033
| 2026 - 2033 | |
| USD 1.46 Billion | |
| USD 5.65 Billion | |
| % | |
|
North America Hyperspectral Imaging Systems Market Size
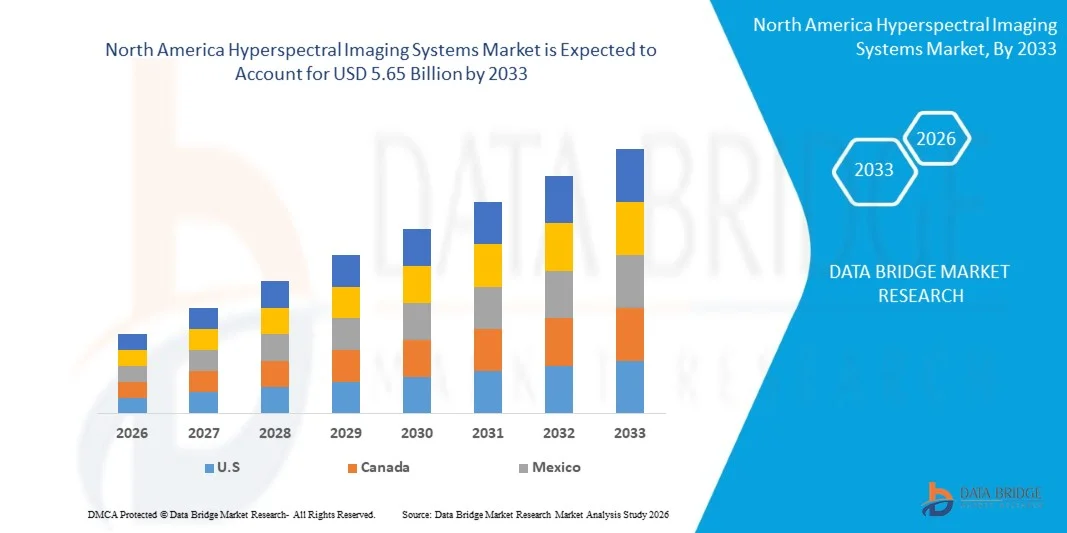
- The North America hyperspectral imaging systems market size was valued at USD 1.46 billion in 2025 and is expected to reach USD 5.65 billion by 2033, at a CAGR of 18.40% during the forecast period
- The market growth is largely fuelled by the increasing adoption of hyperspectral imaging across sectors such as agriculture, environmental monitoring, food quality inspection, and defence surveillance
- Rising investments in advanced imaging technologies, expanding research initiatives, and growing demand for precision agriculture and industrial quality control are further supporting market expansion in the region
North America Hyperspectral Imaging Systems Market Analysis
- North America hyperspectral imaging systems are advanced technologies that capture and analyze a wide spectrum of light across numerous wavelengths, providing detailed information beyond what the human eye can perceive. These systems are widely used in sectors such as agriculture, defense, mining, environmental monitoring, and medical diagnostics
- The demand for hyperspectral imaging systems is significantly driven by the growing need for precise imaging solutions in areas such as crop monitoring, disease detection, and military surveillance, as well as increasing adoption in biomedical research and clinical diagnostics
- U.S. dominated the hyperspectral imaging systems market with the largest revenue share in 2025, driven by strong technological advancements and the widespread adoption of advanced imaging technologies across defence, research, and industrial applications
- Canada is expected to witness the highest compound annual growth rate (CAGR) in the North America hyperspectral imaging systems market due to growing investments in environmental monitoring, agricultural research, and mineral exploration activities. The increasing use of hyperspectral imaging for vegetation analysis, resource mapping, and scientific research is supporting market growth, while collaborations between research institutions and technology developers are further accelerating innovation and adoption
- The cameras segment held the largest market revenue share in 2025 driven by the increasing demand for high-resolution spectral imaging solutions across industrial inspection, environmental monitoring, and scientific research. Hyperspectral cameras are widely used for capturing detailed spectral signatures that enable precise material identification and defect detection. Their ability to generate high-quality spectral data supports applications such as agriculture monitoring, medical diagnostics, and defence analysis. Continuous advancements in sensor resolution, portability, and integration with analytics software are further strengthening the adoption of hyperspectral cameras across multiple industries
Report Scope and North America Hyperspectral Imaging Systems Market Segmentation
|
Attributes |
North America Hyperspectral Imaging Systems Key Market Insights |
|
Segments Covered |
|
|
Countries Covered |
North America
|
|
Key Market Players |
• Resonon Inc. (U.S.) |
|
Market Opportunities |
|
|
Value Added Data Infosets |
In addition to the insights on market scenarios such as market value, growth rate, segmentation, geographical coverage, and major players, the market reports curated by the Data Bridge Market Research also include in-depth expert analysis, geographically represented company-wise production and capacity, network layouts of distributors and partners, detailed and updated price trend analysis and deficit analysis of supply chain and demand. |
North America Hyperspectral Imaging Systems Market Trends
“Growing Adoption of Advanced Imaging for Precision Analysis”
• The increasing demand for precise and high-resolution imaging solutions is significantly shaping the hyperspectral imaging systems market, as industries seek technologies capable of capturing detailed spectral information beyond traditional imaging methods. Hyperspectral imaging systems are gaining traction due to their ability to detect material composition, chemical properties, and subtle defects, enabling improved decision-making in industrial, scientific, and security applications. This trend is encouraging manufacturers to invest in advanced sensors, data processing algorithms, and integrated imaging platforms to enhance performance and usability
• Expanding applications across sectors such as agriculture, food quality inspection, environmental monitoring, healthcare research, and defence surveillance are accelerating market adoption. Organizations are increasingly using hyperspectral imaging to identify contaminants, monitor crop health, analyze materials, and improve quality control processes. The growing need for non-destructive testing and real-time analysis further strengthens the demand for hyperspectral imaging solutions across multiple industries
• Advancements in sensor technology, artificial intelligence, and machine learning integration are influencing the evolution of hyperspectral imaging systems. These technologies enable faster data processing, improved image accuracy, and automated interpretation of complex spectral datasets. Manufacturers are focusing on developing compact, cost-efficient, and high-performance systems that can be deployed in both laboratory and field environments
• For instance, in 2024, companies such as Headwall Photonics and Specim expanded hyperspectral imaging solutions designed for industrial inspection and agricultural monitoring. These product introductions focused on improving detection accuracy and real-time analytics, enabling organizations to enhance operational efficiency and product quality while supporting advanced research and monitoring initiatives
• While adoption of hyperspectral imaging systems is increasing, sustained market growth depends on continuous technological innovation, cost reduction, and improved integration with analytical software platforms. Manufacturers are also focusing on enhancing portability, processing speed, and system compatibility to support broader implementation across diverse applications
North America Hyperspectral Imaging Systems Market Dynamics
Driver
“Rising Demand for High-Precision Imaging and Analytical Technologies”
• The growing requirement for accurate material identification and advanced analytical capabilities is a major driver for the hyperspectral imaging systems market. Organizations are increasingly adopting hyperspectral imaging technologies to obtain detailed spectral data that enables precise analysis of materials, substances, and environmental conditions. This capability supports applications such as quality inspection, medical research, environmental assessment, and security monitoring
• Increasing use of hyperspectral imaging in research laboratories, industrial inspection, and agricultural monitoring is influencing market expansion. The technology allows users to detect chemical composition, monitor crop health, and identify structural anomalies in products without physical contact. These benefits are encouraging industries to integrate hyperspectral imaging into automated inspection systems and advanced analytical workflows
• Technology providers are actively investing in research and development to enhance imaging resolution, spectral range, and real-time data processing capabilities. These innovations are helping organizations adopt hyperspectral imaging for complex analysis tasks while improving operational efficiency and accuracy. Strategic collaborations between technology developers, research institutions, and industry stakeholders are also accelerating product innovation and adoption
• For instance, in 2023, companies such as Resonon and Corning Incorporated expanded research initiatives and product development programs to enhance hyperspectral imaging solutions for industrial inspection and scientific analysis. These initiatives were introduced to support the growing need for advanced imaging technologies capable of delivering precise spectral information across multiple applications
• Although the demand for hyperspectral imaging technologies is increasing, wider adoption depends on improving system affordability, simplifying data analysis processes, and expanding awareness of the technology’s benefits across emerging industries
Restraint/Challenge
“High System Cost and Complexity of Data Processing”
• The relatively high cost of hyperspectral imaging systems compared to conventional imaging technologies remains a key challenge for market growth. Advanced sensors, specialized optical components, and complex data processing infrastructure contribute to higher system costs. These factors can limit adoption among small and medium-sized organizations with restricted budgets
• Processing and interpreting hyperspectral data requires sophisticated analytical tools and technical expertise. Large spectral datasets generated by hyperspectral imaging systems can be difficult to manage and analyze without specialized software and trained personnel. This complexity increases operational costs and can slow adoption in industries lacking adequate technical capabilities
• Integration challenges with existing inspection systems and data infrastructure also affect implementation. Organizations must often upgrade hardware, software, and storage capabilities to effectively utilize hyperspectral imaging technology. This increases deployment time and requires additional investment in training and system optimization to ensure accurate data interpretation
• For instance, in 2024, technology integrators working with imaging providers such as Teledyne Technologies and IMEC reported that some industrial users delayed adoption due to high implementation costs and the need for specialized analytics platforms to process hyperspectral data. These factors created barriers for companies seeking cost-effective inspection solutions while maintaining high analytical accuracy
• Addressing these challenges will require cost-efficient system development, improved user-friendly software platforms, and expanded training initiatives for industry professionals. Strengthening collaboration between imaging technology providers, research institutions, and end users will also help improve accessibility and accelerate the broader adoption of hyperspectral imaging systems across multiple industries
North America Hyperspectral Imaging Systems Market Scope
The market is segmented on the basis of product, scanning techniques, technology, range, and application.
• By Product
On the basis of product, the North America hyperspectral imaging systems market is segmented into cameras and accessories. The cameras segment held the largest market revenue share in 2025 driven by the increasing demand for high-resolution spectral imaging solutions across industrial inspection, environmental monitoring, and scientific research. Hyperspectral cameras are widely used for capturing detailed spectral signatures that enable precise material identification and defect detection. Their ability to generate high-quality spectral data supports applications such as agriculture monitoring, medical diagnostics, and defence analysis. Continuous advancements in sensor resolution, portability, and integration with analytics software are further strengthening the adoption of hyperspectral cameras across multiple industries.
The accessories segment is expected to witness steady growth from 2026 to 2033, supported by the rising adoption of complementary components such as illumination systems, lenses, calibration tools, and data processing modules that enhance imaging accuracy and operational efficiency. Accessories play a critical role in optimizing system performance and enabling stable data acquisition in different environments. Increasing demand for complete hyperspectral imaging solutions is encouraging manufacturers to develop advanced accessories compatible with multiple camera systems. The expansion of research activities and industrial applications is further contributing to the growth of this segment.
• By Scanning Techniques
On the basis of scanning techniques, the market is segmented into spatial scanning, spectral scanning, non-scanning, and spatiospectral scanning. The spatial scanning segment accounted for the largest market share in 2025 driven by its capability to capture detailed spatial and spectral information across wide surfaces. This technique is widely used in applications such as agriculture monitoring, environmental research, and remote sensing where accurate spatial mapping is required. Spatial scanning systems provide high spectral resolution and are suitable for analyzing large geographic areas or industrial surfaces. The increasing use of hyperspectral imaging for crop health assessment and environmental monitoring is supporting the adoption of spatial scanning technologies.
The non-scanning segment is expected to witness the fastest growth rate from 2026 to 2033 due to its ability to capture both spatial and spectral information simultaneously without mechanical movement. This technology significantly reduces image acquisition time and enables real-time analysis, making it highly suitable for machine vision, medical imaging, and industrial inspection. Non-scanning hyperspectral imaging systems are gaining popularity in applications requiring rapid detection and automated inspection processes. Ongoing advancements in imaging sensors and computing capabilities are further supporting the development of efficient non-scanning solutions.
• By Technology
On the basis of technology, the market is segmented into push broom, snapshot, analog based video management software, IP based video management software, and others. The push broom segment held the largest market revenue share in 2025 driven by its extensive use in airborne and satellite-based hyperspectral imaging systems. Push broom technology enables continuous line-by-line scanning of surfaces, providing high spectral accuracy and detailed data for environmental monitoring and agricultural analysis. This technology is widely adopted for applications requiring high spatial resolution and consistent spectral performance. The increasing deployment of airborne hyperspectral imaging for environmental and geological studies is further strengthening the growth of this segment.
The snapshot segment is expected to witness steady growth from 2026 to 2033 due to its capability to capture a complete hyperspectral image in a single exposure. Snapshot imaging technology eliminates the need for scanning movement, enabling faster data acquisition and improved efficiency in dynamic environments. This makes it highly suitable for industrial inspection, medical diagnostics, and laboratory research where rapid image capture is essential. Growing investments in advanced sensor technology and miniaturized imaging systems are further contributing to the adoption of snapshot hyperspectral imaging solutions.
• By Range
On the basis of range, the market is segmented into less than 400 Nm, 400 Nm to 1700 Nm, and more than 1700 Nm. The 400 Nm to 1700 Nm segment held the largest market share in 2025 driven by its broad applicability across agriculture monitoring, food quality inspection, and industrial material analysis. This spectral range enables accurate detection of chemical composition, moisture content, and organic material characteristics. It is widely used in applications where detailed spectral differentiation is required for quality control and research purposes. Increasing demand for hyperspectral imaging in food safety and agricultural monitoring is supporting the growth of this segment.
The more than 1700 Nm segment is expected to witness considerable growth from 2026 to 2033 as industries increasingly adopt hyperspectral imaging for advanced chemical detection and material characterization. This extended spectral range allows deeper penetration and improved analysis of complex materials and substances. It is particularly useful in scientific research, mineral exploration, and pharmaceutical analysis. Continuous advancements in infrared imaging technologies are further expanding the application scope of this segment.
• By Application
On the basis of application, the market is segmented into military, remote sensing, medical diagnostics, machine vision and optical sorting, and others. The remote sensing segment held the largest market revenue share in 2025 driven by the increasing use of hyperspectral imaging for environmental monitoring, land resource management, and agricultural assessment. Hyperspectral data enables detailed observation of vegetation health, soil conditions, and water quality, supporting scientific research and monitoring programs. Governments and research institutions are increasingly using hyperspectral imaging for climate studies and environmental protection initiatives.
The machine vision and optical sorting segment is expected to witness the fastest growth rate from 2026 to 2033 due to the rising demand for automated inspection and sorting solutions in manufacturing and recycling industries. Hyperspectral imaging systems enable accurate identification of material composition, contaminants, and product defects during production processes. This technology helps improve operational efficiency, reduce waste, and maintain product quality standards. Increasing automation in industrial facilities and the need for advanced quality control solutions are further supporting the growth of this segment.
North America Hyperspectral Imaging Systems Market Regional Analysis
• U.S. dominated the hyperspectral imaging systems market with the largest revenue share in 2025, driven by strong technological advancements and the widespread adoption of advanced imaging technologies across defence, research, and industrial applications
• Organizations across the region increasingly rely on hyperspectral imaging for precise material identification, environmental monitoring, and quality inspection, supporting efficient decision-making and analytical accuracy
• The region’s growth is further supported by the presence of leading technology developers, strong investment in research and development, and the growing use of hyperspectral imaging in sectors such as agriculture, healthcare research, and security analysis
Canada Hyperspectral Imaging Systems Market Insight
The Canada hyperspectral imaging systems market is expected to witness the fastest growth rate from 2026 to 2033, driven by increasing investments in environmental monitoring, agricultural research, and advanced scientific analysis. Organizations are increasingly adopting hyperspectral imaging systems to study vegetation health, mineral resources, and environmental conditions with greater accuracy. The growing demand for non-destructive testing and advanced research technologies is further encouraging adoption across academic and industrial institutions. In addition, collaborations between research organizations and technology providers are accelerating innovation and market expansion.
North America Hyperspectral Imaging Systems Market Share
The North America hyperspectral imaging systems industry is primarily led by well-established companies, including:
• Resonon Inc. (U.S.)
• Headwall Photonics, Inc. (U.S.)
• Surface Optics Corporation (U.S.)
• Corning Incorporated (U.S.)
• BaySpec, Inc. (U.S.)
• Applied Spectral Imaging Inc. (U.S.)
• Telops Inc. (Canada)
• Photon etc. (Canada)
• LightForm Inc. (U.S.)
• Brimrose Corporation of America (U.S.)
• ChemImage Corporation (U.S.)
• SpecTIR LLC (U.S.)
• HinaLea Imaging Corporation (U.S.)
• HyperMed Imaging, Inc. (U.S.)
• Spectral Evolution Inc. (U.S.)
SKU-

- Interactive Data Analysis Dashboard
- Company Analysis Dashboard for high growth potential opportunities
- Research Analyst Access for customization & queries
- Competitor Analysis with Interactive dashboard
- Latest News, Updates & Trend analysis
- Harness the Power of Benchmark Analysis for Comprehensive Competitor Tracking
North America Hyperspectral Imaging Systems Market, Supply Chain Analysis and Ecosystem Framework
To support market growth and help clients navigate the impact of geopolitical shifts, DBMR has integrated in-depth supply chain analysis into its North America Hyperspectral Imaging Systems Market research reports. This addition empowers clients to respond effectively to global changes affecting their industries. The supply chain analysis section includes detailed insights such as North America Hyperspectral Imaging Systems Market consumption and production by country, price trend analysis, the impact of tariffs and geopolitical developments, and import and export trends by country and HSN code. It also highlights major suppliers with data on production capacity and company profiles, as well as key importers and exporters. In addition to research, DBMR offers specialized supply chain consulting services backed by over a decade of experience, providing solutions like supplier discovery, supplier risk assessment, price trend analysis, impact evaluation of inflation and trade route changes, and comprehensive market trend analysis.
Data collection and base year analysis are done using data collection modules with large sample sizes. The stage includes obtaining market information or related data through various sources and strategies. It includes examining and planning all the data acquired from the past in advance. It likewise envelops the examination of information inconsistencies seen across different information sources. The market data is analysed and estimated using market statistical and coherent models. Also, market share analysis and key trend analysis are the major success factors in the market report. To know more, please request an analyst call or drop down your inquiry.
The key research methodology used by DBMR research team is data triangulation which involves data mining, analysis of the impact of data variables on the market and primary (industry expert) validation. Data models include Vendor Positioning Grid, Market Time Line Analysis, Market Overview and Guide, Company Positioning Grid, Patent Analysis, Pricing Analysis, Company Market Share Analysis, Standards of Measurement, Global versus Regional and Vendor Share Analysis. To know more about the research methodology, drop in an inquiry to speak to our industry experts.
Data Bridge Market Research is a leader in advanced formative research. We take pride in servicing our existing and new customers with data and analysis that match and suits their goal. The report can be customized to include price trend analysis of target brands understanding the market for additional countries (ask for the list of countries), clinical trial results data, literature review, refurbished market and product base analysis. Market analysis of target competitors can be analyzed from technology-based analysis to market portfolio strategies. We can add as many competitors that you require data about in the format and data style you are looking for. Our team of analysts can also provide you data in crude raw excel files pivot tables (Fact book) or can assist you in creating presentations from the data sets available in the report.


