
North America Pea Flour Market
Market Size in USD Million
 USD
229.09 Million
USD
390.68 Million
2024
2032
USD
229.09 Million
USD
390.68 Million
2024
2032
| 2025 - 2032 | |
| USD 229.09 Million | |
| USD 390.68 Million | |
| % | |
|
Pea Flour Market Size
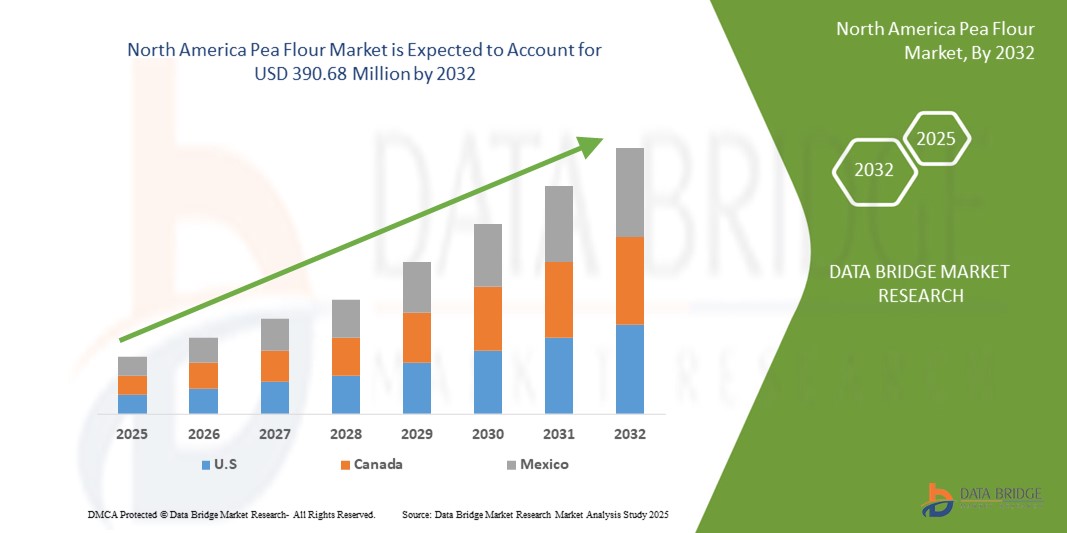
- The North America pea flour market size was valued at USD 229.09 million in 2024 and is expected to reach USD 390.68 million by 2032, at a CAGR of 6.90% during the forecast period
- The market growth is primarily driven by increasing consumer demand for plant-based protein products, rising health consciousness, and the growing popularity of gluten-free and vegan diets across the region
- In addition, the expanding use of pea flour in diverse applications, such as bakery products, snacks, and animal feed, coupled with advancements in food processing technologies, is significantly boosting the industry’s growth
Pea Flour Market Analysis
- Pea flour, derived from green or yellow peas, is a versatile ingredient rich in protein, fiber, and essential nutrients, making it a preferred choice in food & beverages, animal feed, and household applications
- The rising demand for pea flour is fueled by the growing adoption of plant-based diets, increasing awareness of sustainable food sources, and the need for gluten-free alternatives in both consumer and industrial settings
- The U.S. dominated the North America pea flour market with the largest revenue share of 65.5% in 2024, driven by high consumer awareness of health and wellness trends, a strong food processing industry, and the presence of leading market players. The country is witnessing significant growth in pea flour usage, particularly in plant-based meat alternatives and functional foods, supported by innovations from established companies and startups
- Canada is expected to be the fastest-growing country in the North America pea flour market during the forecast period, propelled by increasing urbanization, rising disposable incomes, and government initiatives promoting sustainable agriculture and plant-based products
- The inorganic segment dominated the largest market revenue share of 84.11% in 2023, driven by its lower cost and higher production volumes, making it a preferred choice for food manufacturers seeking cost-effective solutions
Report Scope and Pea Flour Market Segmentation
|
Attributes |
Pea Flour Key Market Insights |
|
Segments Covered |
|
|
Countries Covered |
North America
|
|
Key Market Players |
|
|
Market Opportunities |
|
|
Value Added Data Infosets |
In addition to the insights on market scenarios such as market value, growth rate, segmentation, geographical coverage, and major players, the market reports curated by the Data Bridge Market Research also include in-depth expert analysis, pricing analysis, brand share analysis, consumer survey, demography analysis, supply chain analysis, value chain analysis, raw material/consumables overview, vendor selection criteria, PESTLE Analysis, Porter Analysis, and regulatory framework. |
Pea Flour Market Trends
“Increasing Demand for Organic and Plant-Based Products”
- The North America pea flour market is experiencing a notable trend toward the adoption of organic and plant-based products, driven by growing consumer awareness of health, sustainability, and environmental concerns
- Organic pea flour, derived from non-GMO and pesticide-free peas, is gaining traction as consumers seek clean-label and natural ingredients for their diets
- Plant-based diets, including vegan and vegetarian lifestyles, are fueling demand for pea flour as a high-protein, gluten-free alternative to traditional flours in various food applications
- Companies are leveraging advanced processing technologies to enhance the nutritional profile and functionality of pea flour, such as improving protein content and texture for use in bakery products, snacks, and meat alternatives
- This trend is particularly appealing to health-conscious consumers and is driving innovation in product formulations, making pea flour a versatile ingredient for both manufacturers and home cooks
- For instances, brands are developing organic pea flour-based products such as protein bars, gluten-free breads, and plant-based pasta to cater to evolving consumer preferences
Pea Flour Market Dynamics
Driver
“Growing Consumer Preference for Gluten-Free and High-Protein Diets”
- Rising consumer demand for gluten-free and high-protein food options is a key driver for the North America pea flour market, as pea flour is naturally gluten-free and rich in protein and fiber
- Health-conscious consumers, particularly those with celiac disease or gluten sensitivities, are increasingly adopting pea flour for baking and cooking, boosting its popularity in household and retail applications
- The surge in fitness and wellness trends has also increased the use of pea flour in sports nutrition products, such as protein powders and energy bars, due to its high protein content and amino acid profile
- Government initiatives promoting sustainable agriculture and plant-based diets, particularly in the U.S. and Canada, are supporting the growth of pea flour as an eco-friendly ingredient
- The expansion of food and beverage industries in North America, coupled with advancements in food processing technologies, is enabling the incorporation of pea flour into a wide range of products, from snacks to ready-to-eat meals
- Major food manufacturers are increasingly offering pea flour-based products as standard or premium options to meet consumer demand for nutritious and sustainable food choices
Restraint/Challenge
“High Production Costs and Supply Chain Constraints”
- The high cost of producing organic pea flour, including sourcing non-GMO peas and adhering to organic certification standards, poses a significant barrier to market growth, particularly for small-scale manufacturers
- Processing pea flour to achieve consistent quality and functionality requires advanced equipment and technologies, which can be expensive and limit scalability in emerging markets
- Supply chain challenges, such as fluctuations in pea crop yields due to weather conditions and limited availability of organic peas, can disrupt production and increase costs
- Consumer concerns about the taste and texture of pea flour compared to traditional wheat flour may also hinder adoption, particularly in regions where awareness of its benefits is still developing
- Regulatory differences across the U.S. and Canada regarding organic certification and food labeling can complicate operations for manufacturers, increasing compliance costs and creating market entry barriers
- These factors may deter potential buyers, particularly in cost-sensitive segments, and could slow market expansion in certain regions of North America
Pea Flour market Scope
The market is segmented on the basis of category, type of peas, application, and distribution channel.
- By Category
On the basis of category, the North America pea flour market is segmented into organic and inorganic. The inorganic segment dominated the largest market revenue share of 84.11% in 2023, driven by its lower cost and higher production volumes, making it a preferred choice for food manufacturers seeking cost-effective solutions.
The organic segment is expected to witness the fastest growth rate from 2025 to 2032, fueled by increasing consumer demand for natural, non-GMO, and chemical-free products. Growing awareness of health and sustainability concerns, along with a preference for clean-label foods, is driving adoption in food and beverage applications.
- By Type of Peas
On the basis of type of peas, the North America pea flour market is segmented into green peas and yellow peas. The yellow peas segment dominated the market with a revenue share of 63.86% in 2023, attributed to its rich protein content and versatility in applications such as soups, snacks, and vegan products, which cater to health-conscious consumers.
The green peas segment is anticipated to experience the fastest growth rate from 2025 to 2032, driven by its slightly sweeter flavor and higher nutrient density, making it increasingly popular in premium plant-based food products such as baked goods and snacks.
- By Application
On the basis of application, the North America pea flour market is segmented into food & beverages, animal feed, and household/retail. The food & beverages segment accounted for the largest market revenue share of approximately 60% in 2023, driven by the rising demand for plant-based, gluten-free, and high-protein products such as meat alternatives, bakery items, and snacks.
The animal feed segment is expected to witness robust growth from 2025 to 2032, fueled by the increasing use of pea flour as a cost-effective, high-protein ingredient in livestock and pet food, particularly for clean-label and grain-free formulations.
- By Distribution Channel
On the basis of distribution channel, the North America pea flour market is segmented into direct and indirect. The direct segment held the largest market revenue share of 63.46% in 2023, as it serves as a primary channel for supplying pea flour to food manufacturers for large-scale production.
The indirect segment is anticipated to witness the fastest growth rate from 2025 to 2032, driven by increasing consumer access to pea flour through supermarkets, specialty stores, and online retailers, fueled by rising demand for plant-based and gluten-free products in household and retail settings.
Pea Flour Market Regional Analysis
- The U.S. dominated the North America pea flour market with the largest revenue share of 65.5% in 2024, driven by high consumer awareness of health and wellness trends, a strong food processing industry, and the presence of leading market players. The country is witnessing significant growth in pea flour usage, particularly in plant-based meat alternatives and functional foods, supported by innovations from established companies and startups
- Canada is expected to be the fastest-growing country in the North America pea flour market during the forecast period, propelled by increasing urbanization, rising disposable incomes, and government initiatives promoting sustainable agriculture and plant-based products
U.S. Pea Flour Market Insight
The U.S. pea flour market captured the largest revenue share of 77.8% in 2024 within North America, fueled by strong demand for plant-based and gluten-free products in the food and beverage sector. Growing consumer awareness of pea flour’s health benefits, such as high protein content and allergen-free properties, fuels market expansion. The trend toward plant-based diets and increasing incorporation of pea flour in ready-to-eat meals and snacks by major manufacturers complements both direct and indirect distribution channels, creating a robust market ecosystem.
Canada Pea Flour Market Insight
Canada is expected to witness the fastest growth rate in the North America pea flour market, supported by its position as the largest dry pea-producing nation globally and increasing consumer demand for sustainable, high-protein food options. The growth is prominent in both food and beverage and animal feed applications, with significant uptake in urban areas due to rising health consciousness and vegan diet adoption. Evolving regulations promoting clean-label and non-GMO products further encourage market penetration.
Pea Flour Market Share
The pea flour industry is primarily led by well-established companies, including:
- AGT Food and Ingredients (Canada)
- Bob's Red Mill Natural Foods (U.S.)
- Batory Foods (U.S.)
- Limagrain (France)
- Avena Foods, Limited (Canada)
- Barry Farm Foods (U.S.)
- Woodland Foods (United States)
- Ingredion Incorporated (U.S.)
- ADM (United States)
- Anchor Ingredients (U.S.)
- Hearthy Foods (U.S.)
- PAULA Ingredients (Poland)
- K2 Milling (Canada)
- Harvest Innovations (U.S.)
- Nutri-Pea Limited (Canada)
What are the Recent Developments in North America Pea Flour Market?
- In July 2024, Ingredion Incorporated launched Vitessence Pea 100 HD, a new high-density pea protein product enhanced for cold-pressed bars, targeting the U.S. and Canadian markets. This innovative product underscores Ingredion’s commitment to meeting the growing demand for plant-based, high-protein snacks, offering manufacturers a versatile ingredient to create nutritious, consumer-friendly products
- In June 2024, Lovingly Made Flour Mills, TMRW Foods, and Dutton Farms announced a strategic collaboration to enhance the value of Canadian pea and fava crops for the North American market. This partnership aims to develop innovative pea flour-based products, leveraging combined expertise to drive sustainable ingredient solutions and meet consumer demand for plant-based foods
- In March 2023, Nepra Foods entered into a manufacturing and distribution partnership with Scoular to produce specialized plant-based products, including pea flour derivatives, for the North American market. This collaboration leverages Nepra’s R&D capabilities and Scoular’s robust supply chain to expand product offerings, enhancing market reach and innovation in plant-based ingredients
- In February 2023, Roquette Frères expanded its pea processing facility in Canada through a strategic investment, boosting production capacity for pea flour and related ingredients. This expansion strengthens Roquette’s position in the North American pea flour market, addressing the rising demand for gluten-free and plant-based ingredients in food applications
- In November 2022, Global Food and Ingredients Ltd. launched the Pulsera ingredients brand in Canada, featuring an 85% pea protein isolate derived from pea flour. This product launch aligns with the company’s goal of diversifying its portfolio, offering functional, plant-based ingredients to meet the growing consumer preference for sustainable nutrition in North America
SKU-

- Interactive Data Analysis Dashboard
- Company Analysis Dashboard for high growth potential opportunities
- Research Analyst Access for customization & queries
- Competitor Analysis with Interactive dashboard
- Latest News, Updates & Trend analysis
- Harness the Power of Benchmark Analysis for Comprehensive Competitor Tracking
North America Pea Flour Market, Supply Chain Analysis and Ecosystem Framework
To support market growth and help clients navigate the impact of geopolitical shifts, DBMR has integrated in-depth supply chain analysis into its North America Pea Flour Market research reports. This addition empowers clients to respond effectively to global changes affecting their industries. The supply chain analysis section includes detailed insights such as North America Pea Flour Market consumption and production by country, price trend analysis, the impact of tariffs and geopolitical developments, and import and export trends by country and HSN code. It also highlights major suppliers with data on production capacity and company profiles, as well as key importers and exporters. In addition to research, DBMR offers specialized supply chain consulting services backed by over a decade of experience, providing solutions like supplier discovery, supplier risk assessment, price trend analysis, impact evaluation of inflation and trade route changes, and comprehensive market trend analysis.
Data collection and base year analysis are done using data collection modules with large sample sizes. The stage includes obtaining market information or related data through various sources and strategies. It includes examining and planning all the data acquired from the past in advance. It likewise envelops the examination of information inconsistencies seen across different information sources. The market data is analysed and estimated using market statistical and coherent models. Also, market share analysis and key trend analysis are the major success factors in the market report. To know more, please request an analyst call or drop down your inquiry.
The key research methodology used by DBMR research team is data triangulation which involves data mining, analysis of the impact of data variables on the market and primary (industry expert) validation. Data models include Vendor Positioning Grid, Market Time Line Analysis, Market Overview and Guide, Company Positioning Grid, Patent Analysis, Pricing Analysis, Company Market Share Analysis, Standards of Measurement, Global versus Regional and Vendor Share Analysis. To know more about the research methodology, drop in an inquiry to speak to our industry experts.
Data Bridge Market Research is a leader in advanced formative research. We take pride in servicing our existing and new customers with data and analysis that match and suits their goal. The report can be customized to include price trend analysis of target brands understanding the market for additional countries (ask for the list of countries), clinical trial results data, literature review, refurbished market and product base analysis. Market analysis of target competitors can be analyzed from technology-based analysis to market portfolio strategies. We can add as many competitors that you require data about in the format and data style you are looking for. Our team of analysts can also provide you data in crude raw excel files pivot tables (Fact book) or can assist you in creating presentations from the data sets available in the report.


