
North America Potassium Sulfate Fertilizers Market
Market Size in USD Million
 USD
759.11 Million
USD
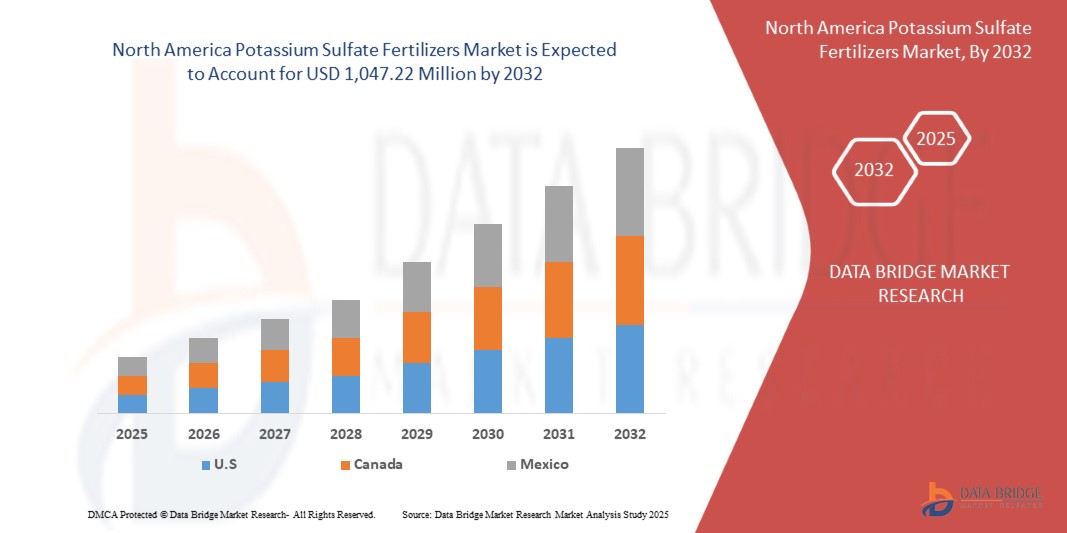
1,047.22 Million
2024
2032
USD
759.11 Million
USD
1,047.22 Million
2024
2032
| 2025 - 2032 | |
| USD 759.11 Million | |
| USD 1,047.22 Million | |
| % | |
|
Potassium Sulfate Fertilizers Market Size
- The North America potassium sulfate fertilizers market size was valued at USD 759.11 million in 2024 and is expected to reach USD 1,047.22 million by 2032, at a CAGR of 4.1% during the forecast period
- The market growth is largely fueled by the rising demand for chloride free fertilizers in high value crop cultivation
- Furthermore, growing shift toward sustainable and organic agriculture worldwide, precision farming adoption boosts need for water soluble nutrient fertilizers are significantly boosting the industry's growth
Potassium Sulfate Fertilizers Market Analysis
- Potassium sulfate fertilizers are gaining prominence due to their vital role in improving crop yield and quality, especially for chloride-sensitive crops such as fruits, vegetables, nuts, and tobacco, where excess chloride can harm growth and reduce market value
- The increasing demand for high-value specialty crops, coupled with rising awareness about balanced nutrient management and the benefits of chloride-free fertilizers, is driving the global adoption of potassium sulfate fertilizers
- U.S. is expected to dominate the potassium sulfate fertilizers market, holding the largest revenue share of 82.99% in 2025, attributed to the region’s extensive agricultural production, rising demand for high-value crops, and increasing adoption of modern fertilization practices
- U.S. is also projected to be the fastest-growing region in the market during the forecast period, driven by population growth, supportive government initiatives to enhance crop productivity, and expanding awareness of chloride-free fertilizers among farmers
- The granular segment is expected to dominate the potassium sulfate fertilizers market with a market share of 59.68% in 2025, owing to its ease of application, longer shelf life, and suitability for a wide range of crops and soil types
Report Scope and Potassium Sulfate Fertilizers Market Segmentation
|
Attributes |
Potassium Sulfate Fertilizers Key Market Insights |
|
Segments Covered |
|
|
Countries Covered |
North America
|
|
Key Market Players |
|
|
Market Opportunities |
|
|
Value Added Data Infosets |
In addition to the insights on market scenarios such as market value, growth rate, segmentation, geographical coverage, and major players, the market reports curated by the Data Bridge Market Research also include import export analysis, production capacity overview, production consumption analysis, price trend analysis, climate change scenario, supply chain analysis, value chain analysis, raw material/consumables overview, vendor selection criteria, PESTLE Analysis, Porter Analysis, and regulatory framework. |
Potassium Sulfate Fertilizers Market Trends
“Rising Demand for High-Quality Crops and Sustainable Agriculture”
- A major driving force behind the North America potassium sulfate fertilizers market is the growing demand for high-quality fruits, vegetables, and cash crops, driven by shifting dietary preferences, urbanization, and rising disposable incomes across the globe
- For instance, in March 2025, a report from FAO highlighted that global consumption of fruits and vegetables is projected to increase by over 20% by 2030, spurring the need for fertilizers that enhance crop yield, quality, and resilience without harmful chloride content
- Potassium sulfate (SOP) is especially favored in the cultivation of chloride-sensitive crops such as tobacco, potatoes, grapes, and citrus fruits, as it promotes better taste, color, and shelf life while supporting plant resistance to drought and disease
- Additionally, the increasing adoption of sustainable farming practices and precision agriculture techniques globally is encouraging farmers to use SOP fertilizers, which have a lower environmental footprint compared to alternatives containing chloride or excessive nitrogen.
- In January 2025, a UN Environment Programme study emphasized the critical role of balanced fertilization, including potassium sulfate, in achieving Sustainable Development Goals (SDGs) related to food security, soil health, and climate resilience
Potassium Sulfate Fertilizers Market Dynamics
Driver
“Rising Demand for Chloride Free Fertilizers in High Value Crop Cultivation”
- The shift toward high-value horticultural crops such as fruits, vegetables, nuts, and tobacco is fueling the need for specialized, crop-friendly nutrients that do not compromise soil health or yield quality
- Among these, potassium sulfate (K₂SO₄) has gained strong traction due to its chloride-free nature, making it ideal for chloride-sensitive crops that are prone to yield and quality degradation when exposed to excess chloride ions
- For instance, in January 2025, American Society for Horticultural Science published an article that states, controlled-environment trials in vertical farms showed that increasing potassium concentration to 300–450 mg·L⁻¹ significantly improved leaf area, fruit yield, size, and quality of strawberries—highlighting the critical need for precise, chloride-free potassium sources in high-value systems
- Excessive chloride in soil has been linked to reduced sugar content in fruits, leaf burn in sensitive crops like strawberries and citrus, and deterioration of tobacco leaf texture. Unlike muriate of potash (KCl), which contains up to 47% chloride, potassium sulfate offers the dual benefit of supplying both potassium and sulfur—essential nutrients—without the risk of chloride toxicity
- As high-value crop cultivation continues to expand globally, the demand for chloride-free nutrient solutions, such as potassium sulfate, is accelerating. Its compatibility with sensitive crops, superior agronomic performance, and alignment with sustainable farming practices are collectively reinforcing its role as a preferred fertilizer choice, thereby driving significant growth in the North America potassium sulfate fertilizers market
Restraint/Challenge
“High Production Costs Limit Affordability for Small-Scale Farmers”
- The production of potassium sulfate (K₂SO₄) involves energy-intensive and costly processes such as the Mannheim process or complex natural extraction methods from minerals like kainite and schoenite
- These methods require high-temperature reactions and the handling of corrosive materials, such as sulfuric acid, resulting in elevated capital and operational expenses compared to conventional potassium chloride (KCl) fertilizers
- For instance, In March 2023, a Reuters report highlighted that during the 2022–2023 season, Zimbabwean farmers faced a nearly 30% surge in fertilizer prices, raising the price of a 50 kg bag from approximately USD 35 to approximately USD 45, forcing smallholders to reduce their usage or switch to homemade compost. Many were unable to afford the more expensive K₂SO₄, curbing its adoption among price-sensitive growers
- The elevated production and distribution costs of potassium sulfate significantly restrict its accessibility for small-scale and cost-sensitive farmers. This limits broader adoption, particularly in regions where affordability is a key factor in fertilizer selection
Potassium Sulfate Fertilizers Market Scope
The market is segmented into three notable segments based on form, crop type, and end user.
- By Form
On the basis of form, the market is segmented into granular, powdered, and liquid. In 2025, the granular segment is expected to dominate the market due to its ease of application, better handling and storage properties, and widespread suitability for large-scale agricultural practices across diverse crop types.
The granular segment is anticipated to witness the fastest growth rate of 4.3% from 2025 to 2032, fueled by its ease of application, uniform nutrient distribution, cost-effectiveness for large-scale farming, and rising preference among growers for efficient nutrient management..
- By Crop Type
On the basis of crop type, the market is segmented into fruits, vegetables, cereals & grains, oilseeds, pulses, and turf & ornamentals. in 2025, the fruits segment is expected to dominate the market due to the high demand for potassium sulfate in fruit cultivation, as it enhances fruit quality, improves shelf life, and supports optimal yield without adding excess chloride harmful to sensitive crops.
The fruits segment is expected to witness the fastest CAGR from 2025 to 2032, driven by rising consumer demand for premium-quality produce, increasing export-oriented cultivation, and the need for chloride-free fertilizers to enhance taste, color, and shelf life.
- By End User
On the basis of end user, the market is segmented into commercial farming, horticulture, greenhouse, and household. In 2025, the commercial farming segment is expected to dominate the market due to its critical role in large-scale crop production, where potassium sulfate delivers essential potassium and sulfur nutrients efficiently, catering to the rising global food demand and sustainable agricultural practices.
The commercial farming segment is expected to witness the fastest CAGR from 2025 to 2032, favored for its large-scale adoption of specialty fertilizers to maximize yield, improve crop quality, and meet growing demand for high-value produce.
Potassium Sulfate Fertilizers Market Regional Analysis
- U.S. dominates the potassium sulfate fertilizers market with the largest revenue share of 82.99% and is projected to grow at the fastest CAGR of 4.3% in 2025, driven by expanding high-value crop cultivation, increasing adoption of chloride-free fertilizers, supportive government subsidies, and growing awareness among farmers about improving crop quality and yield sustainably
- The country strong regulatory framework, targeted agricultural development programs, and presence of major market players such as K+S Kali GmbH, Compass Minerals, and Yara International contribute to leadership in potassium sulfate fertilizer production and distribution
- Major economies such as U.S. and Canada are investing heavily in modernizing agricultural practices, promoting balanced fertilization, and improving access to high-quality fertilizers to boost productivity in horticulture and cash crops
Canada Potassium Sulfate Fertilizers Market Insight
Canada is expected to register a significant CAGR in the region from 2025 to 2032, driven by increased adoption of specialty fertilizers for horticulture, rising awareness about soil salinity management, and supportive policies promoting balanced nutrient application. Collaborations with global fertilizer manufacturers and research institutions are strengthening Canada’s potassium sulfate supply capabilities.
Potassium Sulfate Fertilizers Market Share
The potassium sulfate fertilizers industry is primarily led by well-established companies, including:
- Yara (Norway)
- K+S Aktiengesellschaft (Germany)
- ICL (Israel)
- Ameropa AG (Switzerland)
- SQM S.A. (Chile)
- Haifa Negev Technologies LTD (Israel)
- Hebei Sanyuanjiuqi Fertilizer Co., Ltd. (China)
- Utkarsh Agrochem (India)
- KSM Inc. (Canada)
Latest Developments in Potassium Sulfate Fertilizers Market
- In November 2024, Petrobras and Yara have signed two agreements in a next step towards structuring a potential partnership within fertilizers and industrial products, both based on resumed production in Araucaria Nitrogenados S.A. (ANSA), a wholly-owned subsidiary of Petrobas
- In October 2024, the management of Yara Tertre has informed workers representatives of Yara’s intention to transform the site. The proposed transformation would entail closure of the ammonia unit and shifting production towards the site’s most competitive products, premium nitrate fertilizers and industrial nitrogen chemicals
- In July 2024, Yara and ATOME PLC, a leading developer of international green fertilizer projects, sign Heads of Terms for offtake from ATOME’s renewable CAN project in Villeta, Paraguay. The Heads of Terms covers the long-term supply of all of the Calcium Ammonium Nitrate from ATOME’s renewable production facility in Villeta, Paraguay
- In July 2024, PepsiCo Europe and Yara announced today a long-term partnership in Europe aimed at providing farmers with crop nutrition programs to help decarbonize the food value chain. As part of the partnership, which spans multiple countries, participating PepsiCo Europe farmers will be equipped with best-in-class crop nutrition products and advice as well as precision farming digital tools
- In January 2025, K+S Aktiengesellschaft introduced its C:LIGHT line potassium and magnesium fertilizers produced using power-to-heat (PtH) tech, enabling up to 90% lower CO₂ footprint compared to traditional products. Up to 90% lower CO₂ emissions gives K+S a significant first-mover advantage in green fertilizer production. It improves their ESG (Environmental, Social, Governance) scores, making them more attractive to sustainability-focused investors and partners
SKU-

- Interactive Data Analysis Dashboard
- Company Analysis Dashboard for high growth potential opportunities
- Research Analyst Access for customization & queries
- Competitor Analysis with Interactive dashboard
- Latest News, Updates & Trend analysis
- Harness the Power of Benchmark Analysis for Comprehensive Competitor Tracking
Table of Content
1 INTRODUCTION
1.1 OBJECTIVES OF THE STUDY
1.2 MARKET DEFINITION
1.3 OVERVIEW
1.4 LIMITATIONS
1.5 MARKETS COVERED
2 MARKET SEGMENTATION
2.1 MARKETS COVERED
2.2 GEOGRAPHICAL SCOPE
2.3 YEARS CONSIDERED FOR THE STUDY
2.4 CURRENCY AND PRICING
2.5 DBMR TRIPOD DATA VALIDATION MODEL
2.6 MULTIVARIATE MODELING
2.7 PRIMARY INTERVIEWS WITH KEY OPINION LEADERS
2.8 DBMR MARKET POSITION GRID
2.9 DBMR VENDOR SHARE ANALYSIS
2.1 MARKET END USER COVERAGE GRID
2.11 SECONDARY SOURCES
2.12 ASSUMPTIONS
3 EXECUTIVE SUMMARY
4 PREMIUM INSIGHTS
4.1 PORTER’S FIVE FORCE MODEL
4.2 SUPPLY CHAIN ANALYSIS
4.2.1 RAW MATERIAL SOURCING
4.2.2 PRODUCTION AND MANUFACTURING
4.2.3 STORAGE AND PACKAGING
4.2.4 DISTRIBUTION AND LOGISTICS
4.2.5 RETAIL AND END USERS
4.2.6 REGULATORY AND SUSTAINABILITY FACTORS
4.2.7 CONCLUSION
4.3 PRODUCTION CONSUMPTION ANALYSIS
4.4 SWOT ANALYSIS:
4.5 PRICING ANALYSIS
4.6 COMPANY EVALUATION QUADRANT
4.6.1 MARGIN RANGE BY PRODUCT TYPE
4.6.2 DOMINANT PLAYERS
4.6.3 EMERGING PLAYERS
4.6.4 PARTICIPANTS
4.7 CONSUMER BUYING BEHAVIOUR
4.7.1 FUNCTIONAL AND CROP-SPECIFIC DEMAND
4.7.2 PRICE SENSITIVITY AND ECONOMIC CONSTRAINTS
4.7.3 INFLUENCE OF EDUCATION AND AWARENESS
4.7.4 DISTRIBUTION CHANNELS AND BRAND LOYALTY
4.7.5 CONCLUSION
4.8 COST ANALYSIS BREAKDOWN
4.8.1 RAW MATERIALS
4.8.2 ENERGY CONSUMPTION
4.8.3 LABOR AND OPERATIONAL COSTS
4.8.4 RESEARCH AND DEVELOPMENT
4.9 FACTORS INFLUENCING BUYING DECISION OF END USERS IN THE NORTH AMERICA POTASSIUM SULFATE FERTILIZER MARKET
4.9.1 CROP-SPECIFIC NUTRITIONAL NEEDS
4.9.2 NUTRIENT QUALITY AND PRODUCT CONSISTENCY
4.9.3 AGRONOMIC ADVISORY AND PEER INFLUENCE
4.9.4 PRICE SENSITIVITY AND AFFORDABILITY
4.9.5 SUPPLIER REPUTATION AND REGIONAL AVAILABILITY
4.9.6 PACKAGING, TRANSPORTATION, AND HANDLING
4.9.7 ENVIRONMENTAL REGULATIONS AND SUSTAINABILITY GOALS
4.9.8 MARKETING, EDUCATION, AND EXTENSION SERVICES
4.9.9 CONCLUSION
4.1 IMPACT OF ECONOMIC SLOWDOWN ON THE NORTH AMERICA POTASSIUM SULFATE FERTILIZERS MARKET
4.11 INDUSTRY ECOSYSTEM ANALYSIS OF THE NORTH AMERICA POTASSIUM SULFATE FERTILIZERS MARKET
4.12 INNOVATION TRACKER AND STRATEGIC ANALYSIS–
4.12.1 MAJOR DEALS AND STRATEGIC ALLIANCES ANALYSIS
4.12.1.1 JOINT VENTURES
4.12.1.2 MERGERS AND ACQUISITIONS
4.12.1.3 LICENSING AND PARTNERSHIP
4.12.1.4 TECHNOLOGY COLLABORATIONS
4.12.1.5 STRATEGIC DIVESTMENTS
4.12.1.6 NUMBER OF PRODUCTS IN DEVELOPMENT
4.12.2 STAGE OF DEVELOPMENT
4.12.3 INNOVATION STRATEGIES AND METHODOLOGIES
4.12.4 RISK ASSESSMENT AND MITIGATION
4.12.5 FUTURE OUTLOOK
4.13 PATENT ANALYSIS
4.13.1 PATENT QUALITY AND STRENGTH
4.13.2 PATENT FAMILIES
4.13.3 LICENSING AND COLLABORATIONS
4.13.4 COMPANY PATENT LANDSCAPE
4.13.5 REGION PATENT LANDSCAPE
4.13.6 IP STRATEGY AND MANAGEMENT
4.13.7 SUMMARY OF PATENT TRENDS AND INSIGHTS
4.14 PRODUCT ADOPTION SCENARIO
4.14.1 OVERVIEW
4.14.2 PRODUCT AWARENESS
4.14.3 PRODUCT INTEREST
4.14.4 PRODUCT EVALUATION
4.14.5 PRODUCT TRIAL
4.14.6 PRODUCT ADOPTION
4.14.7 CONCLUSION
4.15 PRODUCTION CAPACITY OUTLOOK
4.15.1 CAPACITY EXPANSION AND MODERNIZATION
4.15.2 STRATEGIC RESOURCE UTILIZATION
4.15.3 SUSTAINABILITY AND REGULATORY COMPLIANCE
4.15.4 AUTOMATION AND PROCESS OPTIMIZATION
4.15.5 STRATEGIC PARTNERSHIPS AND NORTH AMERICA EXPANSION
4.15.6 CONCLUSION
4.16 PROFIT MARGINS SCENARIO
4.16.1 MARGIN RANGE BY PRODUCT TYPE
4.16.2 KEY FACTORS INFLUENCING MARGINS
4.16.3 DOMESTIC VS. EXPORT MARKET MARGINS
4.17 RAW MATERIAL SOURCING ANALYSIS
4.17.1 POTASSIUM CHLORIDE (MOP)
4.17.2 SULFURIC ACID
4.17.3 LANGBEINITE / SULFATE MINERALS
4.17.4 BRINE SOURCES / SALT LAKE DEPOSITS
4.18 TARIFFS AND THEIR IMPACT ON THE MARKET
4.18.1 CURRENT TARIFF RATES IN TOP-5 COUNTRY MARKETS
4.18.2 OUTLOOK: LOCAL PRODUCTION V/S IMPORT RELIANCE
4.18.3 VENDOR SELECTION CRITERIA DYNAMICS
4.19 IMPACT ON SUPPLY CHAIN
4.19.1 RAW MATERIAL PROCUREMENT
4.19.2 MANUFACTURING AND VALUE ADDITION
4.19.3 LOGISTICS AND DISTRIBUTION
4.19.4 PRICE PITCHING AND POSITION OF MARKET
4.2 INDUSTRY PARTICIPANTS: PROACTIVE MOVES
4.20.1 SUPPLY CHAIN REALIGNMENT
4.20.2 LOCAL PROCESSING INITIATIVES
4.21 REGULATORY INCLINATION
4.21.1 FTA-DRIVEN TARIFF RELIEF
4.21.2 INDUSTRIAL INCENTIVES
5 REGULATION COVERAGE
6 MARKET OVERVIEW
6.1 DRIVERS
6.1.1 RISING DEMAND FOR CHLORIDE FREE FERTILIZERS IN HIGH VALUE CROP CULTIVATION
6.1.2 GROWING SHIFT TOWARD SUSTAINABLE AND ORGANIC AGRICULTURE WORLDWIDE
6.1.3 PRECISION FARMING ADOPTION BOOSTS NEED FOR WATER SOLUBLE NUTRIENT FERTILIZERS
6.1.4 GOVERNMENT SUBSIDIES AND INITIATIVES SUPPORT SPECIALTY FERTILIZER USAGE
6.2 RESTRAINTS
6.2.1 HIGH PRODUCTION COSTS LIMIT AFFORDABILITY FOR SMALL-SCALE FARMERS
6.2.2 LIMITED AVAILABILITY OF NATURAL RESOURCES FOR POTASSIUM EXTRACTION
6.3 OPPORTUNITIES
6.3.1 RISING ADOPTION OF POTASSIUM SULFATE IN HYDROPONIC FARMING SYSTEMS
6.3.2 DIGITAL AGRICULTURE PLATFORMS AND E-COMMERCE DISTRIBUTION
6.3.3 DEVELOPMENT OF ENVIRONMENTALLY FRIENDLY, SLOW-RELEASE POTASSIUM FERTILIZER SOLUTIONS
6.4 CHALLENGES
6.4.1 COMPLEX PRODUCTION PROCESS RESTRICTS LARGE-SCALE MANUFACTURING CAPABILITY
6.4.2 VOLATILE RAW MATERIAL PRICES IMPACT PROFIT MARGINS AND SUPPLY
7 NORTH AMERICA POTASSIUM SULFATE FERTILIZERS MARKET, BY FORM
7.1 OVERVIEW
7.2 GRANULAR
7.3 POWDERED
7.4 LIQUID
8 NORTH AMERICA POTASSIUM SULFATE FERTILIZERS MARKET, BY CROP TYPE
8.1 OVERVIEW
8.2 FRUITS
8.3 VEGETABLES
8.4 CEREALS & GRAINS
8.5 OILSEEDS
8.6 PULSES
8.7 TURF & ORNAMENTALS
9 NORTH AMERICA POTASSIUM SULFATE FERTILIZERS MARKET, BY END USER
9.1 OVERVIEW
9.2 COMMERCIAL FARMING
9.3 HORTICULTURE
9.4 GREENHOUSE
9.5 HOUSEHOLD
10 NORTH AMERICA POTASSIUM SULFATE FERTILIZERS MARKET, BY REGION
10.1 NORTH AMERICA
10.1.1 U.S
10.1.2 CANADA
10.1.3 MEXICO
11 NORTH AMERICA POTASSIUM SULFATE FERTILIZERS MARKET
11.1 COMPANY SHARE ANALYSIS: NORTH AMERICA
12 SWOT ANALYSIS
13 COMPANY PROFILE
13.1 YARA
13.1.1 COMPANY SNAPSHOT
13.1.2 REVENUE ANALYSIS
13.1.3 COMPANY SHARE ANALYSIS
13.1.4 PRODUCT PORTFOLIO
13.1.5 RECENT DEVELOPMENTS/NEWS
13.2 K+S AKTIENGESELLSCHAFT
13.2.1 1.2.1 COMPANY SNAPSHOT
13.2.2 REVENUE ANALYSIS
13.2.3 COMPANY SHARA ANALYSIS
13.2.4 PRODUCT PORTFOLIO
13.2.5 RECENT DEVELOPMENT
13.3 ICL
13.3.1 COMPANY SNAPSHOT
13.3.2 REVENUE ANALYSIS
13.3.3 COMPANY SHARA ANALYSIS
13.3.4 PRODUCT PORTFOLIO
13.3.5 RECENT DEVELOPMENTS/NEWS
13.4 AMEROPA AG
13.4.1 COMPANY SNAPSHOT
13.4.2 COMPANY SHARA ANALYSIS
13.4.3 BUSINESS PORTFOLIO
13.4.4 RECENT DEVELOPMENT
13.5 SQM S.A.
13.5.1 COMPANY SNAPSHOT
13.5.2 REVENUE ANALYSIS
13.5.3 COMPANY SHARA ANALYSIS
13.5.4 PRODUCT PORTFOLIO
13.5.5 RECENT DEVELOPMENT
13.6 HAIFA NEGEV TECHNOLOGIES LTD
13.6.1 COMPANY SNAPSHOT
13.6.2 PRODUCT PORTFOLIO
13.6.3 RECENT DEVELOPMENTS/NEWS
13.7 HEBEI SANYUANJIUQI FERTILIZER CO., LTD.
13.7.1 COMPANY SNAPSHOT
13.7.2 PRODUCT PORTFOLIO
13.7.3 RECENT DEVELOPMENT
13.8 IFFCO
13.8.1 COMPANY SNAPSHOT
13.8.2 PRODUCT PORTFOLIO
13.8.3 RECENT DEVELOPMENTS/NEWS
13.9 KSM INC.
13.9.1 COMPANY SNAPSHOT
13.9.2 PRODUCT PORTFOLIO
13.9.3 RECENT DEVELOPMENT
13.1 UTKARSH AGROCHEM
13.10.1 COMPANY SNAPSHOT
13.10.2 PRODUCT PORTFOLIO
13.10.3 RECENT DEVELOPMENTS/NEWS
14 QUESTIONNAIRE
15 RELATED REPORTS
List of Table
TABLE 1 DEVELOPMENT STAGE OF COMPANIES
TABLE 2 RISK ASSESSMENT AND MITIGATION
TABLE 3 REGULATORY COVERAGE
TABLE 4 YEAR-WISE DETAILS OF FUNDS RELEASED UNDER PARAMPARAGAT KRISHI VIKAS YOJANA (PKVY) AND MISSION ORGANIC VALUE CHAIN DEVELOPMENT FOR NORTH EASTERN REGION (MOVCDNER) SCHEME FROM 2021-22 TO 2023-24
TABLE 5 NORTH AMERICA POTASSIUM SULFATE FERTILIZERS MARKET, BY FORM, 2018-2032 (USD THOUSAND)
TABLE 6 NORTH AMERICA POTASSIUM SULFATE FERTILIZERS MARKET, BY FORM, 2018-2032 (THOUSAND TONS)
TABLE 7 NORTH AMERICA GRANULAR IN POTASSIUM SULFATE FERTILIZERS MARKET, BY REGION, 2018-2032 (USD THOUSAND)
TABLE 8 NORTH AMERICA POWDERED IN POTASSIUM SULFATE FERTILIZERS MARKET, BY REGION, 2018-2032 (USD THOUSAND)
TABLE 9 NORTH AMERICA LIQUID IN POTASSIUM SULFATE FERTILIZERS MARKET, BY REGION, 2018-2032 (USD THOUSAND)
TABLE 10 NORTH AMERICA POTASSIUM SULFATE FERTILIZERS MARKET, BY CROP TYPE, 2018-2032 (USD THOUSAND)
TABLE 11 NORTH AMERICA FRUITS IN POTASSIUM SULFATE FERTILIZERS MARKET, BY REGION, 2018-2032 (USD THOUSAND)
TABLE 12 NORTH AMERICA FRUITS IN POTASSIUM SULFATE FERTILIZERS MARKET, BY TYPE, 2018-2032 (USD THOUSAND)
TABLE 13 NORTH AMERICA CITRUS IN POTASSIUM SULFATE FERTILIZERS MARKET, BY TYPE, 2018-2032 (USD THOUSAND)
TABLE 14 NORTH AMERICA VEGETABLES IN POTASSIUM SULFATE FERTILIZERS MARKET, BY REGION, 2018-2032 (USD THOUSAND)
TABLE 15 NORTH AMERICA VEGETABLES IN POTASSIUM SULFATE FERTILIZERS MARKET, BY TYPE, 2018-2032 (USD THOUSAND)
TABLE 16 NORTH AMERICA CEREALS & GRAINS IN POTASSIUM SULFATE FERTILIZERS MARKET, BY REGION, 2018-2032 (USD THOUSAND)
TABLE 17 NORTH AMERICA CEREALS & GRAINS IN POTASSIUM SULFATE FERTILIZERS MARKET, BY TYPE, 2018-2032 (USD THOUSAND)
TABLE 18 NORTH AMERICA OILSEEDS IN POTASSIUM SULFATE FERTILIZERS MARKET, BY REGION, 2018-2032 (USD THOUSAND)
TABLE 19 NORTH AMERICA OILSEEDS IN POTASSIUM SULFATE FERTILIZERS MARKET, BY TYPE, 2018-2032 (USD THOUSAND)
TABLE 20 NORTH AMERICA PULSES IN POTASSIUM SULFATE FERTILIZERS MARKET, BY REGION, 2018-2032 (USD THOUSAND)
TABLE 21 NORTH AMERICA PULSES IN POTASSIUM SULFATE FERTILIZERS MARKET, BY TYPE, 2018-2032 (USD THOUSAND)
TABLE 22 NORTH AMERICA PEAS IN POTASSIUM SULFATE FERTILIZERS MARKET, BY TYPE, 2018-2032 (USD THOUSAND)
TABLE 23 NORTH AMERICA TURF & ORNAMENTALS IN POTASSIUM SULFATE FERTILIZERS MARKET, BY REGION, 2018-2032 (USD THOUSAND)
TABLE 24 NORTH AMERICA POTASSIUM SULFATE FERTILIZERS MARKET, BY END USER, 2018-2032 (USD THOUSAND)
TABLE 25 NORTH AMERICA COMMERCIAL FARMING IN POTASSIUM SULFATE FERTILIZERS MARKET, BY REGION, 2018-2032 (USD THOUSAND)
TABLE 26 NORTH AMERICA HORTICULTURE IN POTASSIUM SULFATE FERTILIZERS MARKET, BY REGION, 2018-2032 (USD THOUSAND)
TABLE 27 NORTH AMERICA GREENHOUSE IN POTASSIUM SULFATE FERTILIZERS MARKET, BY REGION, 2018-2032 (USD THOUSAND)
TABLE 28 NORTH AMERICA HOUSEHOLD IN POTASSIUM SULFATE FERTILIZERS MARKET, BY REGION, 2018-2032 (USD THOUSAND)
TABLE 29 NORTH AMERICA POTASSIUM SULFATE FERTILIZERS MARKET, BY COUNTRY, 2018-2032 (USD THOUSAND)
TABLE 30 NORTH AMERICA POTASSIUM SULFATE FERTILIZERS MARKET, BY COUNTRY, 2018-2032 (THOUSAND TONS)
TABLE 31 NORTH AMERICA POTASSIUM SULFATE FERTILIZERS MARKET, BY FORM, 2018-2032 (USD THOUSAND)
TABLE 32 NORTH AMERICA POTASSIUM SULFATE FERTILIZERS MARKET, BY FORM, 2018-2032 (THOUSAND TONS)
TABLE 33 NORTH AMERICA POTASSIUM SULFATE FERTILIZERS MARKET, BY CROP TYPE, 2018-2032 (USD THOUSAND)
TABLE 34 NORTH AMERICA FRUITS IN POTASSIUM SULFATE FERTILIZERS MARKET, BY TYPE, 2018-2032 (USD THOUSAND)
TABLE 35 NORTH AMERICA CITRUS IN POTASSIUM SULFATE FERTILIZERS MARKET, BY TYPE, 2018-2032 (USD THOUSAND)
TABLE 36 NORTH AMERICA VEGETABLES IN POTASSIUM SULFATE FERTILIZERS MARKET, BY TYPE, 2018-2032 (USD THOUSAND)
TABLE 37 NORTH AMERICA CEREALS & GRAINS IN POTASSIUM SULFATE FERTILIZERS MARKET, BY TYPE, 2018-2032 (USD THOUSAND)
TABLE 38 NORTH AMERICA OILSEEDS IN POTASSIUM SULFATE FERTILIZERS MARKET, BY TYPE, 2018-2032 (USD THOUSAND)
TABLE 39 NORTH AMERICA PULSES IN POTASSIUM SULFATE FERTILIZERS MARKET, BY TYPE, 2018-2032 (USD THOUSAND)
TABLE 40 NORTH AMERICA PEAS IN POTASSIUM SULFATE FERTILIZERS MARKET, BY TYPE, 2018-2032 (USD THOUSAND)
TABLE 41 NORTH AMERICA POTASSIUM SULFATE FERTILIZERS MARKET, BY END USER, 2018-2032 (USD THOUSAND)
TABLE 42 U.S. POTASSIUM SULFATE FERTILIZERS MARKET, BY FORM, 2018-2032 (USD THOUSAND)
TABLE 43 U.S. POTASSIUM SULFATE FERTILIZERS MARKET, BY FORM, 2018-2032 (THOUSAND TONS)
TABLE 44 U.S. POTASSIUM SULFATE FERTILIZERS MARKET, BY CROP TYPE, 2018-2032 (USD THOUSAND)
TABLE 45 U.S. FRUITS IN POTASSIUM SULFATE FERTILIZERS MARKET, BY TYPE, 2018-2032 (USD THOUSAND)
TABLE 46 U.S. CITRUS IN POTASSIUM SULFATE FERTILIZERS MARKET, BY TYPE, 2018-2032 (USD THOUSAND)
TABLE 47 U.S. VEGETABLES IN POTASSIUM SULFATE FERTILIZERS MARKET, BY TYPE, 2018-2032 (USD THOUSAND)
TABLE 48 U.S. CEREALS & GRAINS IN POTASSIUM SULFATE FERTILIZERS MARKET, BY TYPE, 2018-2032 (USD THOUSAND)
TABLE 49 U.S. OILSEEDS IN POTASSIUM SULFATE FERTILIZERS MARKET, BY TYPE, 2018-2032 (USD THOUSAND)
TABLE 50 U.S. PULSES IN POTASSIUM SULFATE FERTILIZERS MARKET, BY TYPE, 2018-2032 (USD THOUSAND)
TABLE 51 U.S. PEAS IN POTASSIUM SULFATE FERTILIZERS MARKET, BY TYPE, 2018-2032 (USD THOUSAND)
TABLE 52 U.S. POTASSIUM SULFATE FERTILIZERS MARKET, BY END USER, 2018-2032 (USD THOUSAND)
TABLE 53 CANADA POTASSIUM SULFATE FERTILIZERS MARKET, BY FORM, 2018-2032 (USD THOUSAND)
TABLE 54 CANADA POTASSIUM SULFATE FERTILIZERS MARKET, BY FORM, 2018-2032 (THOUSAND TONS)
TABLE 55 CANADA POTASSIUM SULFATE FERTILIZERS MARKET, BY CROP TYPE, 2018-2032 (USD THOUSAND)
TABLE 56 CANADA FRUITS IN POTASSIUM SULFATE FERTILIZERS MARKET, BY TYPE, 2018-2032 (USD THOUSAND)
TABLE 57 CANADA CITRUS IN POTASSIUM SULFATE FERTILIZERS MARKET, BY TYPE, 2018-2032 (USD THOUSAND)
TABLE 58 CANADA VEGETABLES IN POTASSIUM SULFATE FERTILIZERS MARKET, BY TYPE, 2018-2032 (USD THOUSAND)
TABLE 59 CANADA CEREALS & GRAINS IN POTASSIUM SULFATE FERTILIZERS MARKET, BY TYPE, 2018-2032 (USD THOUSAND)
TABLE 60 CANADA OILSEEDS IN POTASSIUM SULFATE FERTILIZERS MARKET, BY TYPE, 2018-2032 (USD THOUSAND)
TABLE 61 CANADA PULSES IN POTASSIUM SULFATE FERTILIZERS MARKET, BY TYPE, 2018-2032 (USD THOUSAND)
TABLE 62 CANADA PEAS IN POTASSIUM SULFATE FERTILIZERS MARKET, BY TYPE, 2018-2032 (USD THOUSAND)
TABLE 63 CANADA POTASSIUM SULFATE FERTILIZERS MARKET, BY END USER, 2018-2032 (USD THOUSAND)
TABLE 64 MEXICO POTASSIUM SULFATE FERTILIZERS MARKET, BY FORM, 2018-2032 (USD THOUSAND)
TABLE 65 MEXICO POTASSIUM SULFATE FERTILIZERS MARKET, BY FORM, 2018-2032 (THOUSAND TONS)
TABLE 66 MEXICO POTASSIUM SULFATE FERTILIZERS MARKET, BY CROP TYPE, 2018-2032 (USD THOUSAND)
TABLE 67 MEXICO FRUITS IN POTASSIUM SULFATE FERTILIZERS MARKET, BY TYPE, 2018-2032 (USD THOUSAND)
TABLE 68 MEXICO CITRUS IN POTASSIUM SULFATE FERTILIZERS MARKET, BY TYPE, 2018-2032 (USD THOUSAND)
TABLE 69 MEXICO VEGETABLES IN POTASSIUM SULFATE FERTILIZERS MARKET, BY TYPE, 2018-2032 (USD THOUSAND)
TABLE 70 MEXICO CEREALS & GRAINS IN POTASSIUM SULFATE FERTILIZERS MARKET, BY TYPE, 2018-2032 (USD THOUSAND)
TABLE 71 MEXICO OILSEEDS IN POTASSIUM SULFATE FERTILIZERS MARKET, BY TYPE, 2018-2032 (USD THOUSAND)
TABLE 72 MEXICO PULSES IN POTASSIUM SULFATE FERTILIZERS MARKET, BY TYPE, 2018-2032 (USD THOUSAND)
TABLE 73 MEXICO PEAS IN POTASSIUM SULFATE FERTILIZERS MARKET, BY TYPE, 2018-2032 (USD THOUSAND)
TABLE 74 MEXICO POTASSIUM SULFATE FERTILIZERS MARKET, BY END USER, 2018-2032 (USD THOUSAND)
List of Figure
FIGURE 1 NORTH AMERICA POTASSIUM SULFATE FERTILIZERS MARKET
FIGURE 2 NORTH AMERICA POTASSIUM SULFATE FERTILIZERS MARKET: DATA TRIANGULATION
FIGURE 3 NORTH AMERICA POTASSIUM SULFATE FERTILIZERS MARKET: DROC ANALYSIS
FIGURE 4 NORTH AMERICA POTASSIUM SULFATE FERTILIZERS MARKET: NORTH AMERICA VS REGIONAL MARKET ANALYSIS
FIGURE 5 NORTH AMERICA POTASSIUM SULFATE FERTILIZERS MARKET: COMPANY RESEARCH ANALYSIS
FIGURE 6 NORTH AMERICA POTASSIUM SULFATE FERTILIZERS MARKET: MULTIVARIATE MODELLING
FIGURE 7 NORTH AMERICA POTASSIUM SULFATE FERTILIZERS MARKET: INTERVIEW DEMOGRAPHICS
FIGURE 8 NORTH AMERICA POTASSIUM SULFATE FERTILIZERS MARKET: DBMR MARKET POSITION GRID
FIGURE 9 NORTH AMERICA POTASSIUM SULFATE FERTILIZERS MARKET: VENDOR SHARE ANALYSIS
FIGURE 10 NORTH AMERICA POTASSIUM SULFATE FERTILIZERS MARKET: MARKET END USER COVERAGE GRID
FIGURE 11 NORTH AMERICA POTASSIUM SULFATE FERTILIZERS MARKET: SEGMENTATION
FIGURE 12 NORTH AMERICA POTASSIUM SULFATE FERTILIZERS MARKET: EXECUTIVE SUMMARY
FIGURE 13 THREE SEGMENTS COMPRISE THE NORTH AMERICA POTASSIUM SULFATE FERTILIZERS MARKET: BY FORM
FIGURE 14 NORTH AMERICA POTASSIUM SULFATE FERTILIZERS MARKET: STRATEGIC DECISIONS
FIGURE 15 RISING DEMAND FOR CHLORIDE FREE FERTILIZERS IN HIGH VALUE CROP CULTIVATION IS EXPECTED TO DRIVE THE NORTH AMERICA POTASSIUM SULFATE FERTILIZERS MARKET IN THE FORECAST PERIOD OF 2025 TO 2032
FIGURE 16 THE GRANULAR SEGMENT IS EXPECTED TO ACCOUNT FOR THE LARGEST SHARE OF THE NORTH AMERICA POTASSIUM SULFATE FERTILIZERS MARKET IN 2025 AND 2032
FIGURE 17 PORTER’S FIVE FORCES
FIGURE 18 PRODUCTION CONSUMPTION ANALYSIS: NORTH AMERICA POTASSIUM SULFATE FERTILIZER MARKET
FIGURE 19 NORTH AMERICA POTASSIUM SULFATE FERTILIZERS MARKET, 2025-2032, AVERAGE SELLING PRICE (USD/KG)
FIGURE 20 NUMBER OF PATENT VS PUBLISHING YEARS
FIGURE 21 NUMBER OF PATENTS BY APPLICANTS
FIGURE 22 NUMBER OF PATENTS BY COUNTRY
FIGURE 23 PRODUCT ADOPTION SCENARIO
FIGURE 24 DRIVERS, RESTRAINTS, OPPORTUNITIES AND CHALLENGES FOR THE NORTH AMERICA POTASSIUM SULFATE FERTILIZERS MARKET
FIGURE 25 ORGANIC FARMING BY COUNTRY (2025)
FIGURE 26 AGRITECH COMPANIES RECEIVED INVESTMENTS (2000-2021)
FIGURE 27 LEVEL OF INVESTMENT (PAST 5 YEARS)
FIGURE 28 NORTH AMERICA POTASSIUM SULFATE FERTILIZERS MARKET: BY FORM, 2024
FIGURE 29 NORTH AMERICA POTASSIUM SULFATE FERTILIZERS MARKET: BY CROP TYPE, 2024
FIGURE 30 NORTH AMERICA POTASSIUM SULFATE FERTILIZERS MARKET: BY END USER, 2024
FIGURE 31 NORTH AMERICA POTASSIUM SULFATE FERTILIZERS MARKET: SNAPSHOT (2024)
FIGURE 32 NORTH AMERICA POTASSIUM SULFATE FERTILIZERS MARKET: COMPANY SHARE 2024 (%)
Data collection and base year analysis are done using data collection modules with large sample sizes. The stage includes obtaining market information or related data through various sources and strategies. It includes examining and planning all the data acquired from the past in advance. It likewise envelops the examination of information inconsistencies seen across different information sources. The market data is analysed and estimated using market statistical and coherent models. Also, market share analysis and key trend analysis are the major success factors in the market report. To know more, please request an analyst call or drop down your inquiry.
The key research methodology used by DBMR research team is data triangulation which involves data mining, analysis of the impact of data variables on the market and primary (industry expert) validation. Data models include Vendor Positioning Grid, Market Time Line Analysis, Market Overview and Guide, Company Positioning Grid, Patent Analysis, Pricing Analysis, Company Market Share Analysis, Standards of Measurement, Global versus Regional and Vendor Share Analysis. To know more about the research methodology, drop in an inquiry to speak to our industry experts.
Data Bridge Market Research is a leader in advanced formative research. We take pride in servicing our existing and new customers with data and analysis that match and suits their goal. The report can be customized to include price trend analysis of target brands understanding the market for additional countries (ask for the list of countries), clinical trial results data, literature review, refurbished market and product base analysis. Market analysis of target competitors can be analyzed from technology-based analysis to market portfolio strategies. We can add as many competitors that you require data about in the format and data style you are looking for. Our team of analysts can also provide you data in crude raw excel files pivot tables (Fact book) or can assist you in creating presentations from the data sets available in the report.


