
North America Third Party Risk Management Market
Market Size in USD Billion
 USD
3.09 Billion
USD
11.69 Billion
2025
2033
USD
3.09 Billion
USD
11.69 Billion
2025
2033
| 2026 - 2033 | |
| USD 3.09 Billion | |
| USD 11.69 Billion | |
| % | |
|
North America Third Party Risk Management Market Size
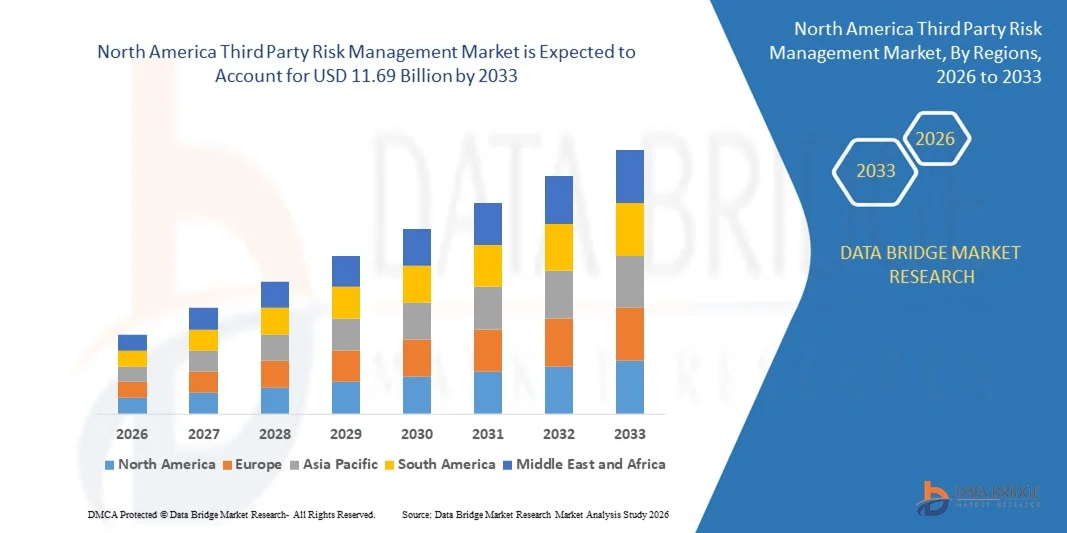
- The North America third party risk management market size was valued at USD 3.09 billion in 2025 and is expected to reach USD 11.69 billion by 2033, at a CAGR of 18.10% during the forecast period
- The market growth is largely fuelled by the increasing reliance of organizations on third-party vendors and suppliers. Companies are outsourcing critical operations, making it essential to monitor and manage associated risks effectively
- Growing regulatory compliance requirements and standards for data security and privacy are driving organizations to adopt robust TPRM solutions. Regulations such as GDPR, SOX, and others compel firms to ensure third-party compliance
North America Third Party Risk Management Market Analysis
- The market is witnessing rapid adoption across various industries due to the need for enhanced risk visibility and governance. Businesses aim to safeguard operations, finances, and reputation by proactively managing third-party risks
- Advances in AI, machine learning, and automation are driving the development of more sophisticated risk assessment solutions. Predictive analytics and continuous monitoring are helping companies identify and address potential risks before they escalate
- U.S. dominated the third party risk management market with the largest revenue share of 42.3% in 2025, driven by extensive vendor networks, high regulatory scrutiny, and growing cybersecurity concerns
- Canada is expected to witness the highest compound annual growth rate (CAGR) in the North America third party risk management market due to growing regulatory compliance requirements, rising awareness of third-party risks, accelerated digital transformation initiatives, and increasing adoption of cloud-based and AI-enabled TPRM platforms for continuous vendor monitoring and risk mitigation
- The Solutions segment held the largest market revenue share in 2025, driven by the increasing adoption of automated vendor risk assessment, compliance monitoring, and reporting platforms across enterprises. Solution offerings help organizations centralize third-party risk data, streamline vendor onboarding, and enhance real-time risk visibility, making them a preferred choice for enterprises managing complex vendor ecosystems
Report Scope and North America Third Party Risk Management Market Segmentation
|
Attributes |
North America Third Party Risk Management Key Market Insights |
|
Segments Covered |
|
|
Countries Covered |
North America
|
|
Key Market Players |
|
|
Market Opportunities |
|
|
Value Added Data Infosets |
In addition to the market insights such as market value, growth rate, market segments, geographical coverage, market players, and market scenario, the market report curated by the Data Bridge Market Research team includes in-depth expert analysis, import/export analysis, pricing analysis, production consumption analysis, and pestle analysis. |
North America Third Party Risk Management Market Trends
Rising Focus on Regulatory Compliance and Cybersecurity
- The increasing complexity of supply chains and reliance on third-party vendors is significantly shaping the third party risk management (TPRM) market, as organizations prioritize mitigation of operational, financial, and reputational risks. TPRM solutions are gaining traction due to their ability to enhance vendor oversight, monitor compliance, and ensure business continuity without disrupting core operations. This trend strengthens adoption across banking, healthcare, manufacturing, and IT sectors, encouraging service providers to innovate with automated, AI-driven risk assessment tools
- Growing awareness around cybersecurity threats, regulatory scrutiny, and operational resilience has accelerated demand for TPRM solutions in critical industries. Risk-conscious organizations are actively seeking platforms that provide real-time monitoring, risk scoring, and continuous compliance checks, prompting solution providers to expand features and integrate predictive analytics for proactive risk mitigation
- Compliance and transparency trends are influencing vendor selection decisions, with organizations emphasizing data privacy, regulatory adherence, and audit readiness. These factors are helping enterprises reduce exposure to financial and reputational losses while also driving the adoption of standardized risk frameworks and certification programs. Companies are increasingly using training programs and awareness campaigns to reinforce best practices and vendor accountability
- For instance, in 2024, leading organizations in the financial services and healthcare sectors enhanced their TPRM programs by incorporating AI-driven monitoring and automated compliance reporting. These initiatives were introduced in response to rising regulatory expectations and heightened cyber risks, with deployment across enterprise-wide operations. The solutions were also marketed as strategic tools to strengthen governance and operational resilience, improving stakeholder confidence and organizational trust
- While demand for TPRM solutions is growing, sustained market expansion depends on continuous innovation, cost-effective deployment, and integration with existing enterprise systems. Vendors are also focusing on scalability, data security, and developing intuitive platforms that balance risk coverage, operational efficiency, and regulatory compliance for broader adoption
North America Third Party Risk Management Market Dynamics
Driver
Growing Need for Regulatory Compliance and Operational Resilience
- Rising organizational reliance on third-party vendors and increasing regulatory mandates is a major driver for the TPRM market. Companies are adopting comprehensive risk management programs to monitor vendor performance, ensure compliance with industry standards, and mitigate operational disruptions. This trend also fuels investment in automated and AI-based risk assessment solutions to support more proactive risk management
- Expanding applications in financial services, healthcare, manufacturing, and IT sectors are influencing market growth. TPRM solutions help organizations identify, assess, and mitigate operational, cybersecurity, and compliance risks associated with third-party engagements, enabling enterprises to maintain business continuity while meeting governance requirements
- Solution providers and consultants are actively promoting TPRM adoption through integrated platforms, analytics-driven insights, and compliance reporting capabilities. These efforts are supported by increasing regulatory scrutiny and stakeholder demand for transparency, which also encourage partnerships between technology vendors and service providers to strengthen risk intelligence and operational efficiency
- For instance, in 2023, global financial and technology firms implemented enhanced TPRM platforms to streamline vendor onboarding, monitor risk metrics, and automate compliance reporting. These deployments were driven by rising regulatory pressure, growing cyber threats, and the need to maintain operational resilience. The organizations highlighted risk reduction and regulatory adherence in internal and external communications to reinforce stakeholder confidence
- Although regulatory and operational risk trends support growth, wider adoption depends on cost optimization, integration with enterprise systems, and user-friendly deployment. Investment in automated monitoring, AI analytics, and vendor collaboration tools will be critical for meeting enterprise needs and maintaining competitive advantage
Restraint/Challenge
High Implementation Costs and Limited Awareness
- The relatively high cost of TPRM solutions compared to traditional vendor oversight methods remains a key challenge, limiting adoption among cost-sensitive organizations. Subscription fees, software customization, and integration expenses contribute to elevated costs. In addition, scaling solutions for large, global vendor networks can increase total expenditure
- Awareness of TPRM benefits remains uneven, particularly among small and mid-sized enterprises where formal risk management programs are still emerging. Limited understanding of risk metrics and solution capabilities restricts adoption across certain industries. This also leads to slower uptake in organizations lacking dedicated risk management resources
- Implementation and operational challenges also impact market growth, as TPRM solutions require integration with existing IT infrastructure, regular data updates, and adherence to strict security standards. Complexity of deployment, change management, and training requirements can increase operational costs and extend time-to-value
- For instance, in 2024, several mid-sized firms deploying TPRM solutions reported slower adoption due to high initial setup costs and limited internal expertise to manage vendor risk programs. Integration challenges and ongoing monitoring requirements were additional barriers, prompting some organizations to postpone full-scale implementation and limit vendor coverage
- Overcoming these challenges will require cost-efficient platforms, scalable deployment models, and focused awareness initiatives for organizations. Collaboration with technology partners, consultants, and regulatory advisors can help unlock the long-term growth potential of the global TPRM market. Furthermore, developing user-friendly, automated solutions and strengthening value communication around compliance and risk mitigation will be essential for broader adoption
North America Third Party Risk Management Market Scope
The market is segmented on the basis of component, deployment model, organization size, and end user.
- By Component
On the basis of component, the North America TPRM market is segmented into Solutions and Services. The Solutions segment held the largest market revenue share in 2025, driven by the increasing adoption of automated vendor risk assessment, compliance monitoring, and reporting platforms across enterprises. Solution offerings help organizations centralize third-party risk data, streamline vendor onboarding, and enhance real-time risk visibility, making them a preferred choice for enterprises managing complex vendor ecosystems.
The Services segment is expected to witness the fastest growth rate from 2026 to 2033, driven by demand for expert consulting, risk assessment, and managed TPRM services. Organizations increasingly rely on third-party providers to handle vendor monitoring, regulatory compliance, and ongoing risk mitigation, particularly where in-house capabilities are limited. Services offer scalable, specialized support, enabling enterprises to strengthen operational resilience and reduce compliance burden.
- By Deployment Model
On the basis of deployment model, the market is segmented into On-Premise and Cloud. The Cloud segment held the largest market share in 2025 due to its scalability, lower upfront costs, and ease of integration with existing enterprise systems. Cloud-based TPRM platforms allow continuous monitoring, automated alerts, and centralized reporting, making them attractive for organizations with geographically distributed vendor networks.
The On-Premise segment is expected to grow steadily from 2026 to 2033, driven by organizations prioritizing data security, regulatory compliance, and internal control over sensitive vendor information. On-premise solutions appeal to enterprises with stringent IT governance policies or those in highly regulated industries requiring full control of risk management infrastructure.
- By Organization Size
On the basis of organization size, the market is segmented into Small and Medium-Sized Enterprises (SMEs) and Large Enterprises. Large Enterprises held the largest revenue share in 2025, owing to their extensive vendor networks, higher regulatory scrutiny, and need for comprehensive risk monitoring frameworks. These organizations invest significantly in both TPRM solutions and services to mitigate operational, financial, and reputational risks.
The SME segment is projected to witness the fastest growth from 2026 to 2033, driven by increasing awareness of regulatory requirements, rising cyber threats, and greater adoption of scalable, cost-effective TPRM solutions. SMEs are increasingly leveraging cloud-based platforms and managed services to implement vendor risk management practices without heavy upfront investments.
- By End User
On the basis of end user, the market is segmented into Banking, Financial Services, and Insurance (BFSI), IT and Telecom, Healthcare and Life Sciences, Government, Aerospace and Defense, Retail and Consumer Goods, Manufacturing, Energy and Utilities, and Others. The BFSI segment held the largest share in 2025, driven by stringent regulatory requirements, complex vendor ecosystems, and the critical need for operational and data security. TPRM solutions enable financial institutions to ensure compliance, monitor third-party performance, and reduce exposure to operational risks.
The IT and Telecom segment is expected to witness the fastest growth from 2026 to 2033, driven by rapid digital transformation, increased outsourcing of IT services, and rising cybersecurity concerns. Organizations in this sector increasingly adopt automated monitoring, continuous risk assessment, and cloud-based TPRM platforms to manage extensive vendor networks efficiently.
North America Third Party Risk Management Market Regional Analysis
- The U.S. dominated the third party risk management market with the largest revenue share of 42.3% in 2025, driven by extensive vendor networks, high regulatory scrutiny, and growing cybersecurity concerns
- Enterprises in the region focus on automated risk assessment, compliance reporting, and real-time vendor monitoring to reduce operational, financial, and reputational risks
- High technology adoption, robust IT infrastructure, and the presence of leading TPRM solution providers support widespread deployment, establishing the U.S. as a key market for advanced TPRM platforms
Canada Third Party Risk Management Market Insight
The Canada third party risk management market is expected to witness the fastest growth from 2026 to 2033, fueled by increasing regulatory oversight, digital transformation initiatives, and rising adoption of cloud-based TPRM platforms. Organizations are leveraging automated monitoring, continuous risk assessment, and AI-driven insights to manage vendor risks efficiently. Growing awareness of operational resilience and cybersecurity among enterprises is further accelerating the uptake of TPRM solutions.
North America Third Party Risk Management Market Share
The North America third party risk management industry is primarily led by well-established companies, including:
- BitSight Technologies (U.S.)
- NAVEX Global (U.S.)
- MetricStream (U.S.)
- RSA Security (U.S.)
- Resolver (Canada)
- Venminder (U.S.)
- Genpact (U.S.)
- LogicManager (U.S.)
- OneTrust (U.S.)
- ProcessUnity (U.S.)
- Aravo Solutions (U.S.)
- Prevalent (U.S.)
- RiskWatch International (U.S.)
- Coupa Software (U.S.)
- ACL Services (U.S.)
SKU-

- Interactive Data Analysis Dashboard
- Company Analysis Dashboard for high growth potential opportunities
- Research Analyst Access for customization & queries
- Competitor Analysis with Interactive dashboard
- Latest News, Updates & Trend analysis
- Harness the Power of Benchmark Analysis for Comprehensive Competitor Tracking
Data collection and base year analysis are done using data collection modules with large sample sizes. The stage includes obtaining market information or related data through various sources and strategies. It includes examining and planning all the data acquired from the past in advance. It likewise envelops the examination of information inconsistencies seen across different information sources. The market data is analysed and estimated using market statistical and coherent models. Also, market share analysis and key trend analysis are the major success factors in the market report. To know more, please request an analyst call or drop down your inquiry.
The key research methodology used by DBMR research team is data triangulation which involves data mining, analysis of the impact of data variables on the market and primary (industry expert) validation. Data models include Vendor Positioning Grid, Market Time Line Analysis, Market Overview and Guide, Company Positioning Grid, Patent Analysis, Pricing Analysis, Company Market Share Analysis, Standards of Measurement, Global versus Regional and Vendor Share Analysis. To know more about the research methodology, drop in an inquiry to speak to our industry experts.
Data Bridge Market Research is a leader in advanced formative research. We take pride in servicing our existing and new customers with data and analysis that match and suits their goal. The report can be customized to include price trend analysis of target brands understanding the market for additional countries (ask for the list of countries), clinical trial results data, literature review, refurbished market and product base analysis. Market analysis of target competitors can be analyzed from technology-based analysis to market portfolio strategies. We can add as many competitors that you require data about in the format and data style you are looking for. Our team of analysts can also provide you data in crude raw excel files pivot tables (Fact book) or can assist you in creating presentations from the data sets available in the report.


