



Europe Japanese Restaurant Market Segmentation, By Cuisine Type(Traditional Japanese Cuisine, Specialty Japanese Cuisine, and Modern Japanese Cuisine), Service Type (Quick Service Restaurants (QSR), Full Service Restaurants, and Take-Out Counters/Outlets), Restaurant Category (Standalone Restaurants and Chain/Franchise Model), Restaurant Model (Takeaway, Home Delivery, and Dine-In), Sales Channel (Physical Outlets and Delivery Online Restaurants/Ghost Kitchen) - Industry Trends and Forecast to 2031
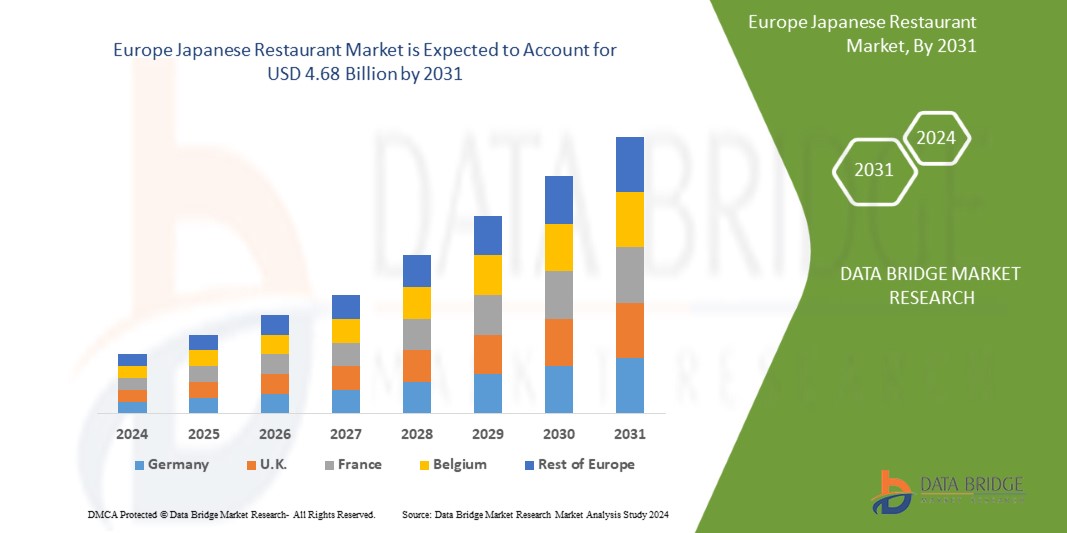
Europe Japanese Restaurant Market Analysis
Increasing awareness of health benefits related to Japanese food is driving the market growth. Innovation in menu offerings provides opportunities in the market. Moreover, increase in popularity of the dish sushi is driving market growth.
Europe Japanese Restaurant Market Size
The Europe Japanese market is expected to reach USD 4.68 billion by 2031 from USD 3.68 billion in 2023, growing with a substantial CAGR of 3.12% in the forecast period of 2024 to 2031.
Europe Market Trends
“Increasing Awareness of Health Benefits Related to Japanese Food Drives the Europe JAPANESE Restaurant Market”
The Europe Japanese restaurant market is experiencing significant growth, driven by the increasing awareness of the health benefits associated with Japanese cuisine. Japanese cuisine, renowned for its emphasis on fresh, high-quality ingredients and balanced nutrition, aligns well with the growing Europe focus on health and wellness. Traditional dishes such as sushi, sashimi, and miso soup are not only flavorful but also low in fat and high in essential nutrients. Sushi, for example, features lean proteins like fish and nutrient-rich vegetables, while miso soup provides probiotics beneficial for digestive health. The health benefits of these foods are becoming more widely recognized, leading to a surge in consumer interest. The growing awareness of Japanese cuisine's health benefits also contributes to its appeal in diverse markets. Consumers in various regions are exploring Japanese food not only for its taste but also for its positive impact on overall health. This shift is particularly evident in regions where there is a rising trend of health-oriented eating habits, such as North America and Europe. Japanese restaurants in these areas are seeing increased patronage as they cater to the demand for healthier dining options.
As more people become health-conscious, they are increasingly seeking out dining options that align with their wellness goals. Japanese restaurants are capitalizing on this trend by highlighting the nutritional advantages of their menus. Many establishments like Sushi Gen Enterprises, Sushi Nozawa Group RE&S and others now emphasize their use of fresh, natural ingredients and traditional cooking methods that retain the maximum nutritional value of the food. This focus on health is not just limited to traditional dishes but extends to modern interpretations and fusion cuisines that integrate Japanese principles with other healthy culinary traditions.
Report Scope and Market Segmentation
|
Attributes |
Europe Key Market Insights |
|
Segmentation |
By Cuisine Type: Traditional Japanese Cuisine, Specialty Japanese Cuisine, and Modern Japanese Cuisine By Service Type: Quick Service Restaurants (QSR), Full Service Restaurants, and Take-Out Counters/Outlets By Restaurant Category: Standalone Restaurants and Chain/Franchise Model By Restaurant Model: Takeaway, Home Delivery, and Dine-In By Sales Channel: Physical Outlets and Delivery Online Restaurants/Ghost Kitchen |
|
Countries Covered |
Germany, Italy, U.K., France, Spain, Turkey, Russia, Switzerland, Belgium, Netherlands, Rest of Europe |
|
Key Market Players |
Katsu-Ya Group, Inc (U.S.), Wokcano Asian Restaurant & Bar.(U.S.), 893 Ryōtei Berlin (Germany), Chiba Japanese Restaurant (U.S.), Tsujita Artisan Noodle (Japan), Sushi Den (U.S.), Florilège (Japan), Kaiten Zushi (U.S.), Kura Sushi USA (U.S.), Narisawa (Japan), RE&S (Singapore), Sazenka (Japan), Sushi A Go (U.S.), Sushi Gen Enterprises (U.S.), Sushi Nozawa Group (U.S.), Sushiya (India), Takami Sushi & Robata Restaurant (U.S.), Tatsu Ramen LLC (U.S.), Yamashiro Hollywood (U.S.), among others |
|
Market Opportunities |
|
|
Value Added Data Infosets |
In addition to the insights on market scenarios such as market value, growth rate, segmentation, geographical coverage, and major players, the market reports curated by the Data Bridge Market Research also include in-depth expert analysis, pricing analysis, brand share analysis, consumer survey, demography analysis, supply chain analysis, value chain analysis, raw material/consumables overview, vendor selection criteria, PESTLE Analysis, Porter Analysis, and regulatory framework. |
Europe Japanese Restaurant Market Definition
A Japanese restaurant is an establishment that specializes in serving traditional Japanese cuisine, characterized by its emphasis on fresh, high-quality ingredients and meticulous preparation techniques. The menu typically features a variety of dishes, including sushi, sashimi, tempura, ramen, and other items that reflect Japan's diverse culinary heritage. Japanese restaurants often prioritize authenticity, incorporating traditional cooking methods and presentation styles, such as sushi rolls and bento boxes, to deliver a genuine dining experience. The ambiance of these restaurants often reflects Japanese aesthetics, with a focus on simplicity, elegance, and attention to detail. Service in Japanese restaurants is generally attentive and respectful, aiming to enhance the overall dining experience. In recent years, many Japanese restaurants have also embraced modern innovations, such as online ordering and sustainable practices, to meet the evolving preferences of Europe consumers.
Europe Japanese Restaurant Market Dynamics
Drivers
- The Increase in Popularity of the Dish Sushi
The rising popularity of sushi is a significant factors for the Europe Japanese restaurant market, influencing consumer preferences and expanding market reach. Sushi, a staple of Japanese cuisine, has experienced a surge in Europe popularity due to its alignment with health trends, versatility, and integration into mainstream food culture. One of the primary factors driving this trend is sushi’s reputation as a healthy and convenient food option. With its emphasis on fresh fish, vegetables, and rice, sushi is often perceived as a nutritious choice. The growing awareness of health and wellness has led many consumers to seek out healthier alternatives to traditional fast food. Sushi’s low-calorie, high-protein, and omega-3-rich profile aligns well with these dietary preferences, making it an attractive option for health-conscious diners. As a result, sushi has become an essential in many diets around the world, driving increased demand for Japanese restaurants. Along with it the rise of sushi's popularity is also supported by its versatility and adaptability. Sushi can be customized to suit various tastes and dietary needs, including vegetarian and gluten-free options. This flexibility allows sushi to cater to a wide range of consumer preferences, further enhancing its appeal. The introduction of innovative sushi rolls and fusion creations has also helped to attract a diverse audience, from traditionalists to those seeking novel culinary experiences. This adaptability has facilitated the expansion of sushi offerings in both traditional Japanese restaurants and new, contemporary dining establishments. In addition the mainstream acceptance of sushi has also played a crucial role in its market influence. Sushi has become a common fixture in cities around the world, from New York and London to Sydney and Tokyo. Its presence in popular media, including television shows, social media, and food blogs, has elevated sushi to a prominent position in Europe food culture. This increased visibility has led to a broader acceptance of sushi as a mainstream dining option, attracting customers who may not have previously considered Japanese cuisine.
For Instance,
- In 2024, according to World Metrics, the Europe sushi market has experienced substantial growth, with the industry valued at over USD 27 billion. This surge highlights the increasing popularity of sushi, driving a significant rise in the number of Japanese restaurants and contributing to the expansion of Japanese dining experiences worldwide
The Recognition of Japanese Cuisine as a UNESCO Intangible Cultural Heritage
The designation of Japanese cuisine as a UNESCO intangible cultural heritage highlights its traditional practices, unique preparation methods, and cultural significance. This acknowledgment not only elevates the profile of Japanese food but also generates heightened Europe interest. Consumers are increasingly drawn to Japanese cuisine due to its rich history, authenticity, and the craftsmanship associated with its preparation. As a result, there is a growing demand for authentic Japanese dining experiences, which directly benefits Japanese restaurants worldwide.
The UNESCO recognition also enhances the Europe appeal of Japanese cuisine by positioning it as a symbol of cultural sophistication and culinary excellence. This status attracts food enthusiasts and cultural tourists who seek to experience the authentic flavors and traditional techniques that are now internationally celebrated. Japanese restaurants, therefore, benefit from increased foot traffic and consumer interest driven by this prestigious endorsement. Furthermore, the Europe focus on preserving intangible cultural heritage aligns with broader trends in cultural tourism and experiential dining. As travelers become more interested in immersing themselves in local traditions and cultural practices, Japanese cuisine’s UNESCO status makes it a compelling choice. Restaurants that offer traditional Japanese dishes and emphasize their heritage connection are likely to attract both international tourists and local consumers who are eager to engage with culturally significant culinary experiences.
For instance,
- In February 2024, according to an article published by the Star Advertiser, the Europe interest in Japan’s traditional cuisine, recognized as a UNESCO intangible cultural heritage, continues to rise. The recognition of Japanese cuisine by UNESCO enhances its prestige and appeal, encouraging more diners to explore and appreciate its cultural and historical significance, which in turn fuels the growth and popularity of Japanese dining establishments across the globe
Opportunities
- Innovation in Menu Offerings
Innovation in menu offerings presents a significant opportunity for the Europe Japanese restaurant market, possessing growth and capturing new customer segments. As the dining landscape evolves, Japanese restaurants have the chance to differentiate themselves by embracing creative and diverse menu options that appeal to modern consumers. One of the key opportunities lies in the adaptation of traditional Japanese dishes to contemporary tastes and dietary preferences. For example sushi, traditionally consisting of raw fish and rice, has evolved to include a variety of ingredients and styles, such as vegetarian rolls, fusion creations, and even sushi burritos. This innovation allows Japanese restaurants to cater to a broader audience, including those with dietary restrictions or a preference for unique flavor combinations. By offering diverse and inventive menu items, restaurants can attract a wider range of customers and increase their market appeal.
Another opportunity for menu innovation is the integration of Europe culinary trends with Japanese cuisine. Japanese restaurants are increasingly incorporating elements from other culinary traditions, resulting in exciting new dishes that blend flavors and techniques. For instance the fusion of Japanese and Mediterranean ingredients can create unique dishes like sushi with hummus or miso-glazed lamb. These cross-cultural innovations not only attract adventurous eaters but also position Japanese restaurants as trendsetters in the Europe dining scene.
For instance,
- In 2018, according to the Economic Times, the Japanese restaurant market saw significant innovation with the introduction of sushi doughnuts and sushi burritos. These novel creations, which blend traditional sushi ingredients with new formats, such as a doughnut-shaped sushi or a burrito-style wrap, reflect a growing trend towards inventive menu offerings
Collaboration with Local Cultural Events and Festivals
Collaboration with local cultural events and festivals represents a significant opportunity for the Europe Japanese restaurant market, fostering growth and expanding market reach. These collaborations allow Japanese restaurants to enhance their visibility, engage with diverse audiences, and strengthen their brand presence in both established and emerging markets.
Participating in cultural events and festivals enables Japanese restaurants to introduce their cuisine to new customer segments. Events such as food festivals, cultural fairs, and community celebrations attract large and varied audiences, providing a platform for restaurants to showcase their offerings. For instance, a Japanese restaurant setting up a booth at a multicultural food festival can reach attendees who may be unfamiliar with Japanese cuisine. By offering sample dishes or special event menus, restaurants can attract potential customers, generate interest, and encourage them to visit the restaurant for a full dining experience. These collaborations help Japanese restaurants build brand recognition and establish a positive reputation within the community. When restaurants align themselves with popular local events, they benefit from the event's promotional efforts, including marketing materials, social media mentions, and local media coverage. This association can boost the restaurant's visibility and credibility, leading to increased interest and foot traffic. For instance, a Japanese restaurant partnering with a prominent local cultural festival may be featured in event advertisements and receive mentions in local news outlets, boosting its profile among potential diners.
Restraints/Challenges
- High Cost of Ingredients for Japanese Cuisine
Japanese cuisine, known for its emphasis on fresh and high-quality ingredients, often relies on specialized items such as premium-grade sushi-grade fish, rare vegetables, and imported condiments. Such as, ingredients like bluefin tuna, used in high-end sushi, and seasonal items such as Matsutake mushrooms, are not only expensive but also subject to fluctuations in availability and price. The high cost of these ingredients impacts the overall cost structure of Japanese restaurants, leading to increased menu prices and potentially reduced consumer demand. The high costs of ingredients can particularly strain smaller or independent Japanese restaurants. These establishments may struggle to absorb the cost increases without significantly raising menu prices, which could discourage budget-conscious customers. Additionally, the volatility in ingredient prices can lead to inconsistent menu pricing and availability. For instance, fluctuations in the Europe market for seafood due to overfishing, environmental changes, or supply chain disruptions can cause sudden increases in costs.
The impact of high ingredient costs extends beyond the restaurant level to affect consumer perceptions and behavior. When menu prices rise due to increased ingredient costs, consumers may perceive the restaurant as less affordable or value-for-money. This perception can lead to decreased support and lower overall sales. Moreover, the high cost of authentic Japanese ingredients can limit the ability of restaurants to offer a diverse menu, potentially reducing their appeal to a broader audience.
- 이탈리아와 중국 요리의 치열한 경쟁
유럽의 일본식 레스토랑 시장은 이탈리아와 중국 요리와의 치열한 경쟁으로 인해 상당한 어려움에 직면해 있습니다. 이탈리아와 중국식 식사 옵션은 모두 유럽 음식 문화에 깊이 자리 잡고 있어 소비자의 관심과 시장 점유율을 놓고 경쟁하는 일본 레스토랑에 강력한 경쟁자로 등장합니다. 가장 큰 어려움 중 하나는 유럽 식사 시장에서 이탈리아와 중국 요리가 포화 상태라는 것입니다. 파스타, 피자, 리조또와 같은 다양한 요리를 제공하는 이탈리아 요리와 딤섬, 국수, 볶음 요리 등 다양한 요리로 유명한 중국 요리는 많은 국가에서 널리 이용 가능하고 깊이 자리 잡고 있습니다. 이러한 광범위한 이용 가능성은 일본 레스토랑에 대한 높은 수준의 경쟁을 만들어내며, 일본 레스토랑은 차별화해야 합니다.
소비자의 관심을 사로잡기 위해 스스로를 사용합니다. 이러한 요리의 유행은 일본 레스토랑이 익숙하고 인기 있는 옵션이 지배하는 혼잡한 시장에서 눈에 띄는 데 어려움을 겪는다는 것을 의미합니다.
이와 함께 일본 레스토랑을 유지하는 데 따른 진입 비용과 운영상의 어려움은 상당한 어려움이 될 수 있습니다. 이탈리아와 중국 레스토랑은 더 큰 입지와 확립된 공급망으로 인해 규모의 경제성에서 종종 혜택을 받습니다. 반면 일본 레스토랑은 정통 재료와 특수 장비를 조달하는 데 더 많은 비용이 들 수 있으며, 이는 가격과 수익성에 영향을 미칠 수 있습니다. 예를 들어, 고품질의 초밥 등급 생선과 프리미엄 간장은 비싸고 신중하게 취급해야 하므로 운영 비용이 증가할 수 있습니다. 운영 효율성의 이러한 불균형으로 인해 일본 레스토랑이 어려움을 겪을 수 있습니다.
특히 비용이 소비자에게 중요한 고려사항인 시장에서는 레스토랑이 가격 경쟁을 해야 합니다.
원자재 부족 및 운송 지연의 영향 및 현재 시장 시나리오
Data Bridge Market Research는 시장에 대한 고수준 분석을 제공하고 원자재 부족과 운송 지연의 영향과 현재 시장 환경을 고려하여 정보를 제공합니다. 이는 전략적 가능성을 평가하고, 효과적인 행동 계획을 수립하고, 기업이 중요한 결정을 내리는 데 도움을 주는 것으로 해석됩니다.
표준 보고서 외에도 예상 배송 지연 등의 조달 수준에 대한 심층 분석, 지역별 유통업체 매핑, 상품 분석, 생산 분석, 가격 매핑 추세, 소싱, 카테고리 성과 분석, 공급망 위험 관리 솔루션, 고급 벤치마킹 및 조달 및 전략적 지원을 위한 기타 서비스를 제공합니다.
경제 침체가 제품 가격 및 가용성에 미치는 영향 예상
경제 활동이 둔화되면 산업이 어려움을 겪기 시작합니다. 경기 침체가 제품의 가격 책정 및 접근성에 미치는 예상 효과는 DBMR에서 제공하는 시장 통찰력 보고서 및 인텔리전스 서비스에서 고려됩니다. 이를 통해 고객은 일반적으로 경쟁사보다 한 발 앞서 나가고, 매출과 수익을 예측하고, 손익 지출을 추정할 수 있습니다.
유럽 시장 범위
시장은 요리 유형, 서비스 유형, 레스토랑 범주, 레스토랑 모델 및 판매 채널을 기준으로 5개의 주목할 만한 세그먼트로 세분화됩니다. 이러한 세그먼트 간의 성장은 산업의 빈약한 성장 세그먼트를 분석하고 사용자에게 핵심 시장 응용 프로그램을 식별하기 위한 전략적 결정을 내리는 데 도움이 되는 귀중한 시장 개요와 시장 통찰력을 제공하는 데 도움이 됩니다.
전통 일본 요리
- 전통 일본 요리, 요리 유형별
- 초밥
- 초밥, 종류별
- 컨베이어 벨트
- 컨베이어 없음
- 스시, 체인점
- 지역 레스토랑
- 국제 체인점
- 스시, 식당별
- 퀵서비스
- 풀서비스 레스토랑
- 테이크아웃 카운터/매점
- 초밥, 종류별
- 라면
- 라멘, 레스토랑 모드
- 테이크어웨이
- 택배 배달
- 다이닝 인
- 라멘, 설립에 따라
- 퀵서비스
- 풀서비스 레스토랑
- 테이크아웃 카운터/매점
- 라멘, 레스토랑 모드
- 튀김
- 레스토랑 모드의 튀김
- 테이크어웨이
- 택배 배달
- 다이닝 인
- 튀김, 설립에 따라
- 퀵서비스
- 풀서비스 레스토랑
- 테이크아웃 카운터/매점
- 레스토랑 모드의 튀김
- 사시미
- 사시미, 레스토랑 모드
- 테이크어웨이
- 택배 배달
- 다이닝 인
- 사시미, 설립에 따라
- 퀵서비스
- 풀서비스 레스토랑
- 테이크아웃 카운터/매점
- 사시미, 레스토랑 모드
- 가이세키
- 레스토랑 모드의 카이세키
- 테이크어웨이
- 택배 배달
- 다이닝 인
- 가이세키, 설립에 따라
- 퀵서비스
- 풀서비스 레스토랑
- 테이크아웃 카운터/매점
- 레스토랑 모드의 카이세키
- 우동/소바
- 우동/소바, 레스토랑 모드별
- 테이크어웨이
- 택배 배달
- 다이닝 인
- 우동/소바, 업체별
- 퀵서비스
- 풀서비스 레스토랑
- 테이크아웃 카운터/매점
- 우동/소바, 레스토랑 모드별
- 기타
- 기타, 레스토랑 모드별
- 테이크어웨이
- 택배 배달
- 다이닝 인
- 기타, 설립에 따라
- 퀵서비스
- 풀서비스 레스토랑
- 테이크아웃 카운터/매점
- 기타, 레스토랑 모드별
- 초밥
특선 일본 요리
- 특선 일본 요리, 종류별
- 야키토리
- 철판구이
- 기타
- 레스토랑 모드별 특선 일본 요리
- 테이크어웨이
- 택배 배달
- 다이닝 인
- 레스토랑 모드별 특선 일본 요리
- 퀵서비스
- 풀서비스 레스토랑
- 테이크아웃 카운터/매점
- 모던 일본 요리
- 모던 일본 요리, 유형별
- 퓨전일본식
- 현대 일본 요리
- 모던 일본 요리, 유형별
- 모던 일식, 레스토랑 모드
- 테이크어웨이
- 택배 배달
- 다이닝 인
- 현대 일본 요리, 설립자별
- 퀵서비스
- 풀서비스 레스토랑
- 테이크아웃 카운터/매점
서비스 유형
- 퀵서비스 레스토랑(QSR)
- 풀서비스 레스토랑
- 테이크아웃 카운터/매점
레스토랑 카테고리
- 독립형 레스토랑
- 체인/프랜차이즈 모델
레스토랑 모델
- 테이크어웨이
- 택배 배달
- 다이닝 인
판매 채널
- 물리적 매장
- 배달 온라인 레스토랑/고스트 키친
유럽 시장 지역 분석
시장은 요리 유형, 서비스 유형, 레스토랑 카테고리, 레스토랑 모델, 판매 채널을 기준으로 5개의 주요 세그먼트로 구분됩니다.
이 시장에서 다루는 국가는 독일, 이탈리아, 영국, 프랑스, 스페인, 터키, 러시아, 스위스, 벨기에, 네덜란드와 나머지 유럽 국가입니다.
프랑스는 잘 정비된 인프라, 첨단 처리 기술, 다른 지역에 비해 높은 수준의 투자 덕분에 시장에서 우위를 점하고 가장 빠르게 성장하는 나라가 될 것으로 예상되며, 이로 인해 시장 성장이 더욱 촉진될 것으로 기대됩니다.
The country section of the report also provides individual market impacting factors and changes in regulation in the market domestically that impacts the current and future trends of the market. Data points like down-stream and upstream value chain analysis, technical trends and porter's five forces analysis, case studies are some of the pointers used to forecast the market scenario for individual countries. Also, the presence and availability of Europe brands and their challenges faced due to large or scarce competition from local and domestic brands, impact of domestic tariffs and trade routes are considered while providing forecast analysis of the country data.
Europe Market Share
The market competitive landscape provides details by competitors. Details included are company overview, company financials, revenue generated, market potential, investment in research and development, new market initiatives, Europe presence, production sites and facilities, production capacities, company strengths and weaknesses, product launch, product width and breadth, application dominance. The above data points provided are only related to the companies' focus related to market.
Europe Market Leaders Operating in the Market Are:
- Katsu-Ya Group, Inc (U.S.)
- Wokcano Asian Restaurant & Bar.(U.S.),
- 893 Ryōtei Berlin (Germany),
- Chiba Japanese Restaurant (U.S.)
- Tsujita Artisan Noodle (Japan)
- Sushi Den (U.S.)
- Florilège (Japan)
- Kaiten Zushi (U.S.)
- Kura Sushi USA (U.S.)
- Narisawa (Japan)
- RE&S (Singapore)
- Sazenka (Japan)
- Sushi A Go (U.S.)
- Sushi Gen Enterprises (U.S.)
- Sushi Nozawa Group (U.S.)
- Sushiya (India)
- Takami Sushi & Robata Restaurant (U.S.)
- Tatsu Ramen LLC (U.S.)
- Yamashiro Hollywood (U.S.)
Latest Developments in Europe Japanese Restaurant Market
- In May 2024, Sushi Den has announced the relaunch of its highly anticipated lunch service. In addition, OTOTO, a latest addition to the Sushi Den and Izakaya Den, has launched a delightful Sunday Brunch starting from 11:00 AM to 2:00 PM. The company look forward to sharing this new chapter with their customer’s and enjoying the season’s fresh offerings together
- In May 2024, Kura Sushi USA launched a Dragon Ball Super-themed Bikkura Pon promotion from May 1 to June 30, 2024. The collaboration featured exclusive Dragon Ball Super prizes, including limited-edition acrylic stand keychains and enamel pins. A rare glow-in-the-dark Goku keychain was available in limited quantities. From June 5-9, Rewards Members received a Dragon Ball Super graphic tee with a $70 in-restaurant spend. A Dragon Ball Super Bottle Set with a straw and lanyard was available for $16.00 starting June 1. The Bikkura Pon Prize System rewarded diners with Dragon Ball Super-themed prizes for every 15 plates enjoyed
- In December 2023, Kura Sushi USA, Inc. has introduced ecopon, the world’s first plastic-free, biodegradable paper capsule, for its Bikkura Pon prizes. Developed by K2 Station Co., Ltd., Rengo Co., Ltd., and Daiho Industrial Co., Ltd., ecopon capsules are made from starch and paper pulp, reducing CO2 emissions by a third compared to polypropylene. The new capsules will debut with a Peanuts® Bikkura Pon collaboration from Dec. 1, 2024, to Jan. 31, 2025. This initiative reflects Kura Sushi’s commitment to sustainability, following their transition to paper straws and other eco-friendly practices. For more information, visit kurasushi.com/sustainability
- In October 2023, Kura Sushi USA, Inc. has partnered with Peanuts Worldwide LLC for a special Bikkura Pon promotion running from Dec. 1, 2024, to Jan. 31, 2025. Diners can enjoy exclusive Peanuts-themed prizes, including figurine keychains, can badges, and microfiber cloths featuring characters like Snoopy and Charlie Brown. For every 15 sushi plates, guests will receive a Peanuts x Kura Sushi prize, with a rare Snoopy Figurine Keychain available only through the prize system. Rewards Members spending $70 from Jan. 3-7, 2024, will get a Peanuts-inspired cup set. Kura Sushi is also using ecopon’s biodegradable capsules for this promotion
SKU-
세계 최초의 시장 정보 클라우드 보고서에 온라인으로 접속하세요

- 대화형 데이터 분석 대시보드
- 높은 성장 잠재력 기회를 위한 회사 분석 대시보드
- 사용자 정의 및 질의를 위한 리서치 분석가 액세스
- 대화형 대시보드를 통한 경쟁자 분석
- 최신 뉴스, 업데이트 및 추세 분석
- 포괄적인 경쟁자 추적을 위한 벤치마크 분석의 힘 활용
목차
1 서론
1.1 연구 목적
1.2 시장 정의
1.3 개요
1.4 제한 사항
1.5 대상 시장
2 시장 세분화
2.1 대상 시장
2.2 지리적 범위
연구에 2.3년이 고려됨
2.4 통화 및 가격
2.5 DBMR TRIPOD 데이터 검증 모델
2.6 다변량 모델링
2.7 주요 여론 선도자와의 1차 인터뷰
2.8 DBMR 시장 위치 그리드
2.9 DBMR 공급업체 점유율 분석
2.1 2차 소스
2.11 가정
3 요약
4가지 프리미엄 인사이트
4.1 공급망 분석
4.1.1 개요
4.1.2 원자재 공급업체
4.1.3 유통업체
4.1.4 물류 제공자
4.1.5 레스토랑 운영자
5 시장 개요
5.1 드라이버
5.1.1 일본 음식과 관련된 건강상의 이점에 대한 인식 증가로 유럽 일본 레스토랑 시장이 성장하고 있습니다.
5.1.2 스시(SUSHI) 요리의 인기 증가
5.1.3 일본 요리의 유네스코 무형문화유산 인정
5.1.4 일본 대중 문화의 영향
5.2 제약
5.2.1 식품 오염, 제품의 안전 및 품질 위험
5.2.2 일본 요리 재료의 높은 비용
5.3 기회
5.3.1 메뉴 제공의 혁신
5.3.2 지역 문화 행사 및 축제와의 협력
5.4 과제
5.4.1 이탈리아와 중국 요리의 치열한 경쟁
5.4.2 진정성 유지 및 인력 부족
6 유럽 일본식 레스토랑 시장, 요리 유형별
6.1 개요
6.2 전통 일본 요리
6.2.1 초밥
6.2.2 라멘
6.2.3 템푸라
6.2.4 사시미
6.2.5 가이세키
6.2.6 우동/소바
6.2.7 기타
6.3 특선 일본 요리
6.4 현대 일본 요리
7 유럽 일본식 레스토랑 시장, 서비스 유형별
7.1 개요
7.2 패스트푸드점(QSR)
7.3 풀서비스 레스토랑
7.4 테이크아웃 카운터/매점
8 유럽 일본 레스토랑 시장, 레스토랑 카테고리별
8.1 개요
8.2 독립형 레스토랑
8.3 체인/프랜차이즈 모델
9 유럽 일본 레스토랑 시장, 레스토랑 모델별
9.1 개요
9.2 테이크어웨이
9.3 택배 배송
9.4 식사
10 유럽 일본식 레스토랑 시장, 판매 채널별
10.1 개요
10.2 물리적 출구
10.3 배달 온라인 레스토랑/고스트 키친
11 유럽 일본식 레스토랑 시장, 지역별
11.1 유럽
11.1.1 프랑스
11.1.2 독일
11.1.3 영국
11.1.4 이탈리아
11.1.5 스페인
11.1.6 러시아
11.1.7 터키
11.1.8 스위스
11.1.9 벨기에
11.1.10 네덜란드
11.1.11 유럽의 나머지 지역
12 유럽 일본식 레스토랑 시장: 회사 환경
12.1 회사 점유율 분석: 유럽
13 SWOT 분석
14 회사 프로필
14.1 가츠야 그룹 주식회사
14.1.1 회사 스냅샷
14.1.2 회사 점유율 분석
14.1.3 제품 포트폴리오
14.1.4 최근 업데이트
14.2 WOKCANO 아시아 레스토랑 & 바
14.2.1 회사 스냅샷
14.2.2 회사 점유율 분석
14.2.3 제품 포트폴리오
14.2.4 최근 업데이트
14.3 893 료테이 베를린
14.3.1 회사 스냅샷
14.3.2 회사 점유율 분석
14.3.3 제품 포트폴리오
14.3.4 최근 개발
14.4 치바 일본식 레스토랑
14.4.1 회사 스냅샷
14.4.2 회사 점유율 분석
14.4.3 제품 포트폴리오
14.4.4 최근 개발
14.5 츠지타 아티산 누들.
14.5.1 회사 스냅샷
14.5.2 회사 점유율 분석
14.5.3 제품 포트폴리오
14.5.4 최근 개발
14.6 스시덴
14.6.1 회사 스냅샷
14.6.2 제품 포트폴리오
14.6.3 최근 개발
14.7 플로릴레주
14.7.1 회사 스냅샷
14.7.2 제품 포트폴리오
14.7.3 최근 개발
14.8 카이텐즈시
14.8.1 회사 스냅샷
14.8.2 제품 포트폴리오
14.8.3 최근 개발
14.9 쿠라스시 USA
14.9.1 회사 스냅샷
14.9.2 수익 분석
14.9.3 제품 포트폴리오
14.9.4 최근 개발
14.1 나리사와
14.10.1 회사 스냅샷
14.10.2 제품 포트폴리오
14.10.3 최근 개발
14.11 부동산
14.11.1 회사 스냅샷
14.11.2 수익 분석
14.11.3 제품 포트폴리오
14.11.4 최근 개발 사항
14.12 사젠카
14.12.1 회사 스냅샷
14.12.2 제품 포트폴리오
14.12.3 최근 업데이트
14.13 스시 어 고고
14.13.1 회사 스냅샷
14.13.2 제품 포트폴리오
14.13.3 최근 개발
14.14 SUSHI GEN ENTERPRISES
14.14.1 회사 스냅샷
14.14.2 제품 포트폴리오
14.14.3 최근 업데이트
14.15 스시노자와 그룹
14.15.1 회사 스냅샷
14.15.2 제품 포트폴리오
14.15.3 최근 업데이트
14.16 스시야
14.16.1 회사 스냅샷
14.16.2 제품 포트폴리오
14.16.3 최근 업데이트
14.17 다카미 스시 & 로바타 레스토랑
14.17.1 회사 스냅샷
14.17.2 제품 포트폴리오
14.17.3 최근 개발
14.18 타츠라멘 유한회사
14.18.1 회사 스냅샷
14.18.2 제품 포트폴리오
14.18.3 최근 업데이트
14.19 야마시로 할리우드
14.19.1 회사 스냅샷
14.19.2 제품 포트폴리오
14.19.3 최근 개발 사항
15 설문지
16 관련 보고서
표 목록
표 1 유럽 일본식 레스토랑 시장, 요리 유형별, 2022-2031 (USD 천)
표 2 유럽 전통 일본 요리, 일본 레스토랑 시장에서 유형별, 2022-2031 (USD 천)
표 3 지역별 일본 레스토랑 시장에서의 유럽 전통 일본 요리, 2022-2031 (USD 천)
표 4 유럽 일본 레스토랑 시장에서의 스시, 유형별, 2022-2031 (USD 천)
표 5 유럽 일본 레스토랑 시장에서의 스시, 체인별, 2022-2031 (USD 천)
표 6 유럽 일본 레스토랑 시장에서의 스시, 레스토랑 형태별, 2022-2031 (USD 천)
표 7 유럽 일본 레스토랑 시장에서의 스시, 설립별, 2022-2031 (USD 천)
표 8 유럽 라멘, 일본 레스토랑 시장에서, 레스토랑 형태별, 2022-2031 (USD 천)
표 9 일본 레스토랑 시장에서의 유럽 라멘, 업소 유형별, 2022-2031 (USD 천)
표 10 유럽의 일본식 레스토랑 시장에서의 튀김, 레스토랑 형태별, 2022-2031 (USD 천)
표 11 유럽 일본 레스토랑 시장에서의 튀김, 업소 유형별, 2022-2031 (USD 천)
표 12 유럽 사시미 일본 레스토랑 시장, 레스토랑 형태별, 2022-2031 (USD 천)
표 13 유럽 사시미 일본 레스토랑 시장, 설립 유형별, 2022-2031 (USD 천)
표 14 유럽 가이세키, 일본 레스토랑 시장, 레스토랑 형태별, 2022-2031 (USD 천)
표 15 유럽 가이세키 일본 레스토랑 시장, 설립 유형별, 2022-2031 (USD 천)
표 16 유럽 우동/소바 일본 레스토랑 시장, 레스토랑 형태별, 2022-2031 (USD 천)
표 17 유럽 우동/소바 일본식 레스토랑 시장, 업소 유형별, 2022-2031 (USD 천)
표 18 유럽 기타 일본 레스토랑 시장, 레스토랑 형태별, 2022-2031 (USD 천)
표 19 유럽 기타 일본 레스토랑 시장, 설립 유형별, 2022-2031 (USD 천)
표 20 유럽 특선 일본 요리, 지역별 일본 레스토랑 시장, 2022-2031, (USD 천)
표 21 유럽 특선 일본 요리, 일본 레스토랑 시장에서 유형별, 2022-2031 (USD 천)
표 22 유럽 특선 일본 요리, 일본 레스토랑 시장에서 레스토랑 형태별, 2022-2031 (USD 천)
표 23 유럽 특선 일본식 레스토랑 시장에서의 일본식 전문점, 2022-2031년(USD 천)
표 24 유럽 현대 일본 요리, 지역별 일본 레스토랑 시장, 2022-2031 (USD 천)
표 25 유럽 현대 일본 요리의 일본 레스토랑 시장 유형별, 2022-2031 (USD 천)
표 26 유럽 현대 일본 요리, 일본 레스토랑 시장에서 레스토랑 형태별, 2022-2031 (USD 천)
표 27 유럽 현대 일본식 레스토랑 시장의 일본식 레스토랑 유형별, 2022-2031 (USD 천)
표 28 유럽 일본식 레스토랑 시장, 제품 유형별, 2022-2031 (USD 천)
표 29 2022-2031년 지역별 일본 레스토랑 시장에서의 유럽 패스트푸드 레스토랑(QSR) (USD 천 달러)
표 30 2022-2031년 지역별 일본 레스토랑 시장의 유럽 풀서비스 레스토랑(USD 천)
표 31 2022-2031년 지역별 일본 레스토랑 시장의 유럽 테이크아웃 카운터/매장 (USD 천)
표 32 유럽 일본 레스토랑 시장, 레스토랑 카테고리별, 2022-2031 (USD 천)
표 33 2022-2031년 지역별 일본 레스토랑 시장에서의 유럽 독립형 레스토랑(USD 천)
표 34 2022-2031년 지역별 일본 레스토랑 시장의 유럽 체인/프랜차이즈 모델 (USD 천)
표 35 유럽 일본식 레스토랑 시장, 성격별, 2022-2031 (USD 천)
표 36 2022-2031년 지역별 일본 레스토랑 시장에서의 유럽 테이크어웨이(USD 천)
표 37 지역별 일본 레스토랑 시장의 유럽 홈 딜리버리, 2022-2031 (USD 천)
표 38 유럽 지역별 일본식 레스토랑 시장(USD 천)
표 39 유럽 일본식 레스토랑 시장, 판매 채널별, 2022-2031년(USD 천 달러)
표 40 유럽의 일본 레스토랑 시장에서의 물리적 매장 수, 지역별, 2022-2031 (USD 천)
표 41 2022-2031년 지역별 일본 레스토랑 시장에서의 유럽 온라인 배달(USD 천)
표 42 유럽 일본식 레스토랑 시장, 국가별, 2022-2031 (USD 천)
표 43 유럽 일본식 레스토랑 시장, 요리 유형별, 2022-2031 (USD 천)
표 44 유럽 전통 일본 요리, 일본 레스토랑 시장, 유형별, 2022-2031 (USD 천)
표 45 유럽 일본 레스토랑 시장에서의 스시, 유형별, 2022-2031 (USD 천)
표 46 유럽 일본 레스토랑 시장에서의 스시, 체인별, 2022-2031 (USD 천)
표 47 유럽 일본 레스토랑 시장에서의 스시, 레스토랑 형태별, 2022-2031 (USD 천)
표 48 유럽 일본 레스토랑 시장에서의 스시, 2022-2031년 설립별 (USD 천)
표 49 유럽 라멘, 일본 레스토랑 시장에서, 레스토랑 형태별, 2022-2031 (USD 천)
표 50 일본 레스토랑 시장에서의 유럽 라멘, 2022-2031년 설립별 (USD 천)
표 51 유럽의 일본식 레스토랑 시장에서의 튀김, 레스토랑 형태별, 2022-2031 (USD 천)
표 52 유럽 일본 레스토랑 시장에서의 튀김, 2022-2031년 설립별 (USD 천)
표 53 유럽 사시미, 일본 레스토랑 시장에서, 레스토랑 형태별, 2022-2031 (USD 천)
표 54 유럽 사시미 일본 레스토랑 시장, 설립별, 2022-2031 (USD 천)
표 55 유럽 가이세키, 일본 레스토랑 시장, 레스토랑 형태별, 2022-2031 (USD 천)
표 56 유럽 가이세키 일본 레스토랑 시장, 설립별, 2022-2031 (USD 천)
표 57 유럽 우동/소바, 일본 레스토랑 시장, 레스토랑 형태별, 2022-2031 (USD 천)
표 58 유럽 우동/소바 일본식 레스토랑 시장, 설립별, 2022-2031 (USD 천)
표 59 유럽 기타 일본 레스토랑 시장, 레스토랑 모드별, 2022-2031 (USD 천)
표 60 유럽 기타 일본 레스토랑 시장, 설립별, 2022-2031 (USD 천)
표 61 유럽 특선 일본 요리, 일본 레스토랑 시장에서 유형별, 2022-2031 (USD 천)
표 62 유럽 특선 일본 요리, 일본 레스토랑 시장에서 레스토랑 형태별, 2022-2031 (USD 천)
표 63 유럽 특선 일본식 레스토랑 시장에서의 일본식 전문점, 2022-2031년 설립별 (USD 천)
표 64 유럽 현대 일본 요리, 일본 레스토랑 시장 유형별, 2022-2031 (USD 천)
표 65 유럽 현대 일본 요리, 일본 레스토랑 시장에서, 레스토랑 형태별, 2022-2031 (USD 천)
표 66 유럽 현대 일본식 레스토랑 시장, 설립별, 2022-2031 (USD 천)
표 67 서비스 유형별 유럽 일본식 레스토랑 시장, 2022-2031 (USD 천)
표 68 유럽 일본식 레스토랑 시장, 레스토랑 카테고리별, 2022-2031 (USD 천)
표 69 유럽 일본 레스토랑 시장, 레스토랑 모델별, 2022-2031 (USD 천)
표 70 유럽 일본식 레스토랑 시장, 판매 채널별, 2022-2031 (USD 천)
표 71 프랑스 일본 레스토랑 시장, 요리 유형별, 2022-2031 (USD 천)
표 72 일본 레스토랑 시장에서의 프랑스 전통 일본 요리, 유형별, 2022-2031 (USD 천)
표 73 2022-2031년 유형별 일본 레스토랑 시장에서의 프랑스 스시(USD 천)
표 74 체인별 일본 레스토랑 시장에서의 프랑스 스시, 2022-2031 (USD 천)
표 75 레스토랑 모드별 일본 레스토랑 시장에서의 프랑스 스시, 2022-2031 (USD 천)
표 76 일본 레스토랑 시장에서의 프랑스 스시, 2022-2031년 설립별 (USD 천)
표 77 일본 레스토랑 시장에서의 프랑스 라멘, 레스토랑 형태별, 2022-2031 (USD 천)
표 78 일본 레스토랑 시장에서의 프랑스 라멘, 2022-2031년 설립별 (USD 천)
표 79 레스토랑 모드별 일본 레스토랑 시장에서의 프랑스 튀김, 2022-2031 (USD 천)
표 80 일본 레스토랑 시장에서의 프랑스 튀김, 2022-2031년 설립별 (USD 천)
표 81 일본 레스토랑 시장에서의 프랑스 사시미, 레스토랑 형태별, 2022-2031 (USD 천)
표 82 일본 레스토랑 시장에서의 프랑스 사시미, 2022-2031년 설립별 (USD 천)
표 83 레스토랑 모드별 일본 레스토랑 시장에서의 프랑스 가이세키, 2022-2031 (USD 천)
표 84 일본 레스토랑 시장에서의 프랑스 가이세키, 2022-2031년 설립별 (USD 천)
표 85 일본 레스토랑 시장에서의 프랑스 우동/소바, 레스토랑 형태별, 2022-2031 (USD 천)
표 86 일본 레스토랑 시장에서의 프랑스 우동/소바, 2022-2031년 설립별 (USD 천)
표 87 프랑스 기타 일본 레스토랑 시장, 레스토랑 모드별, 2022-2031 (USD 천)
표 88 일본 레스토랑 시장의 프랑스 기타 업체, 2022-2031년 설립 기준 (USD 천)
표 89 일본 레스토랑 시장에서의 프랑스 특선 일본 요리, 유형별, 2022-2031 (USD 천)
표 90 프랑스 특선 일본 요리, 일본 레스토랑 시장에서 레스토랑 형태별, 2022-2031 (USD 천)
표 91 프랑스 특선 일본식 레스토랑 시장 내 일본식 전문점, 2022-2031년 설립 기준 (USD 천)
표 92 일본 레스토랑 시장에서의 프랑스 현대 일본 요리, 유형별, 2022-2031 (USD 천)
표 93 2022-2031년 레스토랑 유형에 따른 일본 레스토랑 시장에서의 프랑스 현대 일본 요리(USD 천 달러)
표 94 2022-2031년 설립별 일본 레스토랑 시장에서의 프랑스 현대 일본식(USD 천)
표 95 서비스 유형별 프랑스 일본식 레스토랑 시장, 2022-2031 (USD 천)
표 96 프랑스 일본식 레스토랑 시장, 레스토랑 카테고리별, 2022-2031 (USD 천)
표 97 프랑스 일본 레스토랑 시장, 레스토랑 모델별, 2022-2031 (USD 천)
표 98 프랑스 일본식 레스토랑 시장, 판매 채널별, 2022-2031 (USD 천)
표 99 독일 일본 레스토랑 시장, 요리 유형별, 2022-2031 (USD 천)
표 100 독일 일본식 레스토랑 시장에서의 전통 일본 요리, 유형별, 2022-2031 (USD 천)
표 101 독일 일본 레스토랑 시장에서의 스시, 유형별, 2022-2031 (USD 천)
표 102 독일 일본 레스토랑 시장에서의 스시, 체인별, 2022-2031 (USD 천)
표 103 독일 일본 레스토랑 시장에서의 스시, 레스토랑 형태별, 2022-2031 (USD 천)
표 104 독일 일본 레스토랑 시장에서의 스시, 2022-2031년 설립별 (USD 천)
표 105 독일 라면, 일본 레스토랑 시장에서, 레스토랑 형태별, 2022-2031 (USD 천)
표 106 독일 라면의 일본 레스토랑 시장 점유율, 2022-2031년(USD 천)
표 107 독일의 일본 레스토랑 시장에서의 덴푸라, 레스토랑 형태별, 2022-2031 (USD 천)
표 108 독일 일본 레스토랑 시장에서의 튀김, 2022-2031년 설립별 (USD 천)
표 109 독일 사시미, 일본 레스토랑 시장에서, 레스토랑 형태별, 2022-2031 (USD 천)
표 110 독일 사시미 일본 레스토랑 시장, 설립별, 2022-2031 (USD 천)
표 111 독일 카이세키, 일본 레스토랑 시장에서, 레스토랑 형태별, 2022-2031 (USD 천)
표 112 독일 가이세키 일본 레스토랑 시장, 설립별, 2022-2031 (USD 천)
표 113 독일 우동/소바, 일본 레스토랑 시장에서, 레스토랑 형태별, 2022-2031 (USD 천)
표 114 독일 우동/소바 일본 레스토랑 시장, 설립별, 2022-2031 (USD 천)
표 115 독일 기타 일본 레스토랑 시장, 레스토랑 형태별, 2022-2031 (USD 천)
표 116 독일 기타 일본 레스토랑 시장, 설립별, 2022-2031 (USD 천)
표 117 독일 특선 일본 요리, 일본 레스토랑 시장에서 유형별, 2022-2031 (USD 천)
표 118 독일 특선 일본 요리, 일본 레스토랑 시장에서, 레스토랑 형태별, 2022-2031 (USD 천)
표 119 독일 특선 일본식 레스토랑 시장에서의 일본식, 설립별, 2022-2031 (USD 천)
표 120 독일 현대 일본 요리, 일본 레스토랑 시장에서 유형별, 2022-2031 (USD 천)
표 121 독일 현대 일본 요리, 일본 레스토랑 시장에서, 레스토랑 형태별, 2022-2031 (USD 천)
표 122 독일 일본식 레스토랑 시장에서의 현대 일본식, 설립별, 2022-2031 (USD 천)
표 123 독일 일본식 레스토랑 시장, 서비스 유형별, 2022-2031 (USD 천)
표 124 독일 일본 레스토랑 시장, 레스토랑 카테고리별, 2022-2031 (USD 천)
표 125 독일 일본 레스토랑 시장, 레스토랑 모델별, 2022-2031 (USD 천)
표 126 독일 일본식 레스토랑 시장, 판매 채널별, 2022-2031 (USD 천)
표 127 영국 일본 레스토랑 시장, 요리 유형별, 2022-2031 (USD 천)
표 128 영국 전통 일본 요리, 일본 레스토랑 시장에서 유형별, 2022-2031 (USD 천)
표 129 영국 스시의 일본 레스토랑 시장 유형별, 2022-2031 (USD 천)
표 130 영국 일본 레스토랑 시장에서의 스시, 체인별, 2022-2031 (USD 천)
표 131 영국 스시의 일본 레스토랑 시장, 레스토랑 모드별, 2022-2031 (USD 천)
표 132 2022-2031년 설립별 일본 레스토랑 시장에서의 영국 스시(USD 천)
표 133 영국 라면의 일본 레스토랑 시장, 레스토랑 형태별, 2022-2031 (USD 천)
표 134 일본 레스토랑 시장에서의 영국 라멘, 2022-2031년 설립별 (USD 천)
표 135 영국 덴푸라, 일본 레스토랑 시장에서, 레스토랑 형태별, 2022-2031 (USD 천)
표 136 영국 덴푸라의 일본 레스토랑 시장, 2022-2031년 설립별 (USD 천)
표 137 영국 사시미, 일본 레스토랑 시장에서, 레스토랑 형태별, 2022-2031 (USD 천)
표 138 영국 사시미 일본 레스토랑 시장, 설립별, 2022-2031 (USD 천)
표 139 영국 가이세키, 일본 레스토랑 시장에서 레스토랑 형태별, 2022-2031 (USD 천)
표 140 영국 가이세키의 일본 레스토랑 시장, 설립별, 2022-2031 (USD 천)
표 141 영국 우동/소바, 일본 레스토랑 시장에서, 레스토랑 형태별, 2022-2031 (USD 천)
표 142 영국 우동/소바 일본 레스토랑 시장, 2022-2031년 설립별 (USD 천)
표 143 영국 기타 일본 레스토랑 시장, 레스토랑 모드별, 2022-2031 (USD 천)
표 144 영국 기타 일본 레스토랑 시장, 설립별, 2022-2031 (USD 천)
표 145 영국 특선 일본 요리, 일본 레스토랑 시장에서 유형별, 2022-2031 (USD 천)
표 146 영국 특선 일본 요리, 일본 레스토랑 시장에서 레스토랑 형태별, 2022-2031 (USD 천)
표 147 영국 특선 일본식 레스토랑 시장 내 일본식 전문점, 2022-2031년 설립 기준 (USD 천 달러)
표 148 영국 현대 일본 요리, 일본 레스토랑 시장에서 유형별, 2022-2031 (USD 천)
표 149 영국 현대 일본 요리, 일본 레스토랑 시장에서, 레스토랑 형태별, 2022-2031 (USD 천)
표 150 영국 현대 일본식 레스토랑 시장, 설립별, 2022-2031 (USD 천)
표 151 영국 일본식 레스토랑 시장, 서비스 유형별, 2022-2031 (USD 천)
표 152 영국 일본 레스토랑 시장, 레스토랑 카테고리별, 2022-2031 (USD 천)
표 153 영국 일본 레스토랑 시장, 레스토랑 모델별, 2022-2031 (USD 천)
표 154 영국 일본식 레스토랑 시장, 판매 채널별, 2022-2031 (USD 천)
표 155 이탈리아 일본식 레스토랑 시장, 요리 유형별, 2022-2031 (USD 천)
표 156 이탈리아 전통 일본 요리, 일본 레스토랑 시장에서 유형별, 2022-2031 (USD 천)
표 157 이탈리아 일본 레스토랑 시장에서의 스시, 유형별, 2022-2031 (USD 천)
표 158 이탈리아 일본 레스토랑 시장에서의 스시, 체인별, 2022-2031 (USD 천)
표 159 이탈리아 일본 레스토랑 시장에서의 스시, 레스토랑 모드별, 2022-2031 (USD 천)
표 160 이탈리아 일본 레스토랑 시장에서의 스시, 설립별, 2022-2031 (USD 천)
표 161 이탈리아 라멘, 일본 레스토랑 시장에서, 레스토랑 형태별, 2022-2031 (USD 천)
표 162 일본 레스토랑 시장의 라멘, 2022-2031년 업체별 (USD 천)
표 163 이탈리아 튀김, 일본 레스토랑 시장에서 레스토랑 모드별, 2022-2031 (USD 천)
표 164 이탈리아 일본 레스토랑 시장에서의 튀김, 2022-2031년 설립별 (USD 천)
표 165 이탈리아 사시미, 일본 레스토랑 시장에서, 레스토랑 모드별, 2022-2031 (USD 천)
표 166 이탈리아 사시미 일본 레스토랑 시장, 설립별, 2022-2031 (USD 천)
표 167 이탈리아 카이세키, 일본 레스토랑 시장에서, 레스토랑 형태별, 2022-2031 (USD 천)
표 168 이탈리아 가이세키 일본 레스토랑 시장, 설립별, 2022-2031 (USD 천)
표 169 이탈리아 우동/소바, 일본 레스토랑 시장에서, 레스토랑 형태별, 2022-2031 (USD 천)
표 170 이탈리아 우동/소바 일본 레스토랑 시장, 설립별, 2022-2031 (USD 천)
표 171 이탈리아 기타 일본 레스토랑 시장, 레스토랑 모드별, 2022-2031 (USD 천)
표 172 이탈리아 기타 일본 레스토랑 시장, 설립별, 2022-2031 (USD 천)
표 173 이탈리아 특선 일본 요리, 일본 레스토랑 시장에서 유형별, 2022-2031 (USD 천)
표 174 이탈리아 특선 일본 요리, 일본 레스토랑 시장에서 레스토랑 유형별, 2022-2031 (USD 천)
표 175 이탈리아 특선 일본식 레스토랑 시장에서의 일본식, 설립별, 2022-2031 (USD 천)
표 176 이탈리아 현대 일본 요리, 일본 레스토랑 시장에서 유형별, 2022-2031 (USD 천)
표 177 이탈리아 현대 일본 요리, 일본 레스토랑 시장에서, 레스토랑 모드별, 2022-2031 (USD 천)
표 178 이탈리아 현대 일본식 레스토랑 시장 내 일본식 레스토랑의 수, 2022-2031년 설립 기준(USD 천)
표 179 이탈리아 일본식 레스토랑 시장, 서비스 유형별, 2022-2031 (USD 천)
표 180 이탈리아 일본식 레스토랑 시장, 레스토랑 카테고리별, 2022-2031 (USD 천)
표 181 이탈리아 일본 레스토랑 시장, 레스토랑 모델별, 2022-2031 (USD 천)
표 182 이탈리아 일본식 레스토랑 시장, 판매 채널별, 2022-2031 (USD 천)
표 183 스페인 일본식 레스토랑 시장, 요리 유형별, 2022-2031 (USD 천)
표 184 스페인 전통 일본 요리, 일본 레스토랑 시장에서 유형별, 2022-2031 (USD 천)
표 185 스페인 스시, 일본 레스토랑 시장, 유형별, 2022-2031 (USD 천)
표 186 스페인 일본 레스토랑 시장에서의 스시, 체인별, 2022-2031 (USD 천)
표 187 스페인 스시, 일본 레스토랑 시장에서, 레스토랑 형태별, 2022-2031 (USD 천)
표 188 스페인 일본 레스토랑 시장에서의 스시, 2022-2031년 설립별 (USD 천)
표 189 스페인 스시의 일본 레스토랑 시장, 레스토랑 모드별, 2022-2031 (USD 천)
표 190 스페인 라면, 일본 레스토랑 시장에서, 레스토랑 형태별, 2022-2031 (USD 천)
표 191 일본 레스토랑 시장에서의 스페인 라멘, 2022-2031년 설립별 (USD 천)
표 192 스페인 튀김, 일본 레스토랑 시장에서 레스토랑 모드별, 2022-2031 (USD 천)
표 193 스페인 튀김 일본 레스토랑 시장에서의 비중, 2022-2031년 설립별 (USD 천)
표 194 스페인 사시미, 일본 레스토랑 시장에서, 레스토랑 형태별, 2022-2031 (USD 천)
표 195 일본 레스토랑 시장에서의 스페인 사시미, 2022-2031년 설립별 (USD 천)
표 196 스페인 카이세키, 일본 레스토랑 시장에서, 레스토랑 형태별, 2022-2031 (USD 천)
표 197 스페인 가이세키, 일본 레스토랑 시장, 설립별, 2022-2031 (USD 천)
표 198 스페인 우동/소바, 일본 레스토랑 시장에서, 레스토랑 형태별, 2022-2031 (USD 천)
표 199 스페인 우동/소바 일본 레스토랑 시장, 설립별, 2022-2031 (USD 천)
표 200 스페인 기타 일본 레스토랑 시장, 레스토랑 모드별, 2022-2031 (USD 천)
표 201 스페인 기타 일본 레스토랑 시장, 설립별, 2022-2031 (USD 천)
표 202 스페인 특선 일본 요리 일본 레스토랑 시장, 유형별, 2022-2031 (USD 천)
표 203 스페인 특선 일본 요리, 일본 레스토랑 시장에서 레스토랑 형태별, 2022-2031 (USD 천)
표 204 스페인 특선 일본식 레스토랑 시장에서의 일본식, 설립별, 2022-2031 (USD 천)
표 205 스페인 현대 일본 요리, 일본 레스토랑 시장에서 유형별, 2022-2031 (USD 천)
표 206 스페인 현대 일본 요리, 일본 레스토랑 시장에서 레스토랑 유형별, 2022-2031 (USD 천)
표 207 스페인 모던 일식당 시장 내 일본식당의 점유율, 2022-2031년 설립 기준 (USD 천)
표 208 스페인 일본식 레스토랑 시장, 서비스 유형별, 2022-2031 (USD 천)
표 209 스페인 일본식 레스토랑 시장, 레스토랑 카테고리별, 2022-2031 (USD 천)
표 210 스페인 일본 레스토랑 시장, 레스토랑 모델별, 2022-2031 (USD 천)
표 211 스페인 일본식 레스토랑 시장, 판매 채널별, 2022-2031 (USD 천)
표 212 러시아 일본식 레스토랑 시장, 요리 유형별, 2022-2031 (USD 천)
표 213 러시아 전통 일본 요리, 일본 레스토랑 시장에서 유형별, 2022-2031 (USD 천)
표 214 일본 레스토랑 시장에서의 러시아 스시, 유형별, 2022-2031 (USD 천)
표 215 러시아 스시의 일본 레스토랑 시장, 체인별, 2022-2031 (USD 천)
표 216 러시아 스시, 일본 레스토랑 시장에서, 레스토랑 형태별, 2022-2031 (USD 천)
표 217 일본 레스토랑 시장에서의 러시아 스시, 2022-2031년 설립별 (USD 천)
표 218 일본 레스토랑 시장에서의 러시아 라멘, 레스토랑 형태별, 2022-2031 (USD 천)
표 219 일본 레스토랑 시장에서의 러시아 라멘, 2022-2031년 설립별 (USD 천)
표 220 러시아 튀김, 일본 레스토랑 시장에서의 레스토랑 모드별, 2022-2031 (USD 천)
표 221 일본 레스토랑 시장에서의 러시아 튀김, 2022-2031년 설립별 (USD 천)
표 222 러시아 사시미, 일본 레스토랑 시장에서, 레스토랑 형태별, 2022-2031 (USD 천)
표 223 일본 레스토랑 시장에서의 러시아 사시미, 2022-2031년 설립별 (USD 천)
표 224 러시아 카이세키, 일본 레스토랑 시장에서, 레스토랑 형태별, 2022-2031 (USD 천)
표 225 일본 레스토랑 시장에서의 러시아 카이세키, 2022-2031년 설립별 (USD 천)
표 226 러시아 우동/소바, 일본 레스토랑 시장에서, 레스토랑 형태별, 2022-2031 (USD 천)
표 227 러시아 우동/소바 일본 레스토랑 시장, 2022-2031년 설립별 (USD 천)
표 228 러시아 기타 일본 레스토랑 시장, 레스토랑 모드별, 2022-2031 (USD 천)
표 229 일본 레스토랑 시장의 러시아 기타 업체, 2022-2031년 설립 기준 (USD 천)
표 230 러시아 특선 일본 요리, 일본 레스토랑 시장에서 유형별, 2022-2031 (USD 천)
표 231 러시아 특선 일본 요리, 일본 레스토랑 시장에서 레스토랑 형태별, 2022-2031 (USD 천)
표 232 러시아 특선 일본식 레스토랑 시장 내 일본식 전문점, 2022-2031년 설립별 (USD 천 달러)
표 233 러시아 현대 일본 요리, 일본 레스토랑 시장에서 유형별, 2022-2031 (USD 천)
표 234 러시아 현대 일본 요리, 일본 레스토랑 시장에서, 레스토랑 형태별, 2022-2031 (USD 천)
표 235 러시아 현대 일본식 레스토랑 시장, 설립별, 2022-2031 (USD 천)
표 236 러시아 일본식 레스토랑 시장, 서비스 유형별, 2022-2031 (USD 천)
표 237 러시아 일본 레스토랑 시장, 레스토랑 카테고리별, 2022-2031 (USD 천)
표 238 러시아 일본 레스토랑 시장, 레스토랑 모델별, 2022-2031 (USD 천)
표 239 러시아 일본식 레스토랑 시장, 판매 채널별, 2022-2031 (USD 천)
표 240 터키 일본 레스토랑 시장, 요리 유형별, 2022-2031 (USD 천)
표 241 일본 레스토랑 시장에서의 터키 전통 일본 요리, 유형별, 2022-2031 (USD 천)
표 242 일본 레스토랑 시장에서의 칠면조 초밥, 유형별, 2022-2031 (USD 천)
표 243 2022-2031년 체인별 일본 레스토랑 시장에서의 칠면조 초밥(USD 천)
표 244 일본 레스토랑 시장에서의 칠면조 초밥, 레스토랑 형태별, 2022-2031 (USD 천)
표 245 일본 레스토랑 시장에서의 칠면조 초밥, 2022-2031년 업체별 (USD 천 달러)
표 246 일본 레스토랑 시장에서의 터키 라멘, 레스토랑 형태별, 2022-2031 (USD 천)
표 247 일본 레스토랑 시장에서의 터키 라멘, 2022-2031년 업체별 (USD 천)
표 248 일본 레스토랑 시장에서의 칠면조 튀김, 레스토랑 유형별, 2022-2031 (USD 천)
표 249 일본 레스토랑 시장에서의 칠면조 튀김, 2022-2031년 업체별 (USD 천)
표 250 일본 레스토랑 시장에서의 칠면조 사시미, 레스토랑 유형별, 2022-2031 (USD 천 달러)
표 251 일본 레스토랑 시장에서의 칠면조 사시미, 2022-2031년 업체별 (USD 천 달러)
표 252 레스토랑 모드별 일본 레스토랑 시장에서의 터키 카이세키, 2022-2031 (USD 천)
표 253 일본 레스토랑 시장에서의 터키 카이세키, 2022-2031년 설립별 (USD 천)
표 254 일본 레스토랑 시장에서의 터키 우동/소바, 레스토랑 형태별, 2022-2031 (USD 천)
표 255 일본 레스토랑 시장에서의 터키 우동/소바, 2022-2031년 업체별 (USD 천 달러)
표 256 일본 레스토랑 시장에서의 터키 기타, 레스토랑 형태별, 2022-2031 (USD 천)
표 257 일본 레스토랑 시장에서의 터키 기타, 2022-2031년 설립 기준 (USD 천)
표 258 일본 레스토랑 시장에서의 터키 특선 일본 요리, 유형별, 2022-2031 (USD 천)
표 259 일본 레스토랑 시장에서의 터키 특선 일본 요리, 레스토랑 유형별, 2022-2031 (USD 천)
표 260 일본 레스토랑 시장에서의 터키 특선 일본식, 2022-2031년 설립별 (USD 천)
표 261 일본 레스토랑 시장에서의 터키 현대 일본 요리, 유형별, 2022-2031 (USD 천)
표 262 2022-2031년 레스토랑 유형에 따른 일본 레스토랑 시장에서의 터키 현대 일본 요리(USD 천 달러)
표 263 2022-2031년 설립별 일본 레스토랑 시장에서의 터키 모던 일본식(USD 천)
표 264 서비스 유형별 터키 일본식 레스토랑 시장, 2022-2031 (USD 천)
표 265 터키 일본식 레스토랑 시장, 레스토랑 카테고리별, 2022-2031 (USD 천)
표 266 터키 일본식 레스토랑 시장, 레스토랑 모델별, 2022-2031 (USD 천)
표 267 터키 일본식 레스토랑 시장, 판매 채널별, 2022-2031 (USD 천)
표 268 스위스 일본 레스토랑 시장, 요리 유형별, 2022-2031 (USD 천)
표 269 스위스 전통 일본 요리, 일본 레스토랑 시장 유형별, 2022-2031 (USD 천)
표 270 스위스의 일본 레스토랑 시장에서의 스시, 유형별, 2022-2031 (USD 천)
표 271 스위스의 일본 레스토랑 시장에서의 스시, 체인별, 2022-2031 (USD 천)
표 272 레스토랑 모드별 일본 레스토랑 시장에서의 스위스 스시, 2022-2031 (USD 천)
표 273 2022-2031년 일본 레스토랑 시장에서의 스위스 스시(USD 천)
표 274 레스토랑 모드별 일본 레스토랑 시장에서의 스위스 라멘, 2022-2031 (USD 천)
표 275 일본 레스토랑 시장에서의 스위스 라멘, 2022-2031년 업체별 (USD 천)
표 276 레스토랑 모드별 일본 레스토랑 시장에서의 스위스 튀김, 2022-2031 (USD 천)
표 277 일본 레스토랑 시장에서의 스위스 튀김, 2022-2031년 업체별 (USD 천)
표 278 레스토랑 모드별 일본 레스토랑 시장에서의 스위스 튀김, 2022-2031 (USD 천)
표 279 레스토랑 모드별 일본 레스토랑 시장에서의 스위스 사시미, 2022-2031 (USD 천)
표 280 일본 레스토랑 시장에서의 스위스 사시미, 2022-2031년 설립별 (USD 천)
표 281 레스토랑 모드별 일본 레스토랑 시장에서의 스위스 가이세키, 2022-2031 (USD 천)
표 282 2022-2031년 설립별 일본 레스토랑 시장에서의 스위스 가이세키(USD 천)
표 283 레스토랑 모드별 일본 레스토랑 시장에서의 스위스 우동/소바, 2022-2031 (USD 천)
표 284 일본 레스토랑 시장에서의 스위스 우동/소바, 2022-2031년 업체별 (USD 천)
표 285 레스토랑 모드별 일본 레스토랑 시장의 스위스 기타, 2022-2031 (USD 천)
표 286 스위스 기타 일본 레스토랑 시장, 설립별, 2022-2031 (USD 천)
표 287 스위스 특선 일본 요리, 일본 레스토랑 시장에서 유형별, 2022-2031 (USD 천)
표 288 스위스 특선 일본 요리, 레스토랑 유형별 일본 레스토랑 시장에서, 2022-2031 (USD 천)
표 289 스위스 특선 일본식 레스토랑 시장에서의 일본식 전문점, 2022-2031년 설립별 (USD 천)
표 290 스위스의 일본식 레스토랑 시장에서의 현대 일본 요리, 유형별, 2022-2031 (USD 천)
표 291 스위스의 일본식 레스토랑 시장에서의 현대 일본 요리, 레스토랑 유형별, 2022-2031 (USD 천)
표 292 스위스의 일본식 레스토랑 시장에서의 현대 일본식, 설립별, 2022-2031 (USD 천)
표 293 스위스 일본식 레스토랑 시장, 서비스 유형별, 2022-2031 (USD 천)
표 294 스위스 일본 레스토랑 시장, 레스토랑 카테고리별, 2022-2031 (USD 천)
표 295 스위스 일본 레스토랑 시장, 레스토랑 모델별, 2022-2031년(USD 천
표 296 스위스 일본 레스토랑 시장, 판매 채널별, 2022-2031 (USD 천)
표 297 벨기에 일본식 레스토랑 시장, 요리 유형별, 2022-2031 (USD 천)
표 298 벨기에 전통 일본 요리, 일본 레스토랑 시장에서 유형별, 2022-2031 (USD 천)
표 299 2022-2031년 유형별 일본 레스토랑 시장에서의 벨기에 스시(USD 천)
표 300 벨기에 스시의 일본 레스토랑 시장, 체인별, 2022-2031 (USD 천)
표 301 벨기에 스시의 일본 레스토랑 시장, 레스토랑 형태별, 2022-2031 (USD 천)
표 302 일본 레스토랑 시장에서의 벨기에 스시, 2022-2031년 설립별 (USD 천)
표 303 2022-2031년 레스토랑 형태별 일본 레스토랑 시장에서의 벨기에 라멘(USD 천)
표 304 일본 레스토랑 시장에서의 벨기에 라멘, 2022-2031년 설립별 (USD 천)
표 305 레스토랑 모드별 일본 레스토랑 시장에서의 벨기에 튀김, 2022-2031 (USD 천)
표 306 일본 레스토랑 시장에서의 벨기에 튀김, 2022-2031년 설립별 (USD 천)
표 307 벨기에 사시미, 일본 레스토랑 시장에서, 레스토랑 형태별, 2022-2031 (USD 천)
표 308 벨기에 카이세키, 일본 레스토랑 시장에서 레스토랑 형태별, 2022-2031 (USD 천)
표 309 일본 레스토랑 시장에서의 벨기에 가이세키, 2022-2031년 설립별 (USD 천)
표 310 벨기에 우동/소바, 일본 레스토랑 시장에서의 레스토랑 형태별, 2022-2031 (USD 천)
표 311 일본 레스토랑 시장에서의 벨기에 우동/소바, 2022-2031년 설립별 (USD 천)
표 312 벨기에 기타 일본 레스토랑 시장, 레스토랑 형태별, 2022-2031 (USD 천)
표 313 벨기에 기타 일본 레스토랑 시장, 설립별, 2022-2031 (USD 천)
표 314 벨기에 특선 일본 요리, 일본 레스토랑 시장에서 유형별, 2022-2031 (USD 천)
표 315 벨기에 특선 일본 요리, 일본 레스토랑 시장에서 레스토랑 형태별, 2022-2031 (USD 천)
표 316 벨기에 특선 일본식 레스토랑 시장에서의 일본식 전문점, 2022-2031년 설립별 (USD 천)
표 317 벨기에 일본식 레스토랑 시장에서의 현대 일본 요리, 유형별, 2022-2031 (USD 천)
표 318 벨기에 현대 일본 요리, 일본 레스토랑 시장에서 레스토랑 유형별, 2022-2031 (USD 천)
표 319 벨기에 현대 일본식 레스토랑 시장 내 일본식 레스토랑의 수, 2022-2031년 설립 기준 (USD 천)
표 320 벨기에 일본식 레스토랑 시장, 서비스 유형별, 2022-2031 (USD 천)
표 321 벨기에 일본식 레스토랑 시장, 레스토랑 카테고리별, 2022-2031 (USD 천)
표 322 벨기에 일본식 레스토랑 시장, 레스토랑 모델별, 2022-2031 (USD 천)
표 323 벨기에 일본식 레스토랑 시장, 판매 채널별, 2022-2031 (USD 천)
표 324 네덜란드 일본 레스토랑 시장, 요리 유형별, 2022-2031 (USD 천)
표 325 2022-2031년 유형별 일본 레스토랑 시장에서의 네덜란드 전통 일본 요리(USD 천)
표 326 2022-2031년 유형별 일본 레스토랑 시장에서의 네덜란드 스시(USD 천)
표 327 2022-2031년 체인별 일본 레스토랑 시장에서의 네덜란드 스시(USD 천)
표 328 네덜란드 스시의 일본 레스토랑 시장, 레스토랑 모드별, 2022-2031 (USD 천)
표 329 2022-2031년 설립별 일본 레스토랑 시장에서의 네덜란드 스시(USD 천)
표 330 2022-2031년 레스토랑 형태별 일본 레스토랑 시장에서의 네덜란드 라멘(USD 천)
표 331 2022-2031년 일본 레스토랑 시장에서의 네덜란드 라멘(USD 천)
표 332 네덜란드의 일본 레스토랑 시장에서의 튀김, 레스토랑 형태별, 2022-2031 (USD 천)
표 333 2022-2031년 일본 레스토랑 시장에서의 네덜란드 튀김(천 달러)
표 334 네덜란드 사시미, 일본 레스토랑 시장에서, 레스토랑 형태별, 2022-2031 (USD 천)
표 335 네덜란드 사시미 일본 레스토랑 시장, 설립별, 2022-2031 (USD 천)
표 336 네덜란드 가이세키, 일본 레스토랑 시장에서, 레스토랑 형태별, 2022-2031 (USD 천)
표 337 네덜란드 가이세키, 일본 레스토랑 시장, 설립별, 2022-2031 (USD 천)
표 338 네덜란드 가이세키, 일본 레스토랑 시장에서, 레스토랑 형태별, 2022-2031 (USD 천)
표 339 네덜란드 우동/소바, 일본 레스토랑 시장, 레스토랑 형태별, 2022-2031 (USD 천)
표 340 네덜란드 우동/소바 일본 레스토랑 시장, 설립별, 2022-2031 (USD 천)
표 341 네덜란드 기타 일본 레스토랑 시장, 레스토랑 형태별, 2022-2031 (USD 천)
표 342 네덜란드 기타 일본 레스토랑 시장, 설립별, 2022-2031 (USD 천)
표 343 2022-2031년 유형별 일본 레스토랑 시장에서 네덜란드 특선 일본 요리(USD 천)
표 344 네덜란드 특선 일본 요리, 일본 레스토랑 시장에서 레스토랑 유형별, 2022-2031 (USD 천)
표 345 네덜란드 특선 일본식 레스토랑 시장 내 일본식 전문점, 2022-2031년 설립별 (USD 천)
표 346 2022-2031년 유형별 일본 레스토랑 시장에서의 네덜란드 현대 일본 요리(USD 천)
표 347 네덜란드 현대 일본 요리, 일본 레스토랑 시장에서 레스토랑 유형별, 2022-2031 (USD 천)
표 348 네덜란드 일본식 레스토랑 시장에서의 현대 일본식, 설립별, 2022-2031 (USD 천)
표 349 네덜란드 일본식 레스토랑 시장, 서비스 유형별, 2022-2031 (USD 천)
표 350 네덜란드 일본 레스토랑 시장, 레스토랑 카테고리별, 2022-2031 (USD 천)
표 351 네덜란드 일본 레스토랑 시장, 레스토랑 모델별, 2022-2031 (USD 천)
표 352 네덜란드 일본 레스토랑 시장, 판매 채널별, 2022-2031 (USD 천)
표 353 유럽 기타 지역 일본식 레스토랑 시장, 요리 유형별, 2022-2031 (USD 천 달러)
그림 목록
그림 1 유럽 일본식 레스토랑 시장
그림 2 유럽 일본 레스토랑 시장: 데이터 삼각 측량
그림 3 유럽 일본 레스토랑 시장: DROC 분석
그림 4 유럽 일본 레스토랑 시장: 유럽 대 지역 시장 분석
그림 5 유럽 일본 레스토랑 시장: 회사 연구 분석
그림 6 유럽 일본 레스토랑 시장: 다변량 모델링
그림 7 유럽 일본 레스토랑 시장: 인터뷰 인구 통계
그림 8 유럽 일본식 레스토랑 시장: DBMR 시장 위치 그리드
그림 9 유럽 일본식 레스토랑 시장: 공급업체 점유율 분석
그림 10 유럽 일본식 레스토랑 시장: 세분화
그림 11 아시아 태평양 지역은 유럽 일본 레스토랑 시장을 지배할 것으로 예상되며 예측 기간 동안 가장 높은 CAGR로 성장할 것으로 예상됩니다.
그림 12 유럽 일본 레스토랑 시장, 요리 유형별, 2023
그림 13 유럽 일본 레스토랑 시장 요약
그림 14 유럽 일본 레스토랑 시장을 위한 경쟁적 전략적 결정
그림 15 일본 대중 문화의 영향은 2024-2031년 예측 기간 동안 유럽 일본 레스토랑 시장을 주도할 것으로 예상됩니다.
그림 16 전통 일본 요리 부문은 2024년과 2031년에 유럽 일본 레스토랑 시장에서 가장 큰 점유율을 차지할 것으로 예상됩니다.
그림 17 아시아 태평양 지역은 2024-2031년 예측 기간 동안 유럽 일본 레스토랑 시장에서 가장 빠르게 성장하는 시장입니다.
가치 사슬 분석 55
그림 18 유럽 일본식 레스토랑 시장의 가치 사슬 분석
그림 19 DROC 분석
그림 20 유럽 일본식 레스토랑 시장: 요리 유형별, 2023년
그림 21 유럽 일본식 레스토랑 시장: 서비스 유형별, 2023년
그림 22 유럽 일본 레스토랑 시장: 레스토랑 카테고리별, 2023
그림 23 유럽 일본 레스토랑 시장: 레스토랑 모델별, 2023
그림 24 유럽 일본식 레스토랑 시장: 판매 채널별, 2023
그림 25 유럽 일본 레스토랑 시장: 스냅샷(2023)
그림 26 유럽 일본식 레스토랑 시장: 회사 점유율 2023(%)

연구 방법론
데이터 수집 및 기준 연도 분석은 대규모 샘플 크기의 데이터 수집 모듈을 사용하여 수행됩니다. 이 단계에는 다양한 소스와 전략을 통해 시장 정보 또는 관련 데이터를 얻는 것이 포함됩니다. 여기에는 과거에 수집한 모든 데이터를 미리 검토하고 계획하는 것이 포함됩니다. 또한 다양한 정보 소스에서 발견되는 정보 불일치를 검토하는 것도 포함됩니다. 시장 데이터는 시장 통계 및 일관된 모델을 사용하여 분석하고 추정합니다. 또한 시장 점유율 분석 및 주요 추세 분석은 시장 보고서의 주요 성공 요인입니다. 자세한 내용은 분석가에게 전화를 요청하거나 문의 사항을 드롭하세요.
DBMR 연구팀에서 사용하는 주요 연구 방법론은 데이터 마이닝, 시장에 대한 데이터 변수의 영향 분석 및 주요(산업 전문가) 검증을 포함하는 데이터 삼각 측량입니다. 데이터 모델에는 공급업체 포지셔닝 그리드, 시장 타임라인 분석, 시장 개요 및 가이드, 회사 포지셔닝 그리드, 특허 분석, 가격 분석, 회사 시장 점유율 분석, 측정 기준, 글로벌 대 지역 및 공급업체 점유율 분석이 포함됩니다. 연구 방법론에 대해 자세히 알아보려면 문의를 통해 업계 전문가에게 문의하세요.
사용자 정의 가능
Data Bridge Market Research는 고급 형성 연구 분야의 선두 주자입니다. 저희는 기존 및 신규 고객에게 목표에 맞는 데이터와 분석을 제공하는 데 자부심을 느낍니다. 보고서는 추가 국가에 대한 시장 이해(국가 목록 요청), 임상 시험 결과 데이터, 문헌 검토, 재생 시장 및 제품 기반 분석을 포함하도록 사용자 정의할 수 있습니다. 기술 기반 분석에서 시장 포트폴리오 전략에 이르기까지 타겟 경쟁업체의 시장 분석을 분석할 수 있습니다. 귀하가 원하는 형식과 데이터 스타일로 필요한 만큼 많은 경쟁자를 추가할 수 있습니다. 저희 분석가 팀은 또한 원시 엑셀 파일 피벗 테이블(팩트북)로 데이터를 제공하거나 보고서에서 사용 가능한 데이터 세트에서 프레젠테이션을 만드는 데 도움을 줄 수 있습니다.











