
Market Analysis and Insights: Asia-Pacific Earplugs Market
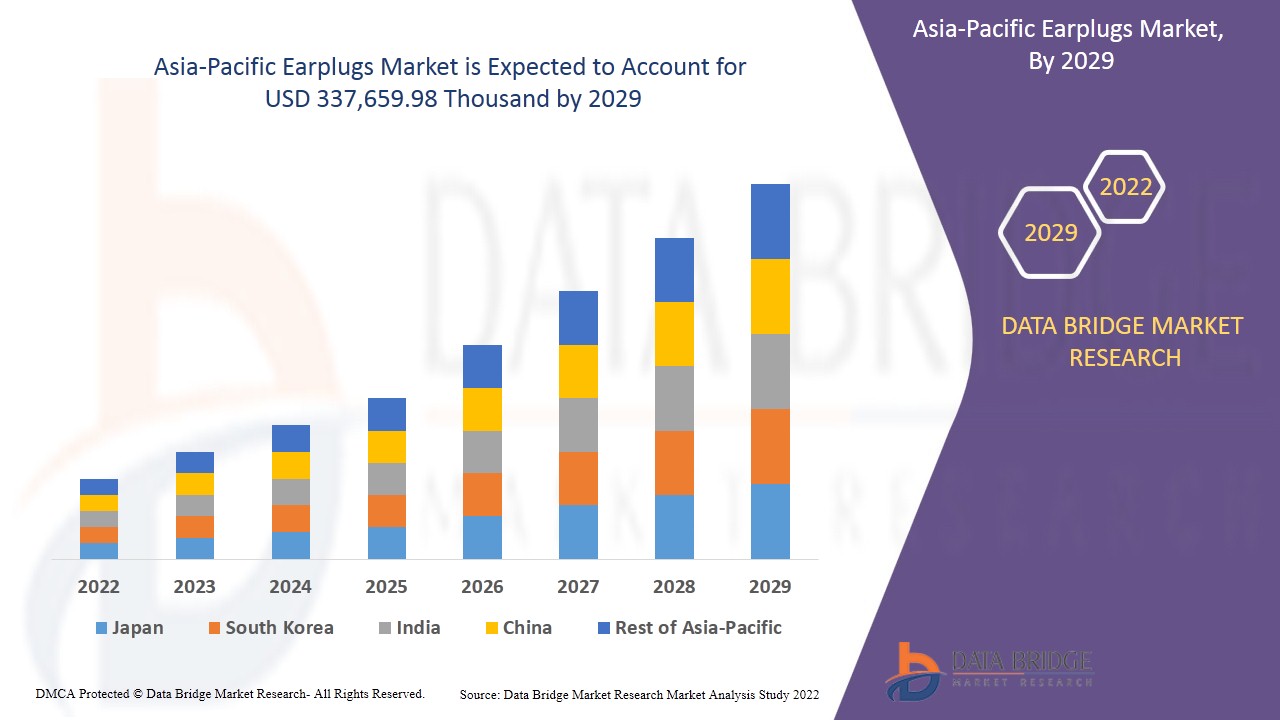
Asia-Pacific earplugs market is expected to gain market growth in the forecast period of 2022 to 2029. Data Bridge Market Research analyses that the market is growing with the CAGR of 8.4% in the forecast period of 2022 to 2029 and expected to reach USD 337,659.98 thousand by 2029. Increase in the requirement of quick-decision making process in biotechnology is e expected to drive the growth of the market significantly.
Earplug is a device that is inserted into the ear to protect the user's ears from loud noises, water intrusion, dust or excessive air. As it lowers the volume of the sound, earplugs are often used to help prevent hearing loss and tinnitus.
molded / moldable plug earplugs can be inserted into the ear canal. They are available as disposable or reusable and can be found in most drug stores and grocery stores. There are mainly four types of earplug fittings for hearing protection: Foam earplugs, mainly made from either polyvinyl chloride (PVC) or polyurethane (PU) (memory foam), wax earplugs, flanged silicone earplugs and custom molded earplugs. Additionally, custom-designed earplugs are available and can be made by visiting your ear doctor or other ear health professional.
Growing use of earplugs in the Asia-Pacific construction & mining activities is the major driving factor in the market. Availability of product substitutes in the industry can prove to be a challenge however rising demand for noise reduction rating (NRR) or noise cancellation devices prove to be an opportunity. The restraint is lack of knowledge regarding the use and importance of earplugs. Also challenges faced due to the impact of Covid-19 on the supply chain of the raw materials are the restraining factors.
The earplugs market report provides details of market share, new developments, and product pipeline analysis, impact of domestic and localized market players, analyses opportunities in terms of emerging revenue pockets, changes in market regulations, product approvals, strategic decisions, product launches, geographic expansions, and technological innovations in the market. To understand the analysis and the Earplugs market scenario contact Data Bridge Market Research for an Analyst Brief, our team will help you create a revenue impact solution to achieve your desired goal.
Earplugs Market Scope and Market Size
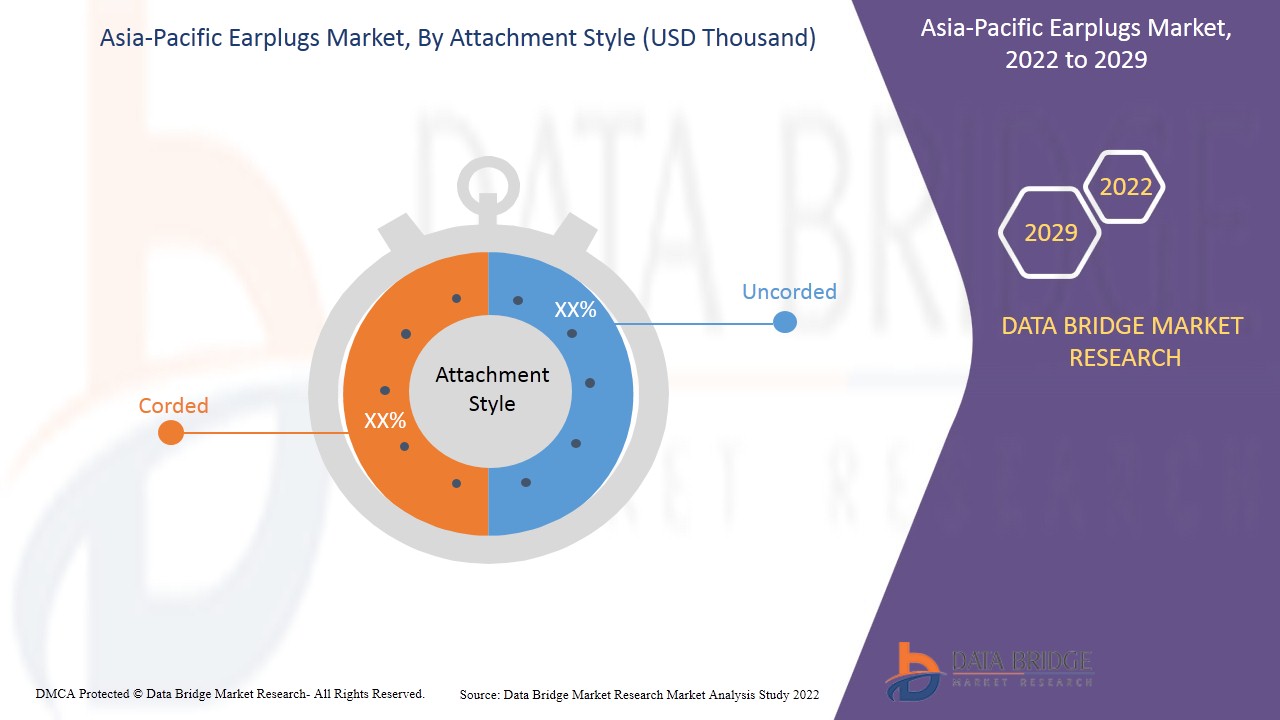
Asia-Pacific earplugs market is segmented into five notable segments namely, attachment style, material, fitting, application and price.
- On the basis of attachment style, the Asia-Pacific earplugs market is categorized into uncorded and corded. In 2022, uncorded is expected to hold the highest segment due to consumer’s preference to disposable and cheaper products.
- On the basis of fitting, the Asia-Pacific earplugs market is categorized into standard and customised. In 2022, standard is expected to hold the highest segment due to easy availability and comparatively low cost.
- On the basis of material, the Asia-Pacific earplugs market is categorized into PVC, silicon, polyurethane, rubber & others. In 2022, PVC is expected to hold the highest segment due to its noise cancellation properties at lower cost.
- On the basis of application, the Asia-Pacific earplugs market is categorized into industrial, household, entertainment, healthcare and others. In 2022, industrial is expected to hold the highest segment due to rising awareness about employee safety at workplaces.
- On the basis of price, the Asia-Pacific earplugs market is categorized into under US $10, US $ 11 to US $50, US $51 to US $100 and above US $100. In 2022, under US$ 10 to hold the highest segment as consumer prefer cheaper and disposable foam earplugs.
Earplugs Market Country Level Analysis
The earplugs market is analyzed and market size information is provided by the country, voltage rating, shed material type, shed design, product type and application as referenced above.
The countries covered in the Earplugs market report are Japan, China, South Korea, India, Australia, Singapore, Thailand, Malaysia, Indonesia, Philippines, and rest of Asia-Pacific. China dominates the Asia Pacific region due its high manufacturing capabilities and government regulations and standards regarding employee safety.
The country section of the report also provides individual market impacting factors and changes in regulation in the market domestically that impacts the current and future trends of the market. Data points such as new sales, replacement sales, country demographics, regulatory acts and import-export tariffs are some of the major pointers used to forecast the market scenario for individual countries. Also, presence and availability of Asia-Pacific brands and their challenges faced due to large or scarce competition from local and domestic brands, impact of sales channels are considered while providing forecast analysis of the country data.
Increasing Adoption of Earplugs in Music and Sleeping Applications to Surge Product Demand is Boosting the Market Growth of Earplugs Market.
The earplugs market also provides you with detailed market analysis for every country growth in particular market. Additionally, it provides the detail information regarding the market players’ strategy and their geographical presence. The data is available for historic period 2012 to 2020.
Competitive Landscape and Earplugs Market Share Analysis
Earplugs market competitive landscape provides details by competitor. Details included are company overview, company financials, revenue generated, market potential, investment in research and development, new market initiatives, production sites and facilities, company strengths and weaknesses, product launch, product trials pipelines, product approvals, patents, product width and breadth, application dominance, technology lifeline curve. The above data points provided are only related to the company’s focus related to earplugs market.
Some of the major players operating in the Asia-Pacific earplugs market are Wavy Ocean earplugs, Moldex-Metric, Honeywell International Inc., Etymotic, HEAROS, EARJOBS, 3M, uvex group, Speedo International Limited among others.
Many new product developments, business expansions, contracts and agreements are also initiated by the companies’ worldwide which are also accelerating the earplugs market.
For instance,
- In March 2021, Honeywell International Inc. has introduced new earplug dispenser featuring antimicrobial protection. This product launch will help the company to diversify the product portfolio and offer wide range of products which can attract customers and accelerate the sales.
- In January 2021, uvex group has acquired majority stakes in Hexarmor. This will help the company to launch new projects under new brand which can include new customer to the company which will strengthen the market position and accelerate the sales.
SKU-

- Interactive Data Analysis Dashboard
- Company Analysis Dashboard for high growth potential opportunities
- Research Analyst Access for customization & queries
- Competitor Analysis with Interactive dashboard
- Latest News, Updates & Trend analysis
- Harness the Power of Benchmark Analysis for Comprehensive Competitor Tracking
Table of Content
1 INTRODUCTION
1.1 OBJECTIVES OF THE STUDY
1.2 MARKET DEFINITION
1.3 OVERVIEW OF ASIA PACIFIC EARPLUGS MARKET
1.4 CURRENCY AND PRICING
1.5 LIMITATION
1.6 MARKETS COVERED
2 MARKET SEGMENTATION
2.1 MARKETS COVERED
2.2 GEOGRAPHICAL SCOPE
2.3 YEARS CONSIDERED FOR THE STUDY
2.4 DBMR TRIPOD DATA VALIDATION MODEL
2.5 PRIMARY INTERVIEWS WITH KEY OPINION LEADERS
2.6 DBMR MARKET POSITION GRID
2.7 VENDOR SHARE ANALYSIS
2.8 MULTIVARIATE MODELING
2.9 COMPONENT TYPE TIMELINE CURVE
2.1 MARKET APPLICATION GRID
2.11 SECONDARY SOURCES
2.12 ASSUMPTIONS
3 EXECUTIVE SUMMARY
4 PREMIUM INSIGHTS
4.1 IMPORT AND EXPORT SCENARIO
4.2 RAW MATERIAL PRODUCTION COVERAGE
4.2.1 SILICON
4.2.2 PVC
4.2.3 POLYURETHANE
4.3 TECHNOLOGICAL ADVANCEMENTS BY MANUFACTURERS
4.4 PORTER'S FIVE FORCES ANALYSIS
4.5 VENDOR SELECTION CRITERIA
4.6 PESTEL ANALYSIS
4.7 REGULATION COVERAGE
4.7.1 PRODUCT CODES
4.7.2 CERTIFIED STANDARDS
4.7.2.1 ANSI S12.6-2016
4.7.2.2 EN 352
4.7.3 SAFETY STANDARDS
4.7.3.1 MATERIAL HANDLING AND STORAGE
4.7.3.2 TRANSPORT & PRECAUTIONS
4.7.3.2.1 227.105 - PROTECTION OF EMPLOYEES:
4.7.3.2.2 227.107 - HEARING CONSERVATION PROGRAM.
4.7.3.3 HAZARD IDENTIFICATION
5 CLIMATE CHANGE SCENARIO
5.1 ENVIRONMENTAL CONCERNS:
5.2 INDUSTRY RESPONSE:
5.3 GOVERNMENT’S ROLE:
6 SUPPLY CHAIN ANALYSIS
6.1 OVERVIEW:
6.2 LOGISTIC COST SCENERIO:
6.3 IMPORTANCE OF LOGISTIC SERVICE PROVIDERS:
7 MARKET OVERVIEW
7.1 DRIVERS
7.1.1 GROWING USE OF EARPLUGS IN CONSTRUCTION AND MINING ACTIVITIES
7.1.2 INCREASING ADOPTION OF EARPLUGS IN MUSIC AND SLEEPING APPLICATIONS
7.1.3 GROWING ACCEPTANCE OF MOLDED EARPLUGS WITH THE USE OF DIFFERENT MATERIAL
7.1.4 GROWING PREVALENCE OF HEARING LOSS
7.2 RESTRAINTS
7.2.1 LACK OF KNOWLEDGE REGARDING THE USE AND IMPORTANCE OF EARPLUGS
7.2.2 HIGHER COST OF CUSTOMIZED EARPLUGS
7.3 OPPORTUNITIES
7.3.1 GOVERNMENT REGULATIONS ON INDUSTRIAL WORKERS AND MILITARY PERSONNEL
7.3.2 INCREASING TECHNOLOGICAL ADVANCEMENTS AND INNOVATIONS FOR EARPLUGS
7.3.3 RISING DEMAND FOR NOISE REDUCTION RATING (NRR) OR NOISE CANCELLATION DEVICES
7.3.4 INCREASE IN USAGE OF EARPLUGS IN MANUFACTURING INDUSTRY
7.4 CHALLENGES
7.4.1 AVAILABILITY OF PRODUCT SUBSTITUTES IN THE INDUSTRY
7.4.2 CONTINUED USE LEADING TO INFECTIONS
8 IMPACT OF COVID-19 ON THE ASIA PACIFIC EARPLUGS MARKET
8.1 ANALYSIS ON IMPACT OF COVID-19 ON THE MARKET
8.2 AFTERMATH OF COVID-19 AND GOVERNMENT INITIATIVES TO BOOST THE MARKET
8.3 STRATEGIC DECISIONS FOR MANUFACTURERS AFTER COVID-19 TO GAIN COMPETITIVE MARKET SHARE
8.4 IMPACT ON PRICE
8.5 IMPACT ON DEMAND
8.6 IMPACT ON SUPPLY CHAIN
8.7 CONCLUSION
9 ASIA PACIFIC EARPLUGS MARKET, BY ATTACHMENT STYLE
9.1 OVERVIEW
9.2 UNCORDED
9.2.1 DISPOSABLE
9.2.2 REUSABLE
9.3 CORDED
9.3.1 DISPOSABLE
9.3.2 REUSABLE
10 ASIA PACIFIC EARPLUGS MARKET, BY FITTING
10.1 OVERVIEW
10.2 STANDARD
10.3 CUSTOMIZED
11 ASIA PACIFIC EARPLUGS MARKET, BY MATERIAL
11.1 OVERVIEW
11.2 PVC
11.3 SILICON
11.4 POLYURETHANE
11.5 RUBBER
11.6 OTHERS
12 ASIA PACIFIC EARPLUGS MARKET, BY APPLICATION
12.1 OVERVIEW
12.2 INDUSTRIAL
12.3 HOUSEHOLD
12.3.1 SLEEP
12.3.2 CONCENTRATION
12.3.3 NOISE SENSITIVITY
12.3.4 DIY
12.3.5 PARENTING
12.3.6 TRAVEL
12.4 ENTERTAINMENT
12.4.1 MUSIC
12.4.2 RECREATIONAL
12.4.3 MOTOR SPORTS
12.5 HEALTHCARE
12.6 OTHERS
13 ASIA PACIFIC EARPLUGS MARKET, BY PRICE
13.1 OVERVIEW
13.2 UNDER US$ 10
13.3 US$ 11- US$ 50
13.4 US$ 51- US$ 100
13.5 ABOVE US$ 100
14 ASIA PACIFIC EARPLUGS MARKET, BY REGION
14.1 ASIA-PACIFIC
14.1.1 CHINA
14.1.2 JAPAN
14.1.3 SOUTH KOREA
14.1.4 INDIA
14.1.5 AUSTRALIA & NEW ZEALAND
14.1.6 SINGAPORE
14.1.7 MALAYSIA
14.1.8 THAILAND
14.1.9 INDONESIA
14.1.10 PHILIPPINES
14.1.11 REST OF ASIA-PACIFIC
15 ASIA PACIFIC EARPLUGS MARKET: COMPANY LANDSCAPE
15.1 COMPANY SHARE ANALYSIS: ASIA PACIFIC
16 SWOT ANALYSIS
17 COMPANY SHARE ANALYSIS
17.1 HONEYWELL INTERNATIONAL INC.
17.1.1 COMPANY SNAPSHOT
17.1.2 REVENUE ANALYSIS
17.1.3 COMPANY SHARE ANALYSIS
17.1.4 PRODUCT PORTFOLIO
17.1.5 RECENT DEVELOPMENTS
17.2 3M
17.2.1 COMPANY SNAPSHOT
17.2.2 REVENUE ANALYSIS
17.2.3 COMPANY SHARE ANALYSIS
17.2.4 PRODUCT PORTFOLIO
17.2.5 RECENT DEVELOPMENTS
17.3 SPEEDO INTERNATIONAL LIMITED
17.3.1 COMPANY SNAPSHOT
17.3.2 COMPANY SHARE ANALYSIS
17.3.3 PRODUCT PORTFOLIO
17.3.4 RECENT DEVELOPMENT
17.4 MOLDEX-METRIC
17.4.1 COMPANY SNAPSHOT
17.4.2 COMPANY SHARE ANALYSIS
17.4.3 PRODUCT PORTFOLIO
17.4.4 RECENT DEVELOPMENT
17.5 HEAROS
17.5.1 COMPANY SNAPSHOT
17.5.2 COMPANY SHARE ANALYSIS
17.5.3 PRODUCT PORTFOLIO
17.5.4 RECENT DEVELOPMENT
17.6 BLOX
17.6.1 COMPANY SNAPSHOT
17.6.2 PRODUCT PORTFOLIO
17.7 DECIBULLZ LLC.
17.7.1 COMPANY SNAPSHOT
17.7.2 PRODUCT PORTFOLIO
17.7.3 RECENT DEVELOPMENTS
17.8 EARGASM
17.8.1 COMPANY SNAPSHOT
17.8.2 PRODUCT PORTFOLIO
17.8.3 RECENT DEVELOPMENT
17.9 EARJOBS
17.9.1 COMPANY SNAPSHOT
17.9.2 PRODUCT PORTFOLI
17.1 EAROS, INC.
17.10.1 COMPANY SNAPSHOT
17.10.2 PRODUCT PORTFOLIO
17.10.3 RECENT DEVELOPMENT
17.11 EAR LABS AB
17.11.1 COMPANY SNAPSHOT
17.11.2 PRODUCT PORTFOLIO
17.11.3 RECENT DEVELOPMENT
17.12 ETYMOTIC
17.12.1 COMPANY SNAPSHOT
17.12.2 PRODUCT PORTFOLIO
17.12.3 RECENT DEVELOPMENT
17.13 HAPPY EARS
17.13.1 COMPANY SNAPSHOT
17.13.2 PRODUCT PORTFOLIO
17.13.3 RECENT DEVELOPMENT
17.14 LIBERTY GLOVE & SAFETY
17.14.1 COMPANY SNAPSHOT
17.14.2 PRODUCT PORTFOLIO
17.14.3 RECENT DEVELOPMENT
17.15 MAGID GLOVE & SAFETY MANUFACTURING COMPANY LLC
17.15.1 COMPANY SNAPSHOT
17.15.2 PRODUCT PORTFOLIO
17.15.3 RECENT DEVELOPMENTS
17.16 MCKEON PRODUCTS, INC.
17.16.1 COMPANY SNAPSHOT
17.16.2 PRODUCT PORTFOLIO
17.16.3 RECENT DEVELOPMENT
17.17 OHROPAX
17.17.1 COMPANY SNAPSHOT
17.17.2 PRODUCT PORTFOLIO
17.17.3 RECENT DEVELOPMENT
17.18 QUIETON
17.18.1 COMPANY SNAPSHOT
17.18.2 PRODUCT PORTFOLIO
17.18.3 RECENT DEVELOPMENTS
17.19 UVEX GROUP
17.19.1 COMPANY SNAPSHOT
17.19.2 PRODUCT PORTFOLIO
17.19.3 RECENT DEVELOPMENTS
17.2 VIBES
17.20.1 COMPANY SNAPSHOT
17.20.2 PRODUCT PORTFOLIO
17.20.3 RECENT DEVELOPMENT
17.21 WAVY OCEAN EARPLUGS
17.21.1 COMPANY SNAPSHOT
17.21.2 PRODUCT PORTFOLIO
17.21.3 RECENT DEVELOPMENT
18 QUESTIONNAIRE
19 RELATED REPORTS
List of Table
TABLE 1 ASIA PACIFIC EARPLUGS MARKET, BY ATTACHMENT STYLE, 2022-2029 (USD THOUSAND)
TABLE 2 ASIA PACIFIC EARPLUGS MARKET, BY ATTACHMENT STYLE, 2022-2029 (THOUSAND PAIRS)
TABLE 3 ASIA PACIFIC UNCORDED IN EARPLUGS MARKET, BY REGION, 2022-2029 (USD THOUSAND)
TABLE 4 ASIA PACIFIC UNCORDED IN EARPLUGS MARKET, BY REGION, 2022-2029 (THOUSAND PAIRS)
TABLE 5 ASIA PACIFIC UNCORDED IN EARPLUGS MARKET, BY TYPE, 2022-2029 (USD THOUSAND)
TABLE 6 ASIA PACIFIC UNCORDED IN EARPLUGS MARKET, BY TYPE, 2022-2029 (THOUSAND PAIRS)
TABLE 7 ASIA PACIFIC CORDED IN EARPLUGS MARKET, BY REGION, 2022-2029 (USD THOUSAND)
TABLE 8 ASIA PACIFIC CORDED IN EARPLUGS MARKET, BY REGION, 2022-2029 (THOUSAND PAIRS)
TABLE 9 ASIA PACIFIC UNCORDED IN EARPLUGS MARKET, BY TYPE, 2022-2029 (USD THOUSAND)
TABLE 10 ASIA PACIFIC UNCORDED IN EARPLUGS MARKET, BY TYPE, 2022-2029 (THOUSAND PAIRS)
TABLE 11 ASIA PACIFIC EARPLUGS MARKET, BY FITTING, 2022-2029 (USD THOUSAND)
TABLE 12 ASIA PACIFIC EARPLUGS MARKET, BY FITTING, 2022-2029 (THOUSAND PAIRS)
TABLE 13 ASIA PACIFIC STANDARD IN EARPLUGS MARKET, BY REGION, 2022-2029 (USD THOUSAND)
TABLE 14 ASIA PACIFIC STANDARD IN EARPLUGS MARKET, BY REGION, 2022-2029 (THOUSAND PAIRS)
TABLE 15 ASIA PACIFIC CUSTOMIZED IN EARPLUGS MARKET, BY REGION, 2022-2029 (USD THOUSAND)
TABLE 16 ASIA PACIFIC CUSTOMIZED IN EARPLUGS MARKET, BY REGION, 2022-2029 (THOUSAND PAIRS)
TABLE 17 ASIA PACIFIC EARPLUGS MARKET, BY MATERIAL, 2022-2029 (USD THOUSAND)
TABLE 18 ASIA PACIFIC EARPLUGS MARKET, BY MATERIAL, 2022-2029 (THOUSAND PAIRS)
TABLE 19 ASIA PACIFIC PVC IN EARPLUGS MARKET, BY REGION, 2022-2029 (USD THOUSAND)
TABLE 20 ASIA PACIFIC PVC IN EARPLUGS MARKET, BY REGION, 2022-2029 (THOUSAND PAIRS)
TABLE 21 ASIA PACIFIC SILICON IN EARPLUGS MARKET, BY REGION, 2022-2029 (USD THOUSAND)
TABLE 22 ASIA PACIFIC SILICON IN EARPLUGS MARKET, BY REGION, 2022-2029 (THOUSAND PAIRS)
TABLE 23 ASIA PACIFIC POLYURETHANE IN EARPLUGS MARKET, BY REGION, 2022-2029 (USD THOUSAND)
TABLE 24 ASIA PACIFIC POLYURETHANE IN EARPLUGS MARKET, BY REGION, 2022-2029 (THOUSAND PAIRS)
TABLE 25 ASIA PACIFIC RUBBER IN EARPLUGS MARKET, BY REGION, 2022-2029 (USD THOUSAND)
TABLE 26 ASIA PACIFIC RUBBER IN EARPLUGS MARKET, BY REGION, 2022-2029 (THOUSAND PAIRS)
TABLE 27 ASIA PACIFIC OTHERS IN EARPLUGS MARKET, BY REGION, 2022-2029 (USD THOUSAND)
TABLE 28 ASIA PACIFIC OTHERS IN EARPLUGS MARKET, BY REGION, 2022-2029 (THOUSAND PAIRS)
TABLE 29 ASIA PACIFIC EARPLUGS MARKET, BY APPLICATION, 2022-2029 (USD THOUSAND)
TABLE 30 ASIA PACIFIC EARPLUGS MARKET, BY APPLICATION, 2022-2029 (THOUSAND PAIRS)
TABLE 31 ASIA PACIFIC INDUSTRIAL IN EARPLUGS MARKET, BY REGION, 2022-2029 (USD THOUSAND)
TABLE 32 ASIA PACIFIC INDUSTRIAL IN EARPLUGS MARKET, BY REGION, 2022-2029 (THOUSAND PAIRS)
TABLE 33 ASIA PACIFIC HOUSEHOLD IN EARPLUGS MARKET, BY REGION, 2022-2029 (USD THOUSAND)
TABLE 34 ASIA PACIFIC HOUSEHOLD IN EARPLUGS MARKET, BY REGION, 2022-2029 (THOUSAND PAIRS)
TABLE 35 ASIA PACIFIC HOUSEHOLD IN EARPLUGS MARKET, BY APPLICATION, 2022-2029 (USD THOUSAND)
TABLE 36 ASIA PACIFIC HOUSEHOLD IN EARPLUGS MARKET, BY APPLICATION, 2022-2029 (THOUSAND PAIRS)
TABLE 37 ASIA PACIFIC ENTERTAINMENT IN EARPLUGS MARKET, BY REGION, 2022-2029 (USD THOUSAND)
TABLE 38 ASIA PACIFIC ENTERTAINMENT IN EARPLUGS MARKET, BY REGION, 2022-2029 (THOUSAND PAIRS)
TABLE 39 ASIA PACIFIC ENTERTAINMENT IN EARPLUGS MARKET, BY APPLICATION, 2022-2029 (USD THOUSAND)
TABLE 40 ASIA PACIFIC ENTERTAINMENT IN EARPLUGS MARKET, BY APPLICATION, 2022-2029 (THOUSAND PAIRS)
TABLE 41 ASIA PACIFIC HEALTHCARE IN EARPLUGS MARKET, BY REGION, 2022-2029 (USD THOUSAND)
TABLE 42 ASIA PACIFIC HEALTHCARE IN EARPLUGS MARKET, BY REGION, 2022-2029 (THOUSAND PAIRS)
TABLE 43 ASIA PACIFIC OTHERS IN EARPLUGS MARKET, BY REGION, 2022-2029 (USD THOUSAND)
TABLE 44 ASIA PACIFIC OTHERS IN EARPLUGS MARKET, BY REGION, 2022-2029 (THOUSAND PAIRS)
TABLE 45 ASIA PACIFIC EARPLUGS MARKET, BY PRICE, 2022-2029 (USD THOUSAND)
TABLE 46 ASIA PACIFIC EARPLUGS MARKET, BY PRICE, 2022-2029 (THOUSAND PAIRS)
TABLE 47 ASIA PACIFIC UNDER US$ 10 IN EARPLUGS MARKET, BY REGION, 2022-2029 (USD THOUSAND)
TABLE 48 ASIA PACIFIC UNDER US$ 10 IN EARPLUGS MARKET, BY REGION, 2022-2029 (THOUSAND PAIRS)
TABLE 49 ASIA PACIFIC US$ 11- US$ 50 IN EARPLUGS MARKET, BY REGION, 2022-2029 (USD THOUSAND)
TABLE 50 ASIA PACIFIC US$ 11- US$ 50 IN EARPLUGS MARKET, BY REGION, 2022-2029 (THOUSAND PAIRS)
TABLE 51 ASIA PACIFIC US$ 51- US$ 100 IN EARPLUGS MARKET, BY REGION, 2022-2029 (USD THOUSAND)
TABLE 52 ASIA PACIFIC US$ 51- US$ 100 IN EARPLUGS MARKET, BY REGION, 2022-2029 (THOUSAND PAIRS)
TABLE 53 ASIA PACIFIC ABOVE US$ 100 IN EARPLUGS MARKET, BY REGION, 2022-2029 (USD THOUSAND)
TABLE 54 ASIA PACIFIC ABOVE US$ 100 IN EARPLUGS MARKET, BY REGION, 2022-2029 (THOUSAND PAIRS)
TABLE 55 ASIA-PACIFIC EARPLUGS MARKET, BY COUNTRY, 2020-2029 (USD THOUSAND)
TABLE 56 ASIA-PACIFIC EARPLUGS MARKET, BY COUNTRY, 2020-2029 (THOUSAND PAIRS)
TABLE 57 ASIA-PACIFIC EARPLUGS MARKET, BY ATTACHMENT STYLE, 2020-2029 (USD THOUSAND)
TABLE 58 ASIA-PACIFIC EARPLUGS MARKET, BY ATTACHMENT STYLE, 2020-2029 (THOUSAND PAIRS)
TABLE 59 ASIA-PACIFIC UNCORDED IN EARPLUGS MARKET, BY TYPE, 2020-2029 (USD THOUSAND)
TABLE 60 ASIA-PACIFIC UNCORDED IN EARPLUGS MARKET, BY TYPE, 2020-2029 (THOUSAND PAIRS)
TABLE 61 ASIA-PACIFIC CORDED IN EARPLUGS MARKET, BY TYPE, 2020-2029 (USD THOUSAND)
TABLE 62 ASIA-PACIFIC CORDED IN EARPLUGS MARKET, BY TYPE, 2020-2029 (THOUSAND PAIRS)
TABLE 63 ASIA-PACIFIC EARPLUGS MARKET, BY FITTING, 2020-2029 (USD THOUSAND)
TABLE 64 ASIA-PACIFIC EARPLUGS MARKET, BY FITTING, 2020-2029 (THOUSAND PAIRS)
TABLE 65 ASIA-PACIFIC EARPLUGS MARKET, BY MATERIAL, 2020-2029 (USD THOUSAND)
TABLE 66 ASIA-PACIFIC EARPLUGS MARKET, BY MATERIAL, 2020-2029 (THOUSAND PAIRS)
TABLE 67 ASIA-PACIFIC EARPLUGS MARKET, BY APPLICATION, 2020-2029 (USD THOUSAND)
TABLE 68 ASIA-PACIFIC EARPLUGS MARKET, BY APPLICATION, 2020-2029 (THOUSAND PAIRS)
TABLE 69 ASIA-PACIFIC HOUSEHOLD IN EARPLUGS MARKET, BY APPLICATION, 2020-2029 (USD THOUSAND)
TABLE 70 ASIA-PACIFIC HOUSEHOLD IN EARPLUGS MARKET, BY APPLICATION, 2020-2029 (THOUSAND PAIRS)
TABLE 71 ASIA-PACIFIC ENTERTAINMENT IN EARPLUGS MARKET, BY APPLICATION, 2020-2029 (USD THOUSAND)
TABLE 72 ASIA-PACIFIC ENTERTAINMENT IN EARPLUGS MARKET, BY APPLICATION, 2020-2029 (THOUSAND PAIRS)
TABLE 73 ASIA-PACIFIC EARPLUGS MARKET, BY PRICE, 2020-2029 (USD THOUSAND)
TABLE 74 ASIA-PACIFIC EARPLUGS MARKET, BY PRICE, 2020-2029 (THOUSAND PAIRS)
TABLE 75 CHINA EARPLUGS MARKET, BY ATTACHMENT STYLE, 2020-2029 (USD THOUSAND)
TABLE 76 CHINA EARPLUGS MARKET, BY ATTACHMENT STYLE, 2020-2029 (THOUSAND PAIRS)
TABLE 77 CHINA EARPLUGS MARKET, BY ATTACHMENT STYLE, 2020-2029 (USD THOUSAND)
TABLE 78 CHINA UNCORDED IN EARPLUGS MARKET, BY TYPE, 2020-2029 (THOUSAND PAIRS)
TABLE 79 CHINA CORDED IN EARPLUGS MARKET, BY TYPE, 2020-2029 (USD THOUSAND)
TABLE 80 CHINA CORDED IN EARPLUGS MARKET, BY TYPE, 2020-2029 (THOUSAND PAIRS)
TABLE 81 CHINA EARPLUGS MARKET, BY FITTING, 2020-2029 (USD THOUSAND)
TABLE 82 CHINA EARPLUGS MARKET, BY FITTING, 2020-2029 (THOUSAND PAIRS)
TABLE 83 CHINA EARPLUGS MARKET, BY MATERIAL, 2020-2029 (USD THOUSAND)
TABLE 84 CHINA EARPLUGS MARKET, BY MATERIAL, 2020-2029 (THOUSAND PAIRS)
TABLE 85 CHINA EARPLUGS MARKET, BY APPLICATION, 2020-2029 (USD THOUSAND)
TABLE 86 CHINA EARPLUGS MARKET, BY APPLICATION, 2020-2029 (THOUSAND PAIRS)
TABLE 87 CHINA HOUSEHOLD IN EARPLUGS MARKET, BY APPLICATION, 2020-2029 (USD THOUSAND)
TABLE 88 CHINA HOUSEHOLD IN EARPLUGS MARKET, BY APPLICATION, 2020-2029 (THOUSAND PAIRS)
TABLE 89 CHINA ENTERTAINMENT IN EARPLUGS MARKET, BY APPLICATION, 2020-2029 (USD THOUSAND)
TABLE 90 CHINA ENTERTAINMENT IN EARPLUGS MARKET, BY APPLICATION, 2020-2029 (THOUSAND PAIRS)
TABLE 91 CHINA EARPLUGS MARKET, BY PRICE, 2020-2029 (USD THOUSAND)
TABLE 92 CHINA EARPLUGS MARKET, BY PRICE, 2020-2029 (THOUSAND PAIRS)
TABLE 93 JAPAN EARPLUGS MARKET, BY ATTACHMENT STYLE, 2020-2029 (USD THOUSAND)
TABLE 94 JAPAN EARPLUGS MARKET, BY ATTACHMENT STYLE, 2020-2029 (THOUSAND PAIRS)
TABLE 95 JAPAN EARPLUGS MARKET, BY ATTACHMENT STYLE, 2020-2029 (USD THOUSAND)
TABLE 96 JAPAN UNCORDED IN EARPLUGS MARKET, BY TYPE, 2020-2029 (THOUSAND PAIRS)
TABLE 97 JAPAN CORDED IN EARPLUGS MARKET, BY TYPE, 2020-2029 (USD THOUSAND)
TABLE 98 JAPAN CORDED IN EARPLUGS MARKET, BY TYPE, 2020-2029 (THOUSAND PAIRS)
TABLE 99 JAPAN EARPLUGS MARKET, BY FITTING, 2020-2029 (USD THOUSAND)
TABLE 100 JAPAN EARPLUGS MARKET, BY FITTING, 2020-2029 (THOUSAND PAIRS)
TABLE 101 JAPAN EARPLUGS MARKET, BY MATERIAL, 2020-2029 (USD THOUSAND)
TABLE 102 JAPAN EARPLUGS MARKET, BY MATERIAL, 2020-2029 (THOUSAND PAIRS)
TABLE 103 JAPAN EARPLUGS MARKET, BY APPLICATION, 2020-2029 (USD THOUSAND)
TABLE 104 JAPAN EARPLUGS MARKET, BY APPLICATION, 2020-2029 (THOUSAND PAIRS)
TABLE 105 JAPAN HOUSEHOLD IN EARPLUGS MARKET, BY APPLICATION, 2020-2029 (USD THOUSAND)
TABLE 106 JAPAN HOUSEHOLD IN EARPLUGS MARKET, BY APPLICATION, 2020-2029 (THOUSAND PAIRS)
TABLE 107 JAPAN ENTERTAINMENT IN EARPLUGS MARKET, BY APPLICATION, 2020-2029 (USD THOUSAND)
TABLE 108 JAPAN ENTERTAINMENT IN EARPLUGS MARKET, BY APPLICATION, 2020-2029 (THOUSAND PAIRS)
TABLE 109 JAPAN EARPLUGS MARKET, BY PRICE, 2020-2029 (USD THOUSAND)
TABLE 110 JAPAN EARPLUGS MARKET, BY PRICE, 2020-2029 (THOUSAND PAIRS)
TABLE 111 SOUTH KOREA EARPLUGS MARKET, BY ATTACHMENT STYLE, 2020-2029 (USD THOUSAND)
TABLE 112 SOUTH KOREA EARPLUGS MARKET, BY ATTACHMENT STYLE, 2020-2029 (THOUSAND PAIRS)
TABLE 113 SOUTH KOREA EARPLUGS MARKET, BY ATTACHMENT STYLE, 2020-2029 (USD THOUSAND)
TABLE 114 SOUTH KOREA UNCORDED IN EARPLUGS MARKET, BY TYPE, 2020-2029 (THOUSAND PAIRS)
TABLE 115 SOUTH KOREA CORDED IN EARPLUGS MARKET, BY TYPE, 2020-2029 (USD THOUSAND)
TABLE 116 SOUTH KOREA CORDED IN EARPLUGS MARKET, BY TYPE, 2020-2029 (THOUSAND PAIRS)
TABLE 117 SOUTH KOREA EARPLUGS MARKET, BY FITTING, 2020-2029 (USD THOUSAND)
TABLE 118 SOUTH KOREA EARPLUGS MARKET, BY FITTING, 2020-2029 (THOUSAND PAIRS)
TABLE 119 SOUTH KOREA EARPLUGS MARKET, BY MATERIAL, 2020-2029 (USD THOUSAND)
TABLE 120 SOUTH KOREA EARPLUGS MARKET, BY MATERIAL, 2020-2029 (THOUSAND PAIRS)
TABLE 121 SOUTH KOREA EARPLUGS MARKET, BY APPLICATION, 2020-2029 (USD THOUSAND)
TABLE 122 SOUTH KOREA EARPLUGS MARKET, BY APPLICATION, 2020-2029 (THOUSAND PAIRS)
TABLE 123 SOUTH KOREA HOUSEHOLD IN EARPLUGS MARKET, BY APPLICATION, 2020-2029 (USD THOUSAND)
TABLE 124 SOUTH KOREA HOUSEHOLD IN EARPLUGS MARKET, BY APPLICATION, 2020-2029 (THOUSAND PAIRS)
TABLE 125 SOUTH KOREA ENTERTAINMENT IN EARPLUGS MARKET, BY APPLICATION, 2020-2029 (USD THOUSAND)
TABLE 126 SOUTH KOREA ENTERTAINMENT IN EARPLUGS MARKET, BY APPLICATION, 2020-2029 (THOUSAND PAIRS)
TABLE 127 SOUTH KOREA EARPLUGS MARKET, BY PRICE, 2020-2029 (USD THOUSAND)
TABLE 128 SOUTH KOREA EARPLUGS MARKET, BY PRICE, 2020-2029 (THOUSAND PAIRS)
TABLE 129 INDIA EARPLUGS MARKET, BY ATTACHMENT STYLE, 2020-2029 (USD THOUSAND)
TABLE 130 INDIA EARPLUGS MARKET, BY ATTACHMENT STYLE, 2020-2029 (THOUSAND PAIRS)
TABLE 131 INDIA EARPLUGS MARKET, BY ATTACHMENT STYLE, 2020-2029 (USD THOUSAND)
TABLE 132 INDIA UNCORDED IN EARPLUGS MARKET, BY TYPE, 2020-2029 (THOUSAND PAIRS)
TABLE 133 INDIA CORDED IN EARPLUGS MARKET, BY TYPE, 2020-2029 (USD THOUSAND)
TABLE 134 INDIA CORDED IN EARPLUGS MARKET, BY TYPE, 2020-2029 (THOUSAND PAIRS)
TABLE 135 INDIA EARPLUGS MARKET, BY FITTING, 2020-2029 (USD THOUSAND)
TABLE 136 INDIA EARPLUGS MARKET, BY FITTING, 2020-2029 (THOUSAND PAIRS)
TABLE 137 INDIA EARPLUGS MARKET, BY MATERIAL, 2020-2029 (USD THOUSAND)
TABLE 138 INDIA EARPLUGS MARKET, BY MATERIAL, 2020-2029 (THOUSAND PAIRS)
TABLE 139 INDIA EARPLUGS MARKET, BY APPLICATION, 2020-2029 (USD THOUSAND)
TABLE 140 INDIA EARPLUGS MARKET, BY APPLICATION, 2020-2029 (THOUSAND PAIRS)
TABLE 141 INDIA HOUSEHOLD IN EARPLUGS MARKET, BY APPLICATION, 2020-2029 (USD THOUSAND)
TABLE 142 INDIA HOUSEHOLD IN EARPLUGS MARKET, BY APPLICATION, 2020-2029 (THOUSAND PAIRS)
TABLE 143 INDIA ENTERTAINMENT IN EARPLUGS MARKET, BY APPLICATION, 2020-2029 (USD THOUSAND)
TABLE 144 INDIA ENTERTAINMENT IN EARPLUGS MARKET, BY APPLICATION, 2020-2029 (THOUSAND PAIRS)
TABLE 145 INDIA EARPLUGS MARKET, BY PRICE, 2020-2029 (USD THOUSAND)
TABLE 146 INDIA EARPLUGS MARKET, BY PRICE, 2020-2029 (THOUSAND PAIRS)
TABLE 147 AUSTRALIA & NEW ZEALAND EARPLUGS MARKET, BY ATTACHMENT STYLE, 2020-2029 (USD THOUSAND)
TABLE 148 AUSTRALIA & NEW ZEALAND EARPLUGS MARKET, BY ATTACHMENT STYLE, 2020-2029 (THOUSAND PAIRS)
TABLE 149 AUSTRALIA & NEW ZEALAND EARPLUGS MARKET, BY ATTACHMENT STYLE, 2020-2029 (USD THOUSAND)
TABLE 150 AUSTRALIA & NEW ZEALAND UNCORDED IN EARPLUGS MARKET, BY TYPE, 2020-2029 (THOUSAND PAIRS)
TABLE 151 AUSTRALIA & NEW ZEALAND CORDED IN EARPLUGS MARKET, BY TYPE, 2020-2029 (USD THOUSAND)
TABLE 152 AUSTRALIA & NEW ZEALAND CORDED IN EARPLUGS MARKET, BY TYPE, 2020-2029 (THOUSAND PAIRS)
TABLE 153 AUSTRALIA & NEW ZEALAND EARPLUGS MARKET, BY FITTING, 2020-2029 (USD THOUSAND)
TABLE 154 AUSTRALIA & NEW ZEALAND EARPLUGS MARKET, BY FITTING, 2020-2029 (THOUSAND PAIRS)
TABLE 155 AUSTRALIA & NEW ZEALAND EARPLUGS MARKET, BY MATERIAL, 2020-2029 (USD THOUSAND)
TABLE 156 AUSTRALIA & NEW ZEALAND EARPLUGS MARKET, BY MATERIAL, 2020-2029 (THOUSAND PAIRS)
TABLE 157 AUSTRALIA & NEW ZEALAND EARPLUGS MARKET, BY APPLICATION, 2020-2029 (USD THOUSAND)
TABLE 158 AUSTRALIA & NEW ZEALAND EARPLUGS MARKET, BY APPLICATION, 2020-2029 (THOUSAND PAIRS)
TABLE 159 AUSTRALIA & NEW ZEALAND HOUSEHOLD IN EARPLUGS MARKET, BY APPLICATION, 2020-2029 (USD THOUSAND)
TABLE 160 AUSTRALIA & NEW ZEALAND HOUSEHOLD IN EARPLUGS MARKET, BY APPLICATION, 2020-2029 (THOUSAND PAIRS)
TABLE 161 AUSTRALIA & NEW ZEALAND ENTERTAINMENT IN EARPLUGS MARKET, BY APPLICATION, 2020-2029 (USD THOUSAND)
TABLE 162 AUSTRALIA & NEW ZEALAND ENTERTAINMENT IN EARPLUGS MARKET, BY APPLICATION, 2020-2029 (THOUSAND PAIRS)
TABLE 163 AUSTRALIA & NEW ZEALAND EARPLUGS MARKET, BY PRICE, 2020-2029 (USD THOUSAND)
TABLE 164 AUSTRALIA & NEW ZEALAND EARPLUGS MARKET, BY PRICE, 2020-2029 (THOUSAND PAIRS)
TABLE 165 SINGAPORE EARPLUGS MARKET, BY ATTACHMENT STYLE, 2020-2029 (USD THOUSAND)
TABLE 166 SINGAPORE EARPLUGS MARKET, BY ATTACHMENT STYLE, 2020-2029 (THOUSAND PAIRS)
TABLE 167 SINGAPORE EARPLUGS MARKET, BY ATTACHMENT STYLE, 2020-2029 (USD THOUSAND)
TABLE 168 SINGAPORE UNCORDED IN EARPLUGS MARKET, BY TYPE, 2020-2029 (THOUSAND PAIRS)
TABLE 169 SINGAPORE CORDED IN EARPLUGS MARKET, BY TYPE, 2020-2029 (USD THOUSAND)
TABLE 170 SINGAPORE CORDED IN EARPLUGS MARKET, BY TYPE, 2020-2029 (THOUSAND PAIRS)
TABLE 171 SINGAPORE EARPLUGS MARKET, BY FITTING, 2020-2029 (USD THOUSAND)
TABLE 172 SINGAPORE EARPLUGS MARKET, BY FITTING, 2020-2029 (THOUSAND PAIRS)
TABLE 173 SINGAPORE EARPLUGS MARKET, BY MATERIAL, 2020-2029 (USD THOUSAND)
TABLE 174 SINGAPORE EARPLUGS MARKET, BY MATERIAL, 2020-2029 (THOUSAND PAIRS)
TABLE 175 SINGAPORE EARPLUGS MARKET, BY APPLICATION, 2020-2029 (USD THOUSAND)
TABLE 176 SINGAPORE EARPLUGS MARKET, BY APPLICATION, 2020-2029 (THOUSAND PAIRS)
TABLE 177 SINGAPORE HOUSEHOLD IN EARPLUGS MARKET, BY APPLICATION, 2020-2029 (USD THOUSAND)
TABLE 178 SINGAPORE HOUSEHOLD IN EARPLUGS MARKET, BY APPLICATION, 2020-2029 (THOUSAND PAIRS)
TABLE 179 SINGAPORE ENTERTAINMENT IN EARPLUGS MARKET, BY APPLICATION, 2020-2029 (USD THOUSAND)
TABLE 180 SINGAPORE ENTERTAINMENT IN EARPLUGS MARKET, BY APPLICATION, 2020-2029 (THOUSAND PAIRS
TABLE 181 SINGAPORE EARPLUGS MARKET, BY PRICE, 2020-2029 (USD THOUSAND)
TABLE 182 SINGAPORE EARPLUGS MARKET, BY PRICE, 2020-2029 (THOUSAND PAIRS)
TABLE 183 MALAYSIA EARPLUGS MARKET, BY ATTACHMENT STYLE, 2020-2029 (USD THOUSAND)
TABLE 184 MALAYSIA EARPLUGS MARKET, BY ATTACHMENT STYLE, 2020-2029 (THOUSAND PAIRS)
TABLE 185 MALAYSIA EARPLUGS MARKET, BY ATTACHMENT STYLE, 2020-2029 (USD THOUSAND)
TABLE 186 MALAYSIA UNCORDED IN EARPLUGS MARKET, BY TYPE, 2020-2029 (THOUSAND PAIRS)
TABLE 187 MALAYSIA CORDED IN EARPLUGS MARKET, BY TYPE, 2020-2029 (USD THOUSAND)
TABLE 188 MALAYSIA CORDED IN EARPLUGS MARKET, BY TYPE, 2020-2029 (THOUSAND PAIRS)
TABLE 189 MALAYSIA EARPLUGS MARKET, BY FITTING, 2020-2029 (USD THOUSAND)
TABLE 190 MALAYSIA EARPLUGS MARKET, BY FITTING, 2020-2029 (THOUSAND PAIRS)
TABLE 191 MALAYSIA EARPLUGS MARKET, BY MATERIAL, 2020-2029 (USD THOUSAND)
TABLE 192 MALAYSIA EARPLUGS MARKET, BY MATERIAL, 2020-2029 (THOUSAND PAIRS)
TABLE 193 MALAYSIA EARPLUGS MARKET, BY APPLICATION, 2020-2029 (USD THOUSAND)
TABLE 194 MALAYSIA EARPLUGS MARKET, BY APPLICATION, 2020-2029 (THOUSAND PAIRS)
TABLE 195 MALAYSIA HOUSEHOLD IN EARPLUGS MARKET, BY APPLICATION, 2020-2029 (USD THOUSAND)
TABLE 196 MALAYSIA HOUSEHOLD IN EARPLUGS MARKET, BY APPLICATION, 2020-2029 (THOUSAND PAIRS)
TABLE 197 MALAYSIA ENTERTAINMENT IN EARPLUGS MARKET, BY APPLICATION, 2020-2029 (USD THOUSAND)
TABLE 198 MALAYSIA ENTERTAINMENT IN EARPLUGS MARKET, BY APPLICATION, 2020-2029 (THOUSAND PAIRS)
TABLE 199 MALAYSIA EARPLUGS MARKET, BY PRICE, 2020-2029 (USD THOUSAND)
TABLE 200 MALAYSIA EARPLUGS MARKET, BY PRICE, 2020-2029 (THOUSAND PAIRS)
TABLE 201 THAILAND EARPLUGS MARKET, BY ATTACHMENT STYLE, 2020-2029 (USD THOUSAND)
TABLE 202 THAILAND EARPLUGS MARKET, BY ATTACHMENT STYLE, 2020-2029 (THOUSAND PAIRS)
TABLE 203 THAILAND UNCORDED IN EARPLUGS MARKET, BY TYPE, 2020-2029 (USD THOUSAND)
TABLE 204 THAILAND UNCORDED IN EARPLUGS MARKET, BY TYPE, 2020-2029 (THOUSAND PAIRS)
TABLE 205 THAILAND CORDED IN EARPLUGS MARKET, BY TYPE, 2020-2029 (USD THOUSAND)
TABLE 206 THAILAND CORDED IN EARPLUGS MARKET, BY TYPE, 2020-2029 (THOUSAND PAIRS)
TABLE 207 THAILAND EARPLUGS MARKET, BY FITTING, 2020-2029 (USD THOUSAND)
TABLE 208 THAILAND EARPLUGS MARKET, BY FITTING, 2020-2029 (THOUSAND PAIRS)
TABLE 209 THAILAND EARPLUGS MARKET, BY MATERIAL, 2020-2029 (USD THOUSAND)
TABLE 210 THAILAND EARPLUGS MARKET, BY MATERIAL, 2020-2029 (THOUSAND PAIRS)
TABLE 211 THAILAND EARPLUGS MARKET, BY APPLICATION, 2020-2029 (USD THOUSAND)
TABLE 212 THAILAND EARPLUGS MARKET, BY APPLICATION, 2020-2029 (THOUSAND PAIRS)
TABLE 213 THAILAND HOUSEHOLD IN EARPLUGS MARKET, BY APPLICATION, 2020-2029 (USD THOUSAND)
TABLE 214 THAILAND HOUSEHOLD IN EARPLUGS MARKET, BY APPLICATION, 2020-2029 (THOUSAND PAIRS)
TABLE 215 THAILAND ENTERTAINMENT IN EARPLUGS MARKET, BY APPLICATION, 2020-2029 (USD THOUSAND)
TABLE 216 THAILAND ENTERTAINMENT IN EARPLUGS MARKET, BY APPLICATION, 2020-2029 (THOUSAND PAIRS)
TABLE 217 THAILAND EARPLUGS MARKET, BY PRICE, 2020-2029 (USD THOUSAND)
TABLE 218 THAILAND EARPLUGS MARKET, BY PRICE, 2020-2029 (THOUSAND PAIRS)
TABLE 219 INDONESIA EARPLUGS MARKET, BY ATTACHMENT STYLE, 2020-2029 (USD THOUSAND)
TABLE 220 INDONESIA EARPLUGS MARKET, BY ATTACHMENT STYLE, 2020-2029 (THOUSAND PAIRS)
TABLE 221 INDONESIA UNCORDED IN EARPLUGS MARKET, BY TYPE, 2020-2029 (USD THOUSAND)
TABLE 222 INDONESIA UNCORDED IN EARPLUGS MARKET, BY TYPE, 2020-2029 (THOUSAND PAIRS)
TABLE 223 INDONESIA CORDED IN EARPLUGS MARKET, BY TYPE, 2020-2029 (USD THOUSAND)
TABLE 224 INDONESIA CORDED IN EARPLUGS MARKET, BY TYPE, 2020-2029 (THOUSAND PAIRS)
TABLE 225 INDONESIA EARPLUGS MARKET, BY FITTING, 2020-2029 (USD THOUSAND)
TABLE 226 INDONESIA EARPLUGS MARKET, BY FITTING, 2020-2029 (THOUSAND PAIRS)
TABLE 227 INDONESIA EARPLUGS MARKET, BY MATERIAL, 2020-2029 (USD THOUSAND)
TABLE 228 INDONESIA EARPLUGS MARKET, BY MATERIAL, 2020-2029 (THOUSAND PAIRS)
TABLE 229 INDONESIA EARPLUGS MARKET, BY APPLICATION, 2020-2029 (USD THOUSAND)
TABLE 230 INDONESIA EARPLUGS MARKET, BY APPLICATION, 2020-2029 (THOUSAND PAIRS)
TABLE 231 INDONESIA HOUSEHOLD IN EARPLUGS MARKET, BY APPLICATION, 2020-2029 (USD THOUSAND)
TABLE 232 INDONESIA HOUSEHOLD IN EARPLUGS MARKET, BY APPLICATION, 2020-2029 (THOUSAND PAIRS)
TABLE 233 INDONESIA ENTERTAINMENT IN EARPLUGS MARKET, BY APPLICATION, 2020-2029 (USD THOUSAND)
TABLE 234 INDONESIA ENTERTAINMENT IN EARPLUGS MARKET, BY APPLICATION, 2020-2029 (THOUSAND PAIRS)
TABLE 235 INDONESIA EARPLUGS MARKET, BY PRICE, 2020-2029 (USD THOUSAND)
TABLE 236 INDONESIA EARPLUGS MARKET, BY PRICE, 2020-2029 (THOUSAND PAIRS)
TABLE 237 PHILIPPINES EARPLUGS MARKET, BY ATTACHMENT STYLE, 2020-2029 (USD THOUSAND)
TABLE 238 PHILIPPINES EARPLUGS MARKET, BY ATTACHMENT STYLE, 2020-2029 (THOUSAND PAIRS)
TABLE 239 PHILIPPINES UNCORDED IN EARPLUGS MARKET, BY TYPE, 2020-2029 (USD THOUSAND)
TABLE 240 PHILIPPINES UNCORDED IN EARPLUGS MARKET, BY TYPE, 2020-2029 (THOUSAND PAIRS)
TABLE 241 PHILIPPINES CORDED IN EARPLUGS MARKET, BY TYPE, 2020-2029 (USD THOUSAND)
TABLE 242 PHILIPPINES CORDED IN EARPLUGS MARKET, BY TYPE, 2020-2029 (THOUSAND PAIRS)
TABLE 243 PHILIPPINES EARPLUGS MARKET, BY FITTING, 2020-2029 (USD THOUSAND)
TABLE 244 PHILIPPINES EARPLUGS MARKET, BY FITTING, 2020-2029 (THOUSAND PAIRS)
TABLE 245 PHILIPPINES EARPLUGS MARKET, BY MATERIAL, 2020-2029 (USD THOUSAND)
TABLE 246 PHILIPPINES EARPLUGS MARKET, BY MATERIAL, 2020-2029 (THOUSAND PAIRS)
TABLE 247 PHILIPPINES EARPLUGS MARKET, BY APPLICATION, 2020-2029 (USD THOUSAND)
TABLE 248 PHILIPPINES EARPLUGS MARKET, BY APPLICATION, 2020-2029 (THOUSAND PAIRS)
TABLE 249 PHILIPPINES HOUSEHOLD IN EARPLUGS MARKET, BY APPLICATION, 2020-2029 (USD THOUSAND)
TABLE 250 PHILIPPINES HOUSEHOLD IN EARPLUGS MARKET, BY APPLICATION, 2020-2029 (THOUSAND PAIRS)
TABLE 251 PHILIPPINES ENTERTAINMENT IN EARPLUGS MARKET, BY APPLICATION, 2020-2029 (USD THOUSAND)
TABLE 252 PHILIPPINES ENTERTAINMENT IN EARPLUGS MARKET, BY APPLICATION, 2020-2029 (THOUSAND PAIRS)
TABLE 253 PHILIPPINES EARPLUGS MARKET, BY PRICE, 2020-2029 (USD THOUSAND)
TABLE 254 PHILIPPINES EARPLUGS MARKET, BY PRICE, 2020-2029 (THOUSAND PAIRS)
TABLE 255 REST OF ASIA-PACIFIC EARPLUGS MARKET, BY ATTACHMENT STYLE, 2020-2029 (USD THOUSAND)
TABLE 256 REST OF ASIA-PACIFIC EARPLUGS MARKET, BY ATTACHMENT STYLE, 2020-2029 (THOUSAND PAIRS)
List of Figure
FIGURE 1 ASIA PACIFIC EARPLUGS MARKET: SEGMENTATION
FIGURE 2 ASIA PACIFIC EARPLUGS MARKET: DATA TRIANGULATION
FIGURE 3 ASIA PACIFIC EARPLUGS MARKET: DROC ANALYSIS
FIGURE 4 ASIA PACIFIC EARPLUGS MARKET: ASIA PACIFIC VS REGIONAL MARKET ANALYSIS
FIGURE 5 ASIA PACIFIC EARPLUGS MARKET: COMPANY RESEARCH ANALYSIS
FIGURE 6 ASIA PACIFIC EARPLUGS MARKET: INTERVIEW DEMOGRAPHICS
FIGURE 7 ASIA PACIFIC EARPLUGS MARKET: DBMR MARKET POSITION GRID
FIGURE 8 ASIA PACIFIC EARPLUGS MARKET: VENDOR SHARE ANALYSIS
FIGURE 9 ASIA PACIFIC EARPLUGS MARKET: MARKET APPLICATION COVERAGE GRID
FIGURE 10 ASIA PACIFIC EARPLUGS MARKET: SEGMENTATION
FIGURE 11 GROWING USE OF EARPLUGS IN CONSTRUCTION AND MINING ACTIVITIES IS EXPECTED TO BOOST ASIA PACIFIC EARPLUGS MARKET IN THE FORECAST PERIOD
FIGURE 12 UNCORDED SEGMENT IS EXPECTED TO ACCOUNT FOR THE LARGEST SHARE OF THE ASIA PACIFIC EARPLUGS MARKET IN 2022 & 2029
FIGURE 13 NORTH AMERICA IS EXPECTED TO DOMINATE AND ASIA-PACIFIC IS THE FASTEST-GROWING REGION IN THE ASIA PACIFIC EARPLUGS MARKET IN THE FORECAST PERIOD
FIGURE 14 DRIVERS, RESTRAINTS, OPPORTUNITIES AND CHALLENGES OF ASIA PACIFIC EARPLUGS MARKET
FIGURE 15 EXPECTED GROWTH IN INFRASTRUCTURE CONSTRUCTION FROM 2020-2030 (IN %)
FIGURE 16 MUSIC INDUSTRY REVENUE WORLDWIDE FROM 2012 TO 2023 (IN BILLION U.S. DOLLARS)
FIGURE 17 ESTIMATED GROWTH RATES PERCENTS OF WORLD MANUFACTURING OUTPUT (Q3 2021 VS. Q3 2020)
FIGURE 18 USER PREFERENCES FOR HEARING PROTECTION (%)
FIGURE 19 ASIA PACIFIC EARPLUGS MARKET, BY ATTACHMENT STYLE, 2021
FIGURE 20 ASIA PACIFIC EARPLUGS MARKET, BY FITTING, 2021
FIGURE 21 ASIA PACIFIC EARPLUGS MARKET, BY MATERIAL, 2021
FIGURE 22 ASIA PACIFIC EARPLUGS MARKET, BY APPLICATION, 2021
FIGURE 23 ASIA PACIFIC EARPLUGS MARKET, BY PRICE, 2021
FIGURE 24 ASIA-PACIFIC EARPLUGS MARKET: SNAPSHOT (2021)
FIGURE 25 ASIA-PACIFIC EARPLUGS MARKET: BY COUNTRY (2021)
FIGURE 26 ASIA-PACIFIC EARPLUGS MARKET: BY COUNTRY (2022 & 2029)
FIGURE 27 ASIA-PACIFIC EARPLUGS MARKET: BY COUNTRY (2021 & 2029)
FIGURE 28 ASIA-PACIFIC EARPLUGS MARKET: BY ATTACHMENT STYLE (2022-2029)
FIGURE 29 ASIA PACIFIC EARPLUGS MARKET: COMPANY SHARE 2021 (%)
Data collection and base year analysis are done using data collection modules with large sample sizes. The stage includes obtaining market information or related data through various sources and strategies. It includes examining and planning all the data acquired from the past in advance. It likewise envelops the examination of information inconsistencies seen across different information sources. The market data is analysed and estimated using market statistical and coherent models. Also, market share analysis and key trend analysis are the major success factors in the market report. To know more, please request an analyst call or drop down your inquiry.
The key research methodology used by DBMR research team is data triangulation which involves data mining, analysis of the impact of data variables on the market and primary (industry expert) validation. Data models include Vendor Positioning Grid, Market Time Line Analysis, Market Overview and Guide, Company Positioning Grid, Patent Analysis, Pricing Analysis, Company Market Share Analysis, Standards of Measurement, Global versus Regional and Vendor Share Analysis. To know more about the research methodology, drop in an inquiry to speak to our industry experts.
Data Bridge Market Research is a leader in advanced formative research. We take pride in servicing our existing and new customers with data and analysis that match and suits their goal. The report can be customized to include price trend analysis of target brands understanding the market for additional countries (ask for the list of countries), clinical trial results data, literature review, refurbished market and product base analysis. Market analysis of target competitors can be analyzed from technology-based analysis to market portfolio strategies. We can add as many competitors that you require data about in the format and data style you are looking for. Our team of analysts can also provide you data in crude raw excel files pivot tables (Fact book) or can assist you in creating presentations from the data sets available in the report.


