
Market Analysis and Insights
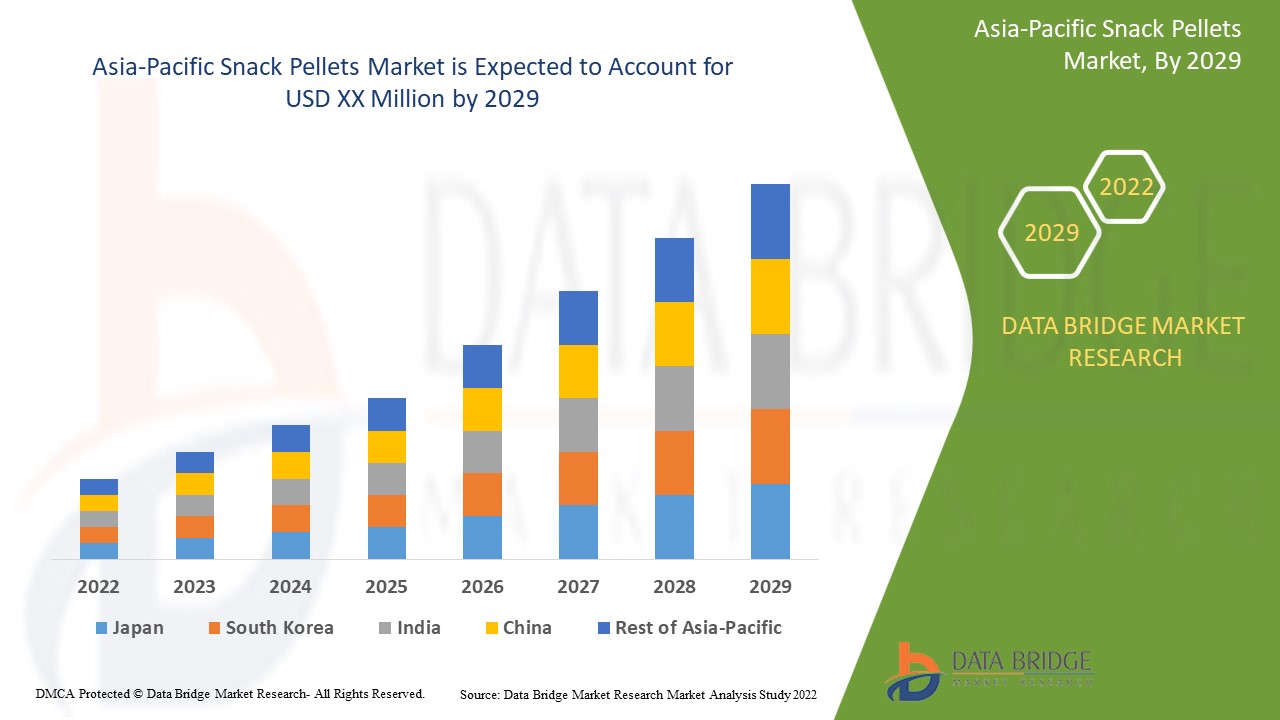
Asia-Pacific snack pellets market is gaining significant growth due to the growing food & beverage industry and the rise in demand for flavored snack pellets. The increase in demand for different types of snack pellets owing to the busy lifestyle is also boosting the growth of the Asia-Pacific snack pellets market. Data Bridge Market Research analyses that the Asia-Pacific snack pellets market will grow at a CAGR of 6.4% during the forecast period of 2022 to 2029.
|
Report Metric |
Details |
|
Forecast Period |
2022 to 2029 |
|
Base Year |
2021 |
|
Historic Year |
2020 (Customizable to 2019- 2015) |
|
Quantitative Units |
Revenue in USD Million |
|
Segments Covered |
By Type (Crackers, Chips, Puffs, and Others), Form (Laminated, Die Faced, Gelatinized, Punched, Die Distance, Tridimensional and Two Dimensional), Shape (Round, Oval, Ring, Triangular, Square, Star, and Others), Ingredients (Potato, Corn, Rice, Tapioca, Multigrain, and Others), Processing Method (Greasy Snack Pellet and Non-Greasy Snack Pellet), Nature (Organic and Conventional), Technique (Single-Screw Extruder and Twin-Screw Extruder), Brand (Branded and Private Label), Flavor (Plain and Flavor), Application (Household and Commercial), Distribution Channel (Direct and Indirect) |
|
Countries Covered |
Japan, China, South Korea, India, Australia, Singapore, Thailand, Indonesia, New Zealand, Vietnam, Malaysia, Philippines, Rest of Asia-Pacific |
|
Market Players Covered |
BACH SNACKS SAL, Calbee, McFills Enterprises Pvt. Ltd., Almounajed Food Industries, Chhajed Foods Pvt. Ltd, mafin, Noble Agro Food Products Private Limited, Oriental Food Industries Sdn. Bhd., VIJAY INDUSTRIES, Kabir Foods, Universal Robina Corporation, JLM Global Foods, Al-Qasrawi, Quality Pellets, The Lorenz Bahlsen Snack-World GmbH & Co KG Germany, BFY BRANDS, TTK, Intersnack Group GmbH & Co. KG, Leng-d'Or, GUANGDONG YUSHENG FOOD INDUSTRIES CO., LTD., among others |
Market Definition
Snack pellets are a semi-finished ingredient which means that once produced by manufacturers, are ready for the customers to manufacture into their finished innovative products. Snack pellets are a versatile, innovative way to disrupt the snacking category. There are many benefits for snack brands to consider pellets within their portfolio. Air-popped/ zero oil new and on-trend bases can be used. Snack pellets can also work without seasoning. Snack pellets hold flavor well. These include various types, flavors, and shapes.
Asia-Pacific Snack Pellets Market Dynamics
Drivers
- Increased consumption of packaged foods due to a busy lifestyle
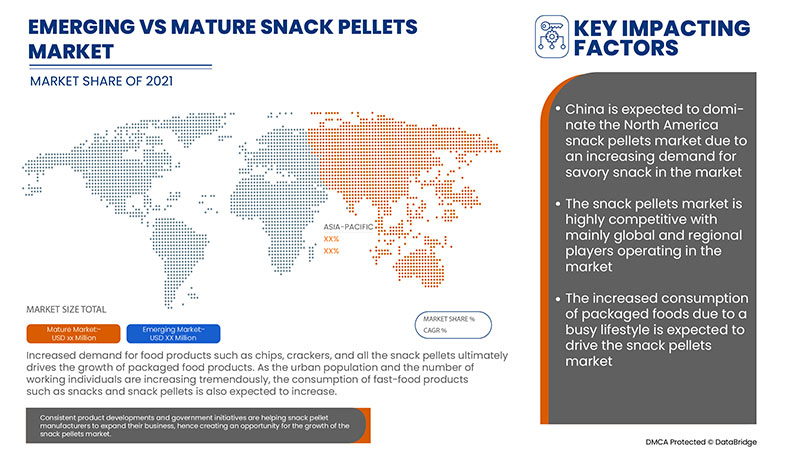
Increased demand for food products such as chips, crackers, and all the snack pellets ultimately drives the growth of packaged food products. As the urban population and the number of working individuals are increasing tremendously, the consumption of fast-food products such as snacks and snack pellets is also gaining pace. Private sectors have a hectic schedule, and it is tiring for employees to spend long hours cooking food. Hence, they prefer packaged food products, such as potato chips, cereal-based chips, crackers, puffs, and others which reduces the time of consumers and helps their busy lifestyle.
Thus, the increased consumption of packaged food is likely to drive the growth of the Asia-Pacific snack pellets market in the forecast period.
- Increase in demand for savory snacks
Increasing demand for convenient food products with easy availability and low cost is one of the major reasons for the high demand for savory snacks such as chips, and crackers, among others.
Snacking between meals has witnessed an upsurge among consumers of all age groups. In addition, consumers are also demanding healthy snacks that combine nutrition and convenience.
Furthermore, consumers spending more time working and studying from home increased their consumption of savory snacks, thus, boosting the demand for snack pellets across the globe. With rising demand and the inability of the brick and mortar stores to fulfill it, consumers shifted their buying preference to online stores. As a result, the savory snacks and snack pellets manufacturers capitalized on such opportunities to optimize their operations and product availability in stores to cater to the growing demand.
Thus, the increased demand for savory snacks and consistent launches and expansion of these products by the manufacturers is driving the market's growth.
Opportunities
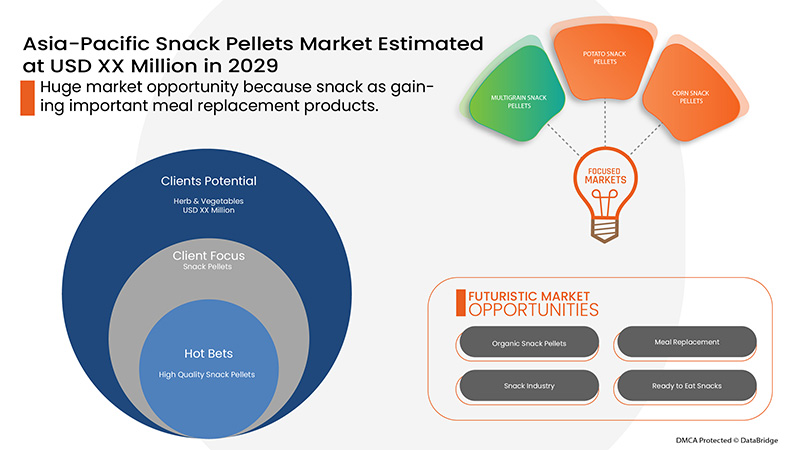
- Emergence of healthy snack pellets
Healthy snacking is no longer a short-lived trend as it has become essential for consumers owing to increased health awareness. To meet the strong consumer expectations and demands, manufacturers are developing healthy snack pellets with an improved nutritional profile.
Introducing healthier snack pellets depends upon the oil type when cooking the snacks. For instance, consumers are now looking for chips cooked with healthier oil options, such as sunflower oil, which has half the saturated fat of cottonseed oil. Sunflower oil instead contains unsaturated fat, a type of fat that's good for the heart. Chips and crackers cooked in soy oil are other options that do not contain saturated fats.
Furthermore, consumers are concerned about the broad spectrum of health concerns, which are related to immunity and various diseases. Thus, consumers are opting for organic and cereal-based food to maintain their health. Thus, snack pellet manufacturers are launching organic and healthy snack pellets to attract consumers.
Restraints/Challenges
- Fluctuating prices of raw materials
As the price of raw materials increases, it affects the whole supply chain from the manufacturers-distribution channel-marketing company and mostly the consumers with low income. If raw material prices increase, the prices of the finished product will also increase. This is the major restraining factor for the snack pellets market. The raw material needed for snack pellets are potatoes, corn, rice, tapioca, multigrain, and others. Increasing prices of these raw materials are expected to hinder the growth of the snack pellets market as snack pellets manufacturers find it difficult to buy raw materials such as potatoes, rice, tapioca, and others amid the fluctuating prices.
Additionally, disruption in the supply chain is also the reason for fluctuating prices of raw materials such as potatoes and rice multigrain. Food and beverage manufacturers depend on the supply of raw materials from domestic to international suppliers. As several governments restricted the movement of goods across countries and locally due to COVID-19, manufacturers had to halt production due to a lack of raw materials.
Thus, the raw material price fluctuations have affected manufacturers adversely, resulting in increased prices of snack pellets. Manufacturers have to cope with such situations and have to handle the sudden increase and decrease in demand for the products. This in turn, is expected to restrain the growth of the Asia-Pacific snack pellets market.
- High cost associated with potato chips machines
The machines and equipment required to manufacture potato chips refers to a set of machines used to produce potato chips from fresh potatoes. In other words, it is a complete potato chips production line with various processing machines. Namely, there are potato sorting and grading machines, potato washing and peeling machines, potato blancher, de-watering machines, chips frying machines, de-oiling and cooling machines, flavoring machines, packaging machines, and product handling machines.
Specifically, in terms of potato chip making, there are two kinds of potato chip manufacturing machines: small potato chip-making machines and automatic ones. The small potato chips making machine, usually semi-automatic, is often used for small chip making, which needs a small production capacity. The fully automatic potato chip manufacturing machine is suitable for large-scale chips businesses that need high production capacity.
The price of potato chips making machines is an important factor to consider for a potato chip manufacturer. However, prices vary for different types of potato chips making machines. For instance, an automatic chip manufacturing machine is more expensive than a small semi-automatic one, and each process line may differ in the price for different components of machines.
Thus, the high cost of these machines makes it difficult for manufacturers to balance the cost structure, and they may increase the overall price of potato chips to maintain their profit margin. Thus, this may create a challenge for the market.
Post COVID-19 Impact on Asia-Pacific Snack Pellets Market
Post COVID-19, the demand for snack pellets is increased in the Asia-Pacific region due to a change in the buying pattern of consumers and a gradual shift towards increasing the demand for snacks among various end-users such as food & beverages and others. Due to the discontinuation of many strict mandates and restraints, manufacturers and producers are able to fulfill the demand for snack pellets in the region. In addition, the increasingly busy work schedules enable consumers to shift towards snacks that can help their hunger and will propel the growth of the market.
The increased demand for different flavored snack pellets enables manufacturers to launch innovative & flavored snack pellets, which ultimately increases the demand for snack pellets, which has helped the market grow.
Recent Developments
- Late July Snacks is a company that produces organic snacks. It offers tortilla chips, potato chips, crackers, popcorn, and salsa and has organic potato chips in its portfolio owing to consumer demand.
- In March 2020, according to food business news, the companies which manufacture packaged food such as snacks and snack pellets in the U.S. retail sales were expected to grow by as much as 15% to 30% on average from March to May 2020 period.
Asia-Pacific Snack Pellets Market Scope
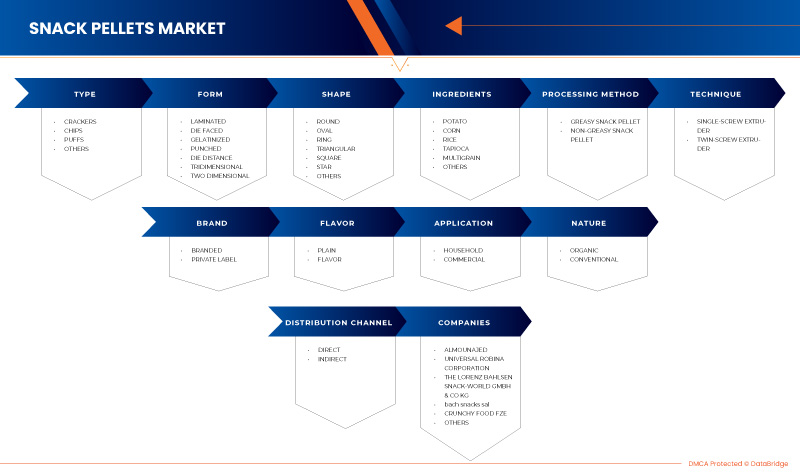
Asia-Pacific snack pellets market is segmented into eleven notable segments based on type, form, shape, ingredients, processing method, nature, technique, brand, flavor, application, and distribution channel. The growth amongst these segments will help you analyze major growth segments in the industries and provide the users with a valuable market overview and market insights to make strategic decisions to identify core market applications.
Type
- Crackers
- Chips
- Puffs
- Others
On the basis of type, the Asia-Pacific snack pellets market is segmented into crackers, chips, puffs, and others.
Form
- Laminated
- Die faced
- Gelatinized
- Punched
- Die distance
- Tridimensional
- Two dimensional
On the basis of form, the Asia-Pacific snack pellets market is segmented into laminated, die faced, gelatinized, punched, die distance, tridimensional, and two dimensional.
Shape
- Round
- Oval
- Ring
- Triangular
- Square
- Star
- Others
On the basis of shape, the Asia-Pacific snack pellets market is segmented into round, oval, ring, triangular, square, star, and others.
Ingredients
- Potato
- Corn
- Rice
- Tapioca
- Multigrain
- Others
On the basis of ingredients, the Asia-Pacific snack pellets market is segmented into potato, corn, rice, tapioca, multigrain, and others.
Processing Method
- Greasy Snack Pellet
- Non-Greasy Snack Pellet
On the basis of processing method, the Asia-Pacific snack pellets market is segmented into greasy snack pellet and non-greasy snack pellet
Nature
- Organic
- Conventional
On the basis of nature, the Asia-Pacific snack pellets market is segmented into organic and conventional.
Technique
- Single-Screw Extruder
- Twin-Screw Extruder
On the basis of technique, the Asia-Pacific snack pellets market is segmented into a single-screw extruder and twin-screw extruder.
Brand
- Branded
- Private label
On the basis of brand, the Asia-Pacific snack pellets market is segmented into branded and private label.
Flavor
- Plain
- Flavor
On the basis of flavor, the Asia-Pacific snack pellets market is segmented into plain and flavor.
Application
- Household
- Commercial
On the basis of application, the Asia-Pacific snack pellets market is segmented into household and commercial.
Distribution Channel
- Direct
- Indirect
On the basis of distribution channel, the Asia-Pacific snack pellets market is segmented into direct and indirect.
Asia-Pacific Snack Pellets Markets Regional Analysis/Insights
The Asia-Pacific snack pellets markets is analyzed, and market size insights and trends are provided based on as referenced above.
The countries covered in the Asia-Pacific snack pellets markets report are Japan, China, South Korea, India, Australia, Singapore, Thailand, Indonesia, New Zealand, Vietnam, Malaysia, Philippines, Rest of Asia-Pacific.
China is expected to dominate the Asia-Pacific snack pellets market due to the growing demand for snack pellets for the fulfillment of consumer demand.
The country section of the report also provides individual market impacting factors and changes in regulations in the market that impact the current and future trends of the market. Data points, such as new and replacement sales, country demographics, disease epidemiology, and import-export tariffs, are some of the major pointers used to forecast the market scenario for individual countries. In addition, the presence and availability of Europe brands and their challenges faced due to high competition from local and domestic brands and the impact of sales channels are considered while providing a forecast analysis of the country data.
Competitive Landscape and Asia-Pacific Snack Pellets Markets Share Analysis
The Asia-Pacific snack pellets market competitive landscape provides details by the competitors. Details included are company overview, company financials, revenue generated, market potential, investment in research and development, new market initiatives, Asia-Pacific presence, production sites and facilities, production capacities, company strengths and weaknesses, product launch, product width and breadth, and application dominance. The above data points provided are only related to the companies' focus on the Asia-Pacific snack pellets market.
Some of the key market players for the Asia-Pacific snack pellets market are BACH SNACKS SAL, Calbee, McFills Enterprises Pvt. Ltd., Almounajed Food Industries, Chhajed Foods Pvt. Ltd, mafin, Noble Agro Food Products Private Limited, Oriental Food Industries Sdn. Bhd., VIJAY INDUSTRIES, Kabir Foods, Universal Robina Corporation, JLM Global Foods, Al-Qasrawi, Quality Pellets, The Lorenz Bahlsen Snack-World GmbH & Co KG Germany, BFY BRANDS, TTK, Intersnack Group GmbH & Co. KG, Leng-d'Or, GUANGDONG YUSHENG FOOD INDUSTRIES CO., LTD., among others.
Research Methodology
Data collection and base year analysis are done using data collection modules with large sample sizes. The market data is analyzed and estimated using market statistical and coherent models. In addition, market share analysis and key trend analysis are the major success factors in the market report. The key research methodology used by the DBMR research team is data triangulation which involves data mining, analysis of the impact of data variables on the market, and primary (industry expert) validation. Apart from this, data models include Vendor Positioning Grid, Market Time Line Analysis, Market Overview and Guide, Company Positioning Grid, Company Market Share Analysis, Standards of Measurement, Asia-Pacific vs. Regional, and Vendor Share Analysis. Please request an analyst call in case of further inquiry.
SKU-

- Interactive Data Analysis Dashboard
- Company Analysis Dashboard for high growth potential opportunities
- Research Analyst Access for customization & queries
- Competitor Analysis with Interactive dashboard
- Latest News, Updates & Trend analysis
- Harness the Power of Benchmark Analysis for Comprehensive Competitor Tracking
Table of Content
1 INTRODUCTION
1.1 OBJECTIVES OF THE STUDY
1.2 MARKET DEFINITION
1.3 OVERVIEW OF THE ASIA PACIFIC SNACK PELLETS MARKET
1.4 LIMITATIONS
1.5 MARKETS COVERED
2 MARKET SEGMENTATION
2.1 MARKETS COVERED
2.2 GEOGRAPHICAL SCOPE
2.3 YEARS CONSIDERED FOR THE STUDY
2.4 CURRENCY AND PRICING
2.5 DBMR TRIPOD DATA VALIDATION MODEL
2.6 MULTIVARIATE MODELLING
2.7 TYPE LIFELINE CURVE
2.8 PRIMARY INTERVIEWS WITH KEY OPINION LEADERS
2.9 DBMR MARKET POSITION GRID
2.1 MARKET APPLICATION COVERAGE GRID
2.11 VENDOR SHARE ANALYSIS
2.12 SECONDARY SOURCES
2.13 ASSUMPTIONS
3 EXECUTIVE SUMMARY
4 PREMIUM INSIGHTS
4.1 BRAND COMPETITIVE ANALYSIS
4.2 LABELING & CLAIMS:
4.3 NEW PRODUCT LAUNCH STRATEGY
4.3.1 OVERVIEW
4.3.2 NUMBER OF PRODUCT LAUNCHES
4.3.2.1 LINE EXTENSION
4.3.2.2 NEW PACKAGING
4.3.2.3 RE-LAUNCHED
4.3.2.4 NEW FORMULATION
4.3.3 DIFFERENTIAL PRODUCT OFFERING
4.3.4 MEETING CONSUMER REQUIREMENT
4.3.5 PACKAGE DESIGNING
4.3.6 PRICING ANALYSIS
4.3.7 PRODUCT POSITIONING
4.3.8 CONCLUSION
4.4 FACTORS INFLUENCING THE PURCHASE
4.5 INDUSTRY TRENDS AND FUTURE PERSPECTIVE:
4.6 PROMOTIONAL ACTIVITIES
4.7 SHOPPING BEHAVIOUR AND DYNAMICS: ASIA PACIFIC SNACKS PELLETS MARKET
4.7.1 RECOMMENDATIONS FROM FAMILY & FRIENDS-
4.7.2 RESEARCH
4.7.3 IMPULSIVE
4.7.4 ADVERTISEMENT:
4.7.4.1 TELEVISION ADVERTISEMENT
4.7.4.2 ONLINE ADVERTISEMENT
4.7.4.3 IN-STORE ADVERTISEMENT
4.7.4.4 OUTDOOR ADVERTISEMENT
4.8 SUPPLY CHAIN ANALYSIS
4.8.1 RAW MATERIAL PROCUREMENT
4.8.2 MANUFACTURING AND DISTRIBUTION
4.8.3 END USERS
4.9 VALUE CHAIN ANALYSIS
4.1 REGULATORY FRAMEWORK
5 MARKET OVERVIEW
5.1 DRIVERS
5.1.1 INCREASED CONSUMPTION OF PACKAGED FOODS DUE TO A BUSY LIFESTYLE
5.1.2 INCREASE IN DEMAND FOR SAVORY SNACKS
5.1.3 INCREASING REPLACEMENT OF MEALS WITH HEALTHY SNACKS
5.1.4 AVAILABILITY OF VARIOUS FLAVOURS IN CHIPS AND CRACKERS
5.2 RESTRAINTS
5.2.1 HEALTH PROBLEMS ASSOCIATED WITH THE HIGHER CONSUMPTION OF PROCESSED POTATO SNACKS
5.2.2 FLUCTUATING PRICES OF RAW MATERIALS
5.3 OPPORTUNITIES
5.3.1 EMERGENCE OF HEALTHY SNACK PELLETS
5.3.2 GOVERNMENT INITIATIVES AND INVESTMENT IN THE PROCESSED INDUSTRY OR SNACK PELLET INDUSTRY
5.3.3 AVAILABILITY OF A WIDE VARIETY OF FORMS, FLAVOURS, AND TASTES IN MULTIGRAIN SNACK PELLETS
5.4 CHALLENGES
5.4.1 HIGH COST ASSOCIATED WITH POTATO CHIPS MACHINES
5.4.2 SUPPLY CHAIN DISRUPTION DUE TO COVID-19
6 ASIA PACIFIC SNACK PELLETS MARKET, BY TYPE
6.1 OVERVIEW
6.2 CHIPS
6.3 PUFFS
6.4 CRACKERS
6.5 OTHERS
7 ASIA PACIFIC SNACK PELLETS MARKET, BY FORM
7.1 OVERVIEW
7.2 TRIDIMENSIONAL
7.3 TWO DIMENSIONAL
7.4 LAMINATED
7.5 DIE DISTANCE
7.6 GELATINIZED
7.7 DIE FACED
7.8 PUNCHED
8 ASIA PACIFIC SNACK PELLETS MARKET, BY BRAND
8.1 OVERVIEW
8.2 BRANDED
8.3 PRIVATE LABEL
9 ASIA PACIFIC SNACK PELLETS MARKET, BY APPLICATION
9.1 OVERVIEW
9.2 COMMERCIAL
9.3 HOUSEHOLD
10 ASIA PACIFIC SNACK PELLETS MARKET, BY PROCESSING METHOD
10.1 OVERVIEW
10.2 REASY SNACK PELLET
10.3 NON-GREASY SNACK PELLET
10.3.1 HOT AIR BAKING
10.3.2 REGULAR BAKED OR ROASTED
11 ASIA PACIFIC SNACK PELLETS MARKET, BY NATURE
11.1 OVERVIEW
11.2 CONVENTIONAL
11.3 ORGANIC
12 ASIA PACIFIC SNACK PELLETS MARKET, BY FLAVOR
12.1 OVERVIEW
12.2 FLAVOR
12.2.1 TOMATO
12.2.2 BBQ
12.2.3 CHEESE
12.2.4 CHOCOLATE
12.2.5 CARAMELIZED
12.2.6 HONEY
12.2.7 HERB
12.2.8 BLACK PEPPER
12.2.9 SALSA
12.2.10 CHILE
12.2.11 LEMON
12.2.12 MINT
12.2.13 JALAPENOS
12.2.14 GARLIC
12.2.15 CHIPOTLE
12.2.16 OTHERS
12.3 PLAIN
13 ASIA PACIFIC SNACK PELLETS MARKET, BY DISTRIBUTION CHANNEL
13.1 OVERVIEW
13.2 INDIRECT
13.2.1 STORE-BASED RETAILING
13.2.1.1 CONVENIENCE STORES
13.2.1.2 SUPERMARKETS/HYPERMARKETS
13.2.1.3 SPECIALTY STORES
13.2.1.4 WHOLESALERS
13.2.1.5 GROCERY STORES
13.2.1.6 OTHERS
13.2.2 NON-STORE RETAILING
13.2.2.1 ONLINE RETAILERS
13.2.2.2 VENDING MACHINE
13.3 DIRECT
14 ASIA PACIFIC SNACK PELLETS MARKET, BY TECHNIQUE
14.1 OVERVIEW
14.2 SINGLE-SCREW EXTRUDER
14.3 TWIN-SCREW EXTRUDER
15 ASIA PACIFIC SNACK PELLETS MARKET, BY SHAPE
15.1 OVERVIEW
15.2 OVAL
15.3 ROUND
15.4 SQUARE
15.5 RING
15.6 TRIANGULAR
15.7 STAR
15.8 OTHERS
16 ASIA PACIFIC SNACK PELLETS MARKET, BY INGREDIENTS
16.1 OVERVIEW
16.2 MULTIGRAIN
16.3 POTATO
16.4 CORN
16.5 RICE
16.6 TAPIOCO
16.7 OTHERS
17 ASIA PACIFIC SNACKS PELLETS MARKET, BY REGION
17.1 ASIA-PACIFIC
17.1.1 CHINA
17.1.2 INDIA
17.1.3 JAPAN
17.1.4 AUSTRALIA
17.1.5 SOUTH KOREA
17.1.6 SINGAPORE
17.1.7 NEW ZEALAND
17.1.8 THAILAND
17.1.9 INDONESIA
17.1.10 MALAYSIA
17.1.11 PHILIPPINES
17.1.12 VIETNAM
17.1.13 REST OF ASIA-PACIFIC
18 ASIA PACIFIC SNACK PELLETS MARKET: COMPANY LANDSCAPE
18.1 COMPANY SHARE ANALYSIS: ASIA PACIFIC
19 SWOT ANALYSIS
20 COMPANY PROFILE
20.1 INTERSNACK GROUP GMBH & CO. KG
20.1.1 COMPANY SNAPSHOT
20.1.2 COMPANY SHARE ANALYSIS
20.1.3 PRODUCT PORTFOLIO
20.1.4 RECENT DEVELOPMENT
20.2 THE LORENZ BAHLSEN SNACK-WORLD GMBH & CO KG GERMANY
20.2.1 COMPANY SNAPSHOT
20.2.2 COMPANY SHARE ANALYSIS
20.2.3 PRODUCT PORTFOLIO
20.2.4 RECENT DEVELOPMENT
20.3 BFY BRANDS
20.3.1 COMPANY SNAPSHOT
20.3.2 COMPANY SHARE ANALYSIS
20.3.3 PRODUCT PORTFOLIO
20.3.4 RECENT DEVELOPMENTS
20.4 MAFIN
20.4.1 COMPANY SANPSHOT
20.4.2 COMPANY SHARE ANALYSIS
20.4.3 PRODUCT PORTFOLIO
20.4.4 RECENT DEVELOPMENTS
20.5 PRODUCTOS ALIMENTICIOS LA MODERNA S.A. DE C.V.
20.5.1 COMPANY SANPSHOT
20.5.2 COMPANY SHARE ANALYSIS
20.5.3 PRODUCT PORTFOLIO
20.5.4 RECENT DEVELOPMENTS
20.6 AKKEL GROUP.
20.6.1 COMPANY SANPSHOT
20.6.2 PRODUCT PORTFOLIO
20.6.3 RECENT DEVELOPMENTS
20.7 ALMOUNAJED FOOD INDUSTRIES
1.7.1 COMPANY SNAPSHOT 236
20.7.1 PRODUCT PORTFOLIO
20.7.2 RECENT DEVELOPMENT
20.8 AL-QASRAWI
20.8.1 COMPANY SNAPSHOT
20.8.2 PRODUCT PORTFOLIO
20.8.3 RECENT DEVELOPMENT
20.9 ATTAYBAT
20.9.1 COMPANY SNAPSHOT
20.9.2 PRODUCT PORTFOLIO
20.9.3 RECENT DEVELOPMENT
20.1 BACH SNACKS SAL
20.10.1 COMPANY SNAPSHOT
20.10.2 PRODUCT PORTFOLIO
20.10.3 RECENT DEVELOPMENT
20.11 BAG SNACKS
20.11.1 COMPANY SNAPSHOT
20.11.2 PRODUCT PORTFOLIO
20.11.3 RECENT DEVELOPMENT
20.12 CALBEE
20.12.1 COMPANY SNAPSHOT
20.12.2 REVENUE ANALYSIS
20.12.3 PRODUCT PORTFOLIO
20.12.4 RECENT DEVELOPMENTS
20.13 CHHAJED FOODS PVT. LTD
20.13.1 COMPANY SANPSHOT
20.13.2 PRODUCT PORTFOLIO
20.13.3 RECENT DEVELOPMENTS
20.14 CRUNCHY FOOD FZE
20.14.1 COMPANY SNAPSHOT
20.14.2 PRODUCT PORTFOLIO
20.14.3 RECENT DEVELOPMENT
20.15 DALMAZA FOOD INDUSTRIES CO. (DAFICO)
20.15.1 COMPANY SNAPSHOT
20.15.2 PRODUCT PORTFOLIO
20.15.3 RECENT DEVELOPMENT
20.16 FIORENTINI ALIMENTARI S.P.A.
20.16.1 COMPANY SANPSHOT
20.16.2 PRODUCT PORTFOLIO
20.16.3 RECENT DEVELOPMENTS
20.17 GUSTINOS
20.17.1 COMPANY SANPSHOT
20.17.2 PRODUCT PORTFOLIO
20.17.3 RECENT DEVELOPMENTS
20.18 J.R. SHORT SNACK PRODUCTS
20.18.1 COMPANY SNAPSHOT
20.18.2 PRODUCT PORTFOLIO
20.18.3 RECENT DEVELOPMENT
20.19 JEDNOŚĆ SP. Z O. O
20.19.1 COMPANY SANPSHOT
20.19.2 PRODUCT PORTFOLIO
20.19.3 RECENT DEVELOPMENTS
20.2 JLM ASIA PACIFIC FOODS
20.20.1 COMPANY SNAPSHOT
20.20.2 PRODUCT PORTFOLIO
20.20.3 RECENT DEVELOPMENT
20.21 JOPELLETS
20.21.1 COMPANY SNAPSHOT
20.21.2 PRODUCT PORTFOLIO
20.21.3 RECENT UPDATE
20.22 KABIR FOODS
20.22.1 COMPANY SNAPSHOT
20.22.2 PRODUCT PORTFOLIO
20.22.3 RECENT DEVELOPMENT
20.23 LC AMERICA, INC.
20.23.1 COMPANY SNAPSHOT
20.23.2 PRODUCT PORTFOLIO
20.23.3 RECENT DEVELOPMENT
20.24 LE CASELLE SPA
20.24.1 COMPANY SANPSHOT
20.24.2 PRODUCT PORTFOLIO
20.24.3 RECENT DEVELOPMENTS
20.25 LENG-D'OR
20.25.1 COMPANY SNAPSHOT
20.25.2 PRODUCT PORTFOLIO
20.25.3 RECENT DEVELOPMENT
20.26 LIMAGRAIN - INGRÉDIENTS
20.26.1 COMPANY SNAPSHOT
20.26.2 PRODUCT PORTFOLIO
20.26.3 RECENT DEVELOPMENT
20.27 MATARILE
20.27.1 COMPANY SNAPSHOT
20.27.2 PRODUCT PORTFOLIO
20.27.3 RECENT DEVELOPMENT
20.28 MCFILLS ENTERPRISES PVT. LTD.
20.28.1 COMPANY SNAPSHOT
20.28.2 PRODUCT PORTFOLIO
20.28.3 RECENT DEVELOPMENT
20.29 GRUPO MICHEL
20.29.1 COMPANY SNAPSHOT
20.29.2 PRODUCT PORTFOLIO
20.29.3 RECENT DEVELOPMENT
20.3 NOBLE AGRO FOOD PRODUCTS PRIVATE LIMITED
20.30.1 COMPANY SANPSHOT
20.30.2 PRODUCT PORTFOLIO
20.30.3 RECENT DEVELOPMENT
20.31 NUTRADIA
20.31.1 COMPANY SNAPSHOT
20.31.2 PRODUCT PORTFOLIO
20.31.3 RECENT DEVELOPMENT
20.32 ORIENTAL FOOD INDUSTRIES SDN. BHD.
20.32.1 COMPANY SANPSHOT
20.32.2 REVENUE ANALYSIS
20.32.3 PRODUCT PORTFOLIO
20.32.4 RECENT DEVELOPMENTS
20.33 PALMEX
20.33.1 COMPANY SANPSHOT
20.33.2 PRODUCT PORTFOLIO
20.33.3 RECENT DEVELOPMENTS
20.34 PELLSNACK PRODUCTS GMBH
20.34.1 COMPANY SNAPSHOT
20.34.2 PRODUCT PORTFOLIO
20.34.3 RECENT DEVELOPMENT
20.35 POL-FOODS SP. Z O.O.
20.35.1 COMPANY SNAPSHOT
20.35.2 PRODUCT PORTFOLIO
20.35.3 RECENT DEVELOPMENT
20.36 POPCHIPS
20.36.1 COMPANY SNAPSHOT
20.36.2 PRODUCT PORTFOLIO
20.36.3 RECENT UPDATE
20.37 QUALITY PELLETS
20.37.1 COMPANY SNAPSHOT
20.37.2 PRODUCT PORTFOLIO
20.37.3 RECENT DEVELOPMENT
20.38 ROGER&ROGER
20.38.1 COMPANY SANPSHOT
20.38.2 PRODUCT PORTFOLIO
20.38.3 RECENT DEVELOPMENTS
20.39 GUANGDONG YUSHENG FOOD INDUSTRIES CO., LTD.
20.39.1 COMPANY SNAPSHOT
20.39.2 PRODUCT PORTFOLIO
20.39.3 RECENT DEVELOPMENT
20.4 SIBELL
20.40.1 COMPANY SNAPSHOT
20.40.2 PRODUCT PORTFOLIO
20.40.3 RECENT DEVELOPMENTS
20.41 SNACK CREATIONS LTD.
20.41.1 COMPANY SANPSHOT
20.41.2 PRODUCT PORTFOLIO
20.41.3 RECENT DEVELOPMENTS
20.42 SNACKLETS
20.43 SOLINO GROUP
20.43.1 COMPANY SNAPSHOT
20.43.2 PRODUCT PORTFOLIO
20.43.3 RECENT DEVELOPMENT
20.44 TTK
20.44.1 COMPANY SNAPSHOT
20.44.2 REVENUE ANALYSIS
20.44.3 PRODUCT PORTFOLIO
20.44.4 RECENT DEVELOPMENT
20.45 UNIVERSAL ROBINA CORPORATION
20.45.1 COMPANY SNAPSHOT
20.45.2 REVENUE ANALYSIS
20.45.3 PRODUCT PORTFOLIO
20.45.4 RECENT DEVELOPMENTS
20.46 V.AL.IN. SRL
20.46.1 COMPANY SNAPSHOT
20.46.2 PRODUCT PORTFOLIO
20.46.3 RECENT DEVELOPMENT
20.47 VIJAY INDUSTRIES
20.47.1 COMPANY SNAPSHOT
20.47.2 PRODUCT PORTFOLIO
20.47.3 RECENT DEVELOPMENT
20.48 VMF (VAN MARCKE FOODS) CONTINENTAL SNACKS
20.48.1 COMPANY SNAPSHOT
20.48.2 PRODUCT PORTFOLIO
20.48.3 RECENT DEVELOPMENT
20.49 YUPI SAS
20.49.1 COMPANY SNAPSHOT
20.49.2 PRODUCT PORTFOLIO
20.49.3 RECENT DEVELOPMENT
21 QUESTIONNAIRE
22 RELATED REPORTS
List of Table
TABLE 1 NUTRITIONAL BENEFITS OF HEALTHY SNACK PELLETS:
TABLE 2 FLAVORS AND INGREDIENTS OF MULTIGRAIN PELLETS
TABLE 3 ASIA PACIFIC SNACK PELLETS MARKET, BY TYPE, 2020-2029 (USD MILLION)
TABLE 4 ASIA PACIFIC CHIPS IN SNACK PELLETS MARKET, BY REGION, 2020-2029 (USD MILLION)
TABLE 5 ASIA PACIFIC PUFFS IN SNACK PELLETS MARKET, BY REGION, 2020-2029 (USD MILLION)
TABLE 6 ASIA PACIFIC CRACKERS IN SNACK PELLETS MARKET, BY REGION, 2020-2029 (USD MILLION)
TABLE 7 ASIA PACIFIC OTHERS IN SNACK PELLETS MARKET, BY REGION, 2020-2029 (USD MILLION)
TABLE 8 ASIA PACIFIC SNACK PELLETS MARKET, BY FORM, 2020-2029 (USD MILLION)
TABLE 9 ASIA PACIFIC TRIDIMENSIONAL IN SNACK PELLETS MARKET, BY REGION, 2020-2029 (USD MILLION)
TABLE 10 ASIA PACIFIC TWO DIMENSIONAL IN SNACK PELLETS MARKET, BY REGION, 2020-2029 (USD MILLION)
TABLE 11 ASIA PACIFIC LAMINATED IN SNACK PELLETS MARKET, BY REGION, 2020-2029 (USD MILLION)
TABLE 12 ASIA PACIFIC DIE DISTANCE IN ASIA PACIFIC SNACK PELLETS MARKET, BY REGION, 2020-2029 (USD MILLION)
TABLE 13 ASIA PACIFIC GELATINIZED IN SNACK PELLETS MARKET, BY REGION, 2020-2029 (USD MILLION)
TABLE 14 ASIA PACIFIC DIE FACED IN SNACK PELLETS MARKET, BY REGION, 2020-2029 (USD MILLION)
TABLE 15 ASIA PACIFIC PUNCHED IN SNACK PELLETS MARKET, BY REGION, 2020-2029 (USD MILLION)
NOTE: PERCENTAGE IN THE FIGURE REPRESENT CAGR OF THE SEGMENT 90
TABLE 16 ASIA PACIFIC SNACK PELLETS MARKET, BY BRAND, 2020-2029 (USD MILLION)
TABLE 17 ASIA PACIFIC BRANDED IN SNACK PELLETS MARKET, BY REGION, 2020-2029 (USD MILLION)
TABLE 18 ASIA PACIFIC PRIVATE-LABEL IN SNACK PELLETS MARKET, BY REGION, 2020-2029 (USD MILLION)
NOTE: PERCENTAGE IN THE FIGURE REPRESENT CAGR OF THE SEGMENT 94
TABLE 19 ASIA PACIFIC SNACK PELLETS MARKET, BY APPLICATION, 2020-2029 (USD MILLION)
TABLE 20 ASIA PACIFIC COMMERCIAL IN ASIA PACIFIC SNACK PELLETS MARKET, BY REGION, 2020-2029 (USD MILLION)
TABLE 21 ASIA PACIFIC HOUSEHOLD IN ASIA PACIFIC SNACK PELLETS MARKET, BY REGION, 2020-2029 (USD MILLION)
TABLE 22 ASIA PACIFIC SNACK PELLETS MARKET, BY PROCESSING METHOD, 2020-2029 (USD MILLION)
TABLE 23 ASIA PACIFIC GREASY SNACK PELLET IN SNACK PELLETS MARKET, BY REGION, 2020-2029 (USD MILLION)
TABLE 24 ASIA PACIFIC NON-GREASY SNACK PELLET IN SNACK PELLETS MARKET, BY REGION, 2020-2029 (USD MILLION)
TABLE 25 ASIA PACIFIC NON-GREASY SNACK PELLET IN SNACK PELLETS MARKET, BY PROCESSING METHOD, 2020-2029 (USD MILLION)
TABLE 26 ASIA PACIFIC SNACK PELLETS MARKET, BY NATURE, 2020-2029 (USD MILLION)
TABLE 27 ASIA PACIFIC CONVENTIONAL IN SNACK PELLETS MARKET, BY REGION, 2020-2029 (USD MILLION)
TABLE 28 ASIA PACIFIC ORGANIC IN SNACK PELLETS MARKET, BY REGION, 2020-2029 (USD MILLION)
TABLE 29 ASIA PACIFIC SNACK PELLETS MARKET, BY FLAVOR, 2020-2029 (USD MILLION)
TABLE 30 ASIA PACIFIC FLAVOR IN SNACK PELLETS MARKET, BY REGION, 2020-2029 (USD MILLION)
TABLE 31 ASIA PACIFIC FLAVOR IN SNACK PELLETS MARKET, BY FLAVOR, 2020-2029 (USD MILLION)
TABLE 32 ASIA PACIFIC PLAIN IN SNACK PELLETS MARKET, BY REGION, 2020-2029 (USD MILLION)
TABLE 33 ASIA PACIFIC SNACK PELLETS MARKET, BY DISTRIBUTION CHANNEL, 2020-2029 (USD MILLION)
TABLE 34 ASIA PACIFIC INDIRECT IN SNACK PELLETS MARKET, BY REGION, 2020-2029 (USD MILLION)
TABLE 35 ASIA PACIFIC INDIRECT IN SNACK PELLETS MARKET, BY DISTRIBUTION CHANNEL, 2020-2029 (USD MILLION)
TABLE 36 ASIA PACIFIC STORE-BASED RETAILING IN SNACK PELLETS MARKET, BY DISTRIBUTION CHANNEL, 2020-2029 (USD MILLION)
TABLE 37 ASIA PACIFIC NON-STORE-BASED RETAILING IN SNACK PELLETS MARKET, BY DISTRIBUTION CHANNEL, 2020-2029 (USD MILLION)
TABLE 38 ASIA PACIFIC DIRECT IN SNACK PELLETS MARKET, BY REGION, 2020-2029 (USD MILLION)
TABLE 39 ASIA PACIFIC SNACK PELLETS MARKET, BY TECHNIQUE, 2020-2029 (USD MILLION)
TABLE 40 ASIA PACIFIC SINGLE-SCREW EXTRUDER IN SNACK PELLETS MARKET, BY REGION, 2020-2029 (USD MILLION)
TABLE 41 ASIA PACIFIC TWIN-SCREW EXTRUDER IN SNACK PELLETS MARKET, BY REGION, 2020-2029 (USD MILLION)
TABLE 42 ASIA PACIFIC SNACK PELLETS MARKET, BY SHAPE, 2020-2029 (USD MILLION)
TABLE 43 ASIA PACIFIC OVAL IN SNACK PELLETS MARKET, BY REGION, 2020-2029 (USD MILLION)
TABLE 44 ASIA PACIFIC ROUND IN SNACK PELLETS MARKET, BY REGION, 2020-2029 (USD MILLION)
TABLE 45 ASIA PACIFIC SQUARE IN SNACK PELLETS MARKET, BY REGION, 2020-2029 (USD MILLION)
TABLE 46 ASIA PACIFIC RING IN SNACK PELLETS MARKET, BY REGION, 2020-2029 (USD MILLION)
TABLE 47 ASIA PACIFIC TRIANGULAR IN SNACK PELLETS MARKET, BY REGION, 2020-2029 (USD MILLION)
TABLE 48 ASIA PACIFIC STAR IN SNACK PELLETS MARKET, BY REGION, 2020-2029 (USD MILLION)
TABLE 49 ASIA PACIFIC OTHERS IN SNACK PELLETS MARKET, BY REGION, 2020-2029 (USD MILLION)
TABLE 50 ASIA PACIFIC SNACK PELLETS MARKET, BY INGREDIENTS, 2020-2029 (USD MILLION)
TABLE 51 ASIA PACIFIC MULTIGRAIN IN SNACK PELLETS MARKET, BY REGION, 2020-2029 (USD MILLION)
TABLE 52 ASIA PACIFIC POTATO IN SNACK PELLETS MARKET, BY REGION, 2020-2029 (USD MILLION)
TABLE 53 ASIA PACIFIC CORN IN SNACK PELLETS MARKET, BY REGION, 2020-2029 (USD MILLION)
TABLE 54 ASIA PACIFIC RICE IN SNACK PELLETS MARKET, BY REGION, 2020-2029 (USD MILLION)
TABLE 55 ASIA PACIFIC TAPIOCO IN SNACK PELLETS MARKET, BY REGION, 2020-2029 (USD MILLION)
TABLE 56 ASIA PACIFIC OTHERS IN SNACK PELLETS MARKET, BY REGION, 2020-2029 (USD MILLION)
TABLE 57 ASIA-PACIFIC SNACK PELLETS MARKET, BY COUNTRY, 2020-2029 (USD MILLION)
TABLE 58 ASIA-PACIFIC SNACK PELLETS MARKET, BY TYPE, 2020-2029 (USD MILLION)
TABLE 59 ASIA-PACIFIC SNACK PELLETS MARKET, BY FORM, 2020-2029 (USD MILLION)
TABLE 60 ASIA-PACIFIC SNACK PELLETS MARKET, BY SHAPE, 2020-2029 (USD MILLION)
TABLE 61 ASIA-PACIFIC SNACK PELLETS MARKET, BY INGREDIENTS, 2020-2029 (USD MILLION)
TABLE 62 ASIA-PACIFIC SNACK PELLETS MARKET, BY PROCESSING METHOD, 2020-2029 (USD MILLION)
TABLE 63 ASIA-PACIFIC NON-GREASY SNACK PELLET IN SNACK PELLETS MARKET, BY PROCESSING METHOD, 2020-2029 (USD MILLION)
TABLE 64 ASIA-PACIFIC SNACK PELLETS MARKET, BY NATURE, 2020-2029 (USD MILLION)
TABLE 65 ASIA-PACIFIC SNACK PELLETS MARKET, BY TECHNIQUE, 2020-2029 (USD MILLION)
TABLE 66 ASIA-PACIFIC SNACK PELLETS MARKET, BY BRAND, 2020-2029 (USD MILLION)
TABLE 67 ASIA-PACIFIC SNACK PELLETS MARKET, BY FLAVOR, 2020-2029 (USD MILLION)
TABLE 68 ASIA-PACIFIC FLAVOR IN SNACK PELLETS MARKET, BY FLAVOR, 2020-2029 (USD MILLION)
TABLE 69 ASIA-PACIFIC SNACK PELLETS MARKET, BY APPLICATION, 2020-2029 (USD MILLION)
TABLE 70 ASIA-PACIFIC SNACK PELLETS MARKET, BY DISTRIBUTION CHANNEL, 2020-2029 (USD MILLION)
TABLE 71 ASIA-PACIFIC INDIRECT IN SNACK PELLETS MARKET, BY DISTRIBUTION CHANNEL, 2020-2029 (USD MILLION)
TABLE 72 ASIA-PACIFIC STORE-BASED RETAILING IN SNACK PELLETS MARKET, BY DISTRIBUTION CHANNEL, 2020-2029 (USD MILLION)
TABLE 73 ASIA-PACIFIC NON-STORE-BASED RETAILING IN SNACK PELLETS MARKET, BY DISTRIBUTION CHANNEL, 2020-2029 (USD MILLION)
TABLE 74 CHINA SNACK PELLETS MARKET, BY TYPE, 2020-2029 (USD MILLION)
TABLE 75 CHINA SNACK PELLETS MARKET, BY FORM, 2020-2029 (USD MILLION)
TABLE 76 CHINA SNACK PELLETS MARKET, BY SHAPE, 2020-2029 (USD MILLION)
TABLE 77 CHINA SNACK PELLETS MARKET, BY INGREDIENTS, 2020-2029 (USD MILLION)
TABLE 78 CHINA SNACK PELLETS MARKET, BY PROCESSING METHOD, 2020-2029 (USD MILLION)
TABLE 79 CHINA NON-GREASY SNACK PELLET IN SNACK PELLETS MARKET, BY PROCESSING METHOD, 2020-2029 (USD MILLION)
TABLE 80 CHINA SNACK PELLETS MARKET, BY NATURE, 2020-2029 (USD MILLION)
TABLE 81 CHINA SNACK PELLETS MARKET, BY TECHNIQUE, 2020-2029 (USD MILLION)
TABLE 82 CHINA SNACK PELLETS MARKET, BY BRAND, 2020-2029 (USD MILLION)
TABLE 83 CHINA SNACK PELLETS MARKET, BY FLAVOR, 2020-2029 (USD MILLION)
TABLE 84 CHINA FLAVOR IN SNACK PELLETS MARKET, BY FLAVOR, 2020-2029 (USD MILLION)
TABLE 85 CHINA SNACK PELLETS MARKET, BY APPLICATION, 2020-2029 (USD MILLION)
TABLE 86 CHINA SNACK PELLETS MARKET, BY DISTRIBUTION CHANNEL, 2020-2029 (USD MILLION)
TABLE 87 CHINA INDIRECT IN SNACK PELLETS MARKET, BY DISTRIBUTION CHANNEL, 2020-2029 (USD MILLION)
TABLE 88 CHINA STORE-BASED RETAILING IN SNACK PELLETS MARKET, BY DISTRIBUTION CHANNEL, 2020-2029 (USD MILLION)
TABLE 89 CHINA NON-STORE-BASED RETAILING IN SNACK PELLETS MARKET, BY DISTRIBUTION CHANNEL, 2020-2029 (USD MILLION)
TABLE 90 INDIA SNACK PELLETS MARKET, BY TYPE, 2020-2029 (USD MILLION)
TABLE 91 INDIA SNACK PELLETS MARKET, BY FORM, 2020-2029 (USD MILLION)
TABLE 92 INDIA SNACK PELLETS MARKET, BY SHAPE, 2020-2029 (USD MILLION)
TABLE 93 INDIA SNACK PELLETS MARKET, BY INGREDIENTS, 2020-2029 (USD MILLION)
TABLE 94 INDIA SNACK PELLETS MARKET, BY PROCESSING METHOD, 2020-2029 (USD MILLION)
TABLE 95 INDIA NON-GREASY SNACK PELLET IN SNACK PELLETS MARKET, BY PROCESSING METHOD, 2020-2029 (USD MILLION)
TABLE 96 INDIA SNACK PELLETS MARKET, BY NATURE, 2020-2029 (USD MILLION)
TABLE 97 INDIA SNACK PELLETS MARKET, BY TECHNIQUE, 2020-2029 (USD MILLION)
TABLE 98 INDIA SNACK PELLETS MARKET, BY BRAND, 2020-2029 (USD MILLION)
TABLE 99 INDIA SNACK PELLETS MARKET, BY FLAVOR, 2020-2029 (USD MILLION)
TABLE 100 INDIA FLAVOR IN SNACK PELLETS MARKET, BY FLAVOR, 2020-2029 (USD MILLION)
TABLE 101 INDIA SNACK PELLETS MARKET, BY APPLICATION, 2020-2029 (USD MILLION)
TABLE 102 INDIA SNACK PELLETS MARKET, BY DISTRIBUTION CHANNEL, 2020-2029 (USD MILLION)
TABLE 103 INDIA INDIRECT IN SNACK PELLETS MARKET, BY DISTRIBUTION CHANNEL, 2020-2029 (USD MILLION)
TABLE 104 INDIA STORE-BASED RETAILING IN SNACK PELLETS MARKET, BY DISTRIBUTION CHANNEL, 2020-2029 (USD MILLION)
TABLE 105 INDIA NON-STORE-BASED RETAILING IN SNACK PELLETS MARKET, BY DISTRIBUTION CHANNEL, 2020-2029 (USD MILLION)
TABLE 106 JAPAN SNACK PELLETS MARKET, BY TYPE, 2020-2029 (USD MILLION)
TABLE 107 JAPAN SNACK PELLETS MARKET, BY FORM, 2020-2029 (USD MILLION)
TABLE 108 JAPAN SNACK PELLETS MARKET, BY SHAPE, 2020-2029 (USD MILLION)
TABLE 109 JAPAN SNACK PELLETS MARKET, BY INGREDIENTS, 2020-2029 (USD MILLION)
TABLE 110 JAPAN SNACK PELLETS MARKET, BY PROCESSING METHOD, 2020-2029 (USD MILLION)
TABLE 111 JAPAN NON-GREASY SNACK PELLET IN SNACK PELLETS MARKET, BY PROCESSING METHOD, 2020-2029 (USD MILLION)
TABLE 112 JAPAN SNACK PELLETS MARKET, BY NATURE, 2020-2029 (USD MILLION)
TABLE 113 JAPAN SNACK PELLETS MARKET, BY TECHNIQUE, 2020-2029 (USD MILLION)
TABLE 114 JAPAN SNACK PELLETS MARKET, BY BRAND, 2020-2029 (USD MILLION)
TABLE 115 JAPAN SNACK PELLETS MARKET, BY FLAVOR, 2020-2029 (USD MILLION)
TABLE 116 JAPAN FLAVOR IN SNACK PELLETS MARKET, BY FLAVOR, 2020-2029 (USD MILLION)
TABLE 117 JAPAN SNACK PELLETS MARKET, BY APPLICATION, 2020-2029 (USD MILLION)
TABLE 118 JAPAN SNACK PELLETS MARKET, BY DISTRIBUTION CHANNEL, 2020-2029 (USD MILLION)
TABLE 119 JAPAN INDIRECT IN SNACK PELLETS MARKET, BY DISTRIBUTION CHANNEL, 2020-2029 (USD MILLION)
TABLE 120 JAPAN STORE-BASED RETAILING IN SNACK PELLETS MARKET, BY DISTRIBUTION CHANNEL, 2020-2029 (USD MILLION)
TABLE 121 JAPAN NON-STORE-BASED RETAILING IN SNACK PELLETS MARKET, BY DISTRIBUTION CHANNEL, 2020-2029 (USD MILLION)
TABLE 122 AUSTRALIA SNACK PELLETS MARKET, BY TYPE, 2020-2029 (USD MILLION)
TABLE 123 AUSTRALIA SNACK PELLETS MARKET, BY FORM, 2020-2029 (USD MILLION)
TABLE 124 AUSTRALIA SNACK PELLETS MARKET, BY SHAPE, 2020-2029 (USD MILLION)
TABLE 125 AUSTRALIA SNACK PELLETS MARKET, BY INGREDIENTS, 2020-2029 (USD MILLION)
TABLE 126 AUSTRALIA SNACK PELLETS MARKET, BY PROCESSING METHOD, 2020-2029 (USD MILLION)
TABLE 127 AUSTRALIA NON-GREASY SNACK PELLET IN SNACK PELLETS MARKET, BY PROCESSING METHOD, 2020-2029 (USD MILLION)
TABLE 128 AUSTRALIA SNACK PELLETS MARKET, BY NATURE, 2020-2029 (USD MILLION)
TABLE 129 AUSTRALIA SNACK PELLETS MARKET, BY TECHNIQUE, 2020-2029 (USD MILLION)
TABLE 130 AUSTRALIA SNACK PELLETS MARKET, BY BRAND, 2020-2029 (USD MILLION)
TABLE 131 AUSTRALIA SNACK PELLETS MARKET, BY FLAVOR, 2020-2029 (USD MILLION)
TABLE 132 AUSTRALIA FLAVOR IN SNACK PELLETS MARKET, BY FLAVOR, 2020-2029 (USD MILLION)
TABLE 133 AUSTRALIA SNACK PELLETS MARKET, BY APPLICATION, 2020-2029 (USD MILLION)
TABLE 134 AUSTRALIA SNACK PELLETS MARKET, BY DISTRIBUTION CHANNEL, 2020-2029 (USD MILLION)
TABLE 135 AUSTRALIA INDIRECT IN SNACK PELLETS MARKET, BY DISTRIBUTION CHANNEL, 2020-2029 (USD MILLION)
TABLE 136 AUSTRALIA STORE-BASED RETAILING IN SNACK PELLETS MARKET, BY DISTRIBUTION CHANNEL, 2020-2029 (USD MILLION)
TABLE 137 AUSTRALIA NON-STORE-BASED RETAILING IN SNACK PELLETS MARKET, BY DISTRIBUTION CHANNEL, 2020-2029 (USD MILLION)
TABLE 138 SOUTH KOREA SNACK PELLETS MARKET, BY TYPE, 2020-2029 (USD MILLION)
TABLE 139 SOUTH KOREA SNACK PELLETS MARKET, BY FORM, 2020-2029 (USD MILLION)
TABLE 140 SOUTH KOREA SNACK PELLETS MARKET, BY SHAPE, 2020-2029 (USD MILLION)
TABLE 141 SOUTH KOREA SNACK PELLETS MARKET, BY INGREDIENTS, 2020-2029 (USD MILLION)
TABLE 142 SOUTH KOREA SNACK PELLETS MARKET, BY PROCESSING METHOD, 2020-2029 (USD MILLION)
TABLE 143 SOUTH KOREA NON-GREASY SNACK PELLET IN SNACK PELLETS MARKET, BY PROCESSING METHOD, 2020-2029 (USD MILLION)
TABLE 144 SOUTH KOREA SNACK PELLETS MARKET, BY NATURE, 2020-2029 (USD MILLION)
TABLE 145 SOUTH KOREA SNACK PELLETS MARKET, BY TECHNIQUE, 2020-2029 (USD MILLION)
TABLE 146 SOUTH KOREA SNACK PELLETS MARKET, BY BRAND, 2020-2029 (USD MILLION)
TABLE 147 SOUTH KOREA SNACK PELLETS MARKET, BY FLAVOR, 2020-2029 (USD MILLION)
TABLE 148 SOUTH KOREA FLAVOR IN SNACK PELLETS MARKET, BY FLAVOR, 2020-2029 (USD MILLION)
TABLE 149 SOUTH KOREA SNACK PELLETS MARKET, BY APPLICATION, 2020-2029 (USD MILLION)
TABLE 150 SOUTH KOREA SNACK PELLETS MARKET, BY DISTRIBUTION CHANNEL, 2020-2029 (USD MILLION)
TABLE 151 SOUTH KOREA INDIRECT IN SNACK PELLETS MARKET, BY DISTRIBUTION CHANNEL, 2020-2029 (USD MILLION)
TABLE 152 SOUTH KOREA STORE-BASED RETAILING IN SNACK PELLETS MARKET, BY DISTRIBUTION CHANNEL, 2020-2029 (USD MILLION)
TABLE 153 SOUTH KOREA NON-STORE-BASED RETAILING IN SNACK PELLETS MARKET, BY DISTRIBUTION CHANNEL, 2020-2029 (USD MILLION)
TABLE 154 SINGAPORE SNACK PELLETS MARKET, BY TYPE, 2020-2029 (USD MILLION)
TABLE 155 SINGAPORE SNACK PELLETS MARKET, BY FORM, 2020-2029 (USD MILLION)
TABLE 156 SINGAPORE SNACK PELLETS MARKET, BY SHAPE, 2020-2029 (USD MILLION)
TABLE 157 SINGAPORE SNACK PELLETS MARKET, BY INGREDIENTS, 2020-2029 (USD MILLION)
TABLE 158 SINGAPORE SNACK PELLETS MARKET, BY PROCESSING METHOD, 2020-2029 (USD MILLION)
TABLE 159 SINGAPORE NON-GREASY SNACK PELLET IN SNACK PELLETS MARKET, BY PROCESSING METHOD, 2020-2029 (USD MILLION)
TABLE 160 SINGAPORE SNACK PELLETS MARKET, BY NATURE, 2020-2029 (USD MILLION)
TABLE 161 SINGAPORE SNACK PELLETS MARKET, BY TECHNIQUE, 2020-2029 (USD MILLION)
TABLE 162 SINGAPORE SNACK PELLETS MARKET, BY BRAND, 2020-2029 (USD MILLION)
TABLE 163 SINGAPORE SNACK PELLETS MARKET, BY FLAVOR, 2020-2029 (USD MILLION)
TABLE 164 SINGAPORE FLAVOR IN SNACK PELLETS MARKET, BY FLAVOR, 2020-2029 (USD MILLION)
TABLE 165 SINGAPORE SNACK PELLETS MARKET, BY APPLICATION, 2020-2029 (USD MILLION)
TABLE 166 SINGAPORE SNACK PELLETS MARKET, BY DISTRIBUTION CHANNEL, 2020-2029 (USD MILLION)
TABLE 167 SINGAPORE INDIRECT IN SNACK PELLETS MARKET, BY DISTRIBUTION CHANNEL, 2020-2029 (USD MILLION)
TABLE 168 SINGAPORE STORE-BASED RETAILING IN SNACK PELLETS MARKET, BY DISTRIBUTION CHANNEL, 2020-2029 (USD MILLION)
TABLE 169 SINGAPORE NON-STORE-BASED RETAILING IN SNACK PELLETS MARKET, BY DISTRIBUTION CHANNEL, 2020-2029 (USD MILLION)
TABLE 170 NEW ZEALAND SNACK PELLETS MARKET, BY TYPE, 2020-2029 (USD MILLION)
TABLE 171 NEW ZEALAND SNACK PELLETS MARKET, BY FORM, 2020-2029 (USD MILLION)
TABLE 172 NEW ZEALAND SNACK PELLETS MARKET, BY SHAPE, 2020-2029 (USD MILLION)
TABLE 173 NEW ZEALAND SNACK PELLETS MARKET, BY INGREDIENTS, 2020-2029 (USD MILLION)
TABLE 174 NEW ZEALAND SNACK PELLETS MARKET, BY PROCESSING METHOD, 2020-2029 (USD MILLION)
TABLE 175 NEW ZEALAND NON-GREASY SNACK PELLET IN SNACK PELLETS MARKET, BY PROCESSING METHOD, 2020-2029 (USD MILLION)
TABLE 176 NEW ZEALAND SNACK PELLETS MARKET, BY NATURE, 2020-2029 (USD MILLION)
TABLE 177 NEW ZEALAND SNACK PELLETS MARKET, BY TECHNIQUE, 2020-2029 (USD MILLION)
TABLE 178 NEW ZEALAND SNACK PELLETS MARKET, BY BRAND, 2020-2029 (USD MILLION)
TABLE 179 NEW ZEALAND SNACK PELLETS MARKET, BY FLAVOR, 2020-2029 (USD MILLION)
TABLE 180 NEW ZEALAND FLAVOR IN SNACK PELLETS MARKET, BY FLAVOR, 2020-2029 (USD MILLION)
TABLE 181 NEW ZEALAND SNACK PELLETS MARKET, BY APPLICATION, 2020-2029 (USD MILLION)
TABLE 182 NEW ZEALAND SNACK PELLETS MARKET, BY DISTRIBUTION CHANNEL, 2020-2029 (USD MILLION)
TABLE 183 NEW ZEALAND INDIRECT IN SNACK PELLETS MARKET, BY DISTRIBUTION CHANNEL, 2020-2029 (USD MILLION)
TABLE 184 NEW ZEALAND STORE-BASED RETAILING IN SNACK PELLETS MARKET, BY DISTRIBUTION CHANNEL, 2020-2029 (USD MILLION)
TABLE 185 NEW ZEALAND NON-STORE-BASED RETAILING IN SNACK PELLETS MARKET, BY DISTRIBUTION CHANNEL, 2020-2029 (USD MILLION)
TABLE 186 THAILAND SNACK PELLETS MARKET, BY TYPE, 2020-2029 (USD MILLION)
TABLE 187 THAILAND SNACK PELLETS MARKET, BY FORM, 2020-2029 (USD MILLION)
TABLE 188 THAILAND SNACK PELLETS MARKET, BY SHAPE, 2020-2029 (USD MILLION)
TABLE 189 THAILAND SNACK PELLETS MARKET, BY INGREDIENTS, 2020-2029 (USD MILLION)
TABLE 190 THAILAND SNACK PELLETS MARKET, BY PROCESSING METHOD, 2020-2029 (USD MILLION)
TABLE 191 THAILAND NON-GREASY SNACK PELLET IN SNACK PELLETS MARKET, BY PROCESSING METHOD, 2020-2029 (USD MILLION)
TABLE 192 THAILAND SNACK PELLETS MARKET, BY NATURE, 2020-2029 (USD MILLION)
TABLE 193 THAILAND SNACK PELLETS MARKET, BY TECHNIQUE, 2020-2029 (USD MILLION)
TABLE 194 THAILAND SNACK PELLETS MARKET, BY BRAND, 2020-2029 (USD MILLION)
TABLE 195 THAILAND SNACK PELLETS MARKET, BY FLAVOR, 2020-2029 (USD MILLION)
TABLE 196 THAILAND FLAVOR IN SNACK PELLETS MARKET, BY FLAVOR, 2020-2029 (USD MILLION)
TABLE 197 THAILAND SNACK PELLETS MARKET, BY APPLICATION, 2020-2029 (USD MILLION)
TABLE 198 THAILAND SNACK PELLETS MARKET, BY DISTRIBUTION CHANNEL, 2020-2029 (USD MILLION)
TABLE 199 THAILAND INDIRECT IN SNACK PELLETS MARKET, BY DISTRIBUTION CHANNEL, 2020-2029 (USD MILLION)
TABLE 200 THAILAND STORE-BASED RETAILING IN SNACK PELLETS MARKET, BY DISTRIBUTION CHANNEL, 2020-2029 (USD MILLION)
TABLE 201 THAILAND NON-STORE-BASED RETAILING IN SNACK PELLETS MARKET, BY DISTRIBUTION CHANNEL, 2020-2029 (USD MILLION)
TABLE 202 INDONESIA SNACK PELLETS MARKET, BY TYPE, 2020-2029 (USD MILLION)
TABLE 203 INDONESIA SNACK PELLETS MARKET, BY FORM, 2020-2029 (USD MILLION)
TABLE 204 INDONESIA SNACK PELLETS MARKET, BY SHAPE, 2020-2029 (USD MILLION)
TABLE 205 INDONESIA SNACK PELLETS MARKET, BY INGREDIENTS, 2020-2029 (USD MILLION)
TABLE 206 INDONESIA SNACK PELLETS MARKET, BY PROCESSING METHOD, 2020-2029 (USD MILLION)
TABLE 207 INDONESIA NON-GREASY SNACK PELLET IN SNACK PELLETS MARKET, BY PROCESSING METHOD, 2020-2029 (USD MILLION)
TABLE 208 INDONESIA SNACK PELLETS MARKET, BY NATURE, 2020-2029 (USD MILLION)
TABLE 209 INDONESIA SNACK PELLETS MARKET, BY TECHNIQUE, 2020-2029 (USD MILLION)
TABLE 210 INDONESIA SNACK PELLETS MARKET, BY BRAND, 2020-2029 (USD MILLION)
TABLE 211 INDONESIA SNACK PELLETS MARKET, BY FLAVOR, 2020-2029 (USD MILLION)
TABLE 212 INDONESIA FLAVOR IN SNACK PELLETS MARKET, BY FLAVOR, 2020-2029 (USD MILLION)
TABLE 213 INDONESIA SNACK PELLETS MARKET, BY APPLICATION, 2020-2029 (USD MILLION)
TABLE 214 INDONESIA SNACK PELLETS MARKET, BY DISTRIBUTION CHANNEL, 2020-2029 (USD MILLION)
TABLE 215 INDONESIA INDIRECT IN SNACK PELLETS MARKET, BY DISTRIBUTION CHANNEL, 2020-2029 (USD MILLION)
TABLE 216 INDONESIA STORE-BASED RETAILING IN SNACK PELLETS MARKET, BY DISTRIBUTION CHANNEL, 2020-2029 (USD MILLION)
TABLE 217 INDONESIA NON-STORE-BASED RETAILING IN SNACK PELLETS MARKET, BY DISTRIBUTION CHANNEL, 2020-2029 (USD MILLION)
TABLE 218 MALAYSIA SNACK PELLETS MARKET, BY TYPE, 2020-2029 (USD MILLION)
TABLE 219 MALAYSIA SNACK PELLETS MARKET, BY FORM, 2020-2029 (USD MILLION)
TABLE 220 MALAYSIA SNACK PELLETS MARKET, BY SHAPE, 2020-2029 (USD MILLION)
TABLE 221 MALAYSIA SNACK PELLETS MARKET, BY INGREDIENTS, 2020-2029 (USD MILLION)
TABLE 222 MALAYSIA SNACK PELLETS MARKET, BY PROCESSING METHOD, 2020-2029 (USD MILLION)
TABLE 223 MALAYSIA NON-GREASY SNACK PELLET IN SNACK PELLETS MARKET, BY PROCESSING METHOD, 2020-2029 (USD MILLION)
TABLE 224 MALAYSIA SNACK PELLETS MARKET, BY NATURE, 2020-2029 (USD MILLION)
TABLE 225 MALAYSIA SNACK PELLETS MARKET, BY TECHNIQUE, 2020-2029 (USD MILLION)
TABLE 226 MALAYSIA SNACK PELLETS MARKET, BY BRAND, 2020-2029 (USD MILLION)
TABLE 227 MALAYSIA SNACK PELLETS MARKET, BY FLAVOR, 2020-2029 (USD MILLION)
TABLE 228 MALAYSIA FLAVOR IN SNACK PELLETS MARKET, BY FLAVOR, 2020-2029 (USD MILLION)
TABLE 229 MALAYSIA SNACK PELLETS MARKET, BY APPLICATION, 2020-2029 (USD MILLION)
TABLE 230 MALAYSIA SNACK PELLETS MARKET, BY DISTRIBUTION CHANNEL, 2020-2029 (USD MILLION)
TABLE 231 MALAYSIA INDIRECT IN SNACK PELLETS MARKET, BY DISTRIBUTION CHANNEL, 2020-2029 (USD MILLION)
TABLE 232 MALAYSIA STORE-BASED RETAILING IN SNACK PELLETS MARKET, BY DISTRIBUTION CHANNEL, 2020-2029 (USD MILLION)
TABLE 233 MALAYSIA NON-STORE-BASED RETAILING IN SNACK PELLETS MARKET, BY DISTRIBUTION CHANNEL, 2020-2029 (USD MILLION)
TABLE 234 PHILIPPINES SNACK PELLETS MARKET, BY TYPE, 2020-2029 (USD MILLION)
TABLE 235 PHILIPPINES SNACK PELLETS MARKET, BY FORM, 2020-2029 (USD MILLION)
TABLE 236 PHILIPPINES SNACK PELLETS MARKET, BY SHAPE, 2020-2029 (USD MILLION)
TABLE 237 PHILIPPINES SNACK PELLETS MARKET, BY INGREDIENTS, 2020-2029 (USD MILLION)
TABLE 238 PHILIPPINES SNACK PELLETS MARKET, BY PROCESSING METHOD, 2020-2029 (USD MILLION)
TABLE 239 PHILIPPINES NON-GREASY SNACK PELLET IN SNACK PELLETS MARKET, BY PROCESSING METHOD, 2020-2029 (USD MILLION)
TABLE 240 PHILIPPINES SNACK PELLETS MARKET, BY NATURE, 2020-2029 (USD MILLION)
TABLE 241 PHILIPPINES SNACK PELLETS MARKET, BY TECHNIQUE, 2020-2029 (USD MILLION)
TABLE 242 PHILIPPINES SNACK PELLETS MARKET, BY BRAND, 2020-2029 (USD MILLION)
TABLE 243 PHILIPPINES SNACK PELLETS MARKET, BY FLAVOR, 2020-2029 (USD MILLION)
TABLE 244 PHILIPPINES FLAVOR IN SNACK PELLETS MARKET, BY FLAVOR, 2020-2029 (USD MILLION)
TABLE 245 PHILIPPINES SNACK PELLETS MARKET, BY APPLICATION, 2020-2029 (USD MILLION)
TABLE 246 PHILIPPINES SNACK PELLETS MARKET, BY DISTRIBUTION CHANNEL, 2020-2029 (USD MILLION)
TABLE 247 PHILIPPINES INDIRECT IN SNACK PELLETS MARKET, BY DISTRIBUTION CHANNEL, 2020-2029 (USD MILLION)
TABLE 248 PHILIPPINES STORE-BASED RETAILING IN SNACK PELLETS MARKET, BY DISTRIBUTION CHANNEL, 2020-2029 (USD MILLION)
TABLE 249 PHILIPPINES NON-STORE-BASED RETAILING IN SNACK PELLETS MARKET, BY DISTRIBUTION CHANNEL, 2020-2029 (USD MILLION)
TABLE 250 VIETNAM SNACK PELLETS MARKET, BY TYPE, 2020-2029 (USD MILLION)
TABLE 251 VIETNAM SNACK PELLETS MARKET, BY FORM, 2020-2029 (USD MILLION)
TABLE 252 VIETNAM SNACK PELLETS MARKET, BY SHAPE, 2020-2029 (USD MILLION)
TABLE 253 VIETNAM SNACK PELLETS MARKET, BY INGREDIENTS, 2020-2029 (USD MILLION)
TABLE 254 VIETNAM SNACK PELLETS MARKET, BY PROCESSING METHOD, 2020-2029 (USD MILLION)
TABLE 255 VIETNAM NON-GREASY SNACK PELLET IN SNACK PELLETS MARKET, BY PROCESSING METHOD, 2020-2029 (USD MILLION)
TABLE 256 VIETNAM SNACK PELLETS MARKET, BY NATURE, 2020-2029 (USD MILLION)
TABLE 257 VIETNAM SNACK PELLETS MARKET, BY TECHNIQUE, 2020-2029 (USD MILLION)
TABLE 258 VIETNAM SNACK PELLETS MARKET, BY BRAND, 2020-2029 (USD MILLION)
TABLE 259 VIETNAM SNACK PELLETS MARKET, BY FLAVOR, 2020-2029 (USD MILLION)
TABLE 260 VIETNAM FLAVOR IN SNACK PELLETS MARKET, BY FLAVOR, 2020-2029 (USD MILLION)
TABLE 261 VIETNAM SNACK PELLETS MARKET, BY APPLICATION, 2020-2029 (USD MILLION)
TABLE 262 VIETNAM SNACK PELLETS MARKET, BY DISTRIBUTION CHANNEL, 2020-2029 (USD MILLION)
TABLE 263 VIETNAM INDIRECT IN SNACK PELLETS MARKET, BY DISTRIBUTION CHANNEL, 2020-2029 (USD MILLION)
TABLE 264 VIETNAM STORE-BASED RETAILING IN SNACK PELLETS MARKET, BY DISTRIBUTION CHANNEL, 2020-2029 (USD MILLION)
TABLE 265 VIETNAM NON-STORE-BASED RETAILING IN SNACK PELLETS MARKET, BY DISTRIBUTION CHANNEL, 2020-2029 (USD MILLION)
TABLE 266 REST OF ASIA-PACIFIC SNACK PELLETS MARKET, BY TYPE, 2020-2029 (USD MILLION)
List of Figure
FIGURE 1 ASIA PACIFIC SNACK PELLETS MARKET: SEGMENTATION
FIGURE 2 ASIA PACIFIC SNACK PELLETS MARKET: DATA TRIANGULATION
FIGURE 3 ASIA PACIFIC SNACK PELLETS MARKET: DROC ANALYSIS
FIGURE 4 ASIA PACIFIC SNACK PELLETS MARKET: REGIONAL VS COUNTRY MARKET ANALYSIS
FIGURE 5 ASIA PACIFIC SNACK PELLETS MARKET: COMPANY RESEARCH ANALYSIS
FIGURE 6 ASIA PACIFIC SNACK PELLETS MARKET: INTERVIEW DEMOGRAPHICS
FIGURE 7 ASIA PACIFIC SNACK PELLETS MARKET: DBMR MARKET POSITION GRID
FIGURE 8 ASIA PACIFIC SNACK PELLETS MARKET: MARKET END-USER COVERAGE GRID
FIGURE 9 ASIA PACIFIC SNACK PELLETS MARKET: VENDOR SHARE ANALYSIS
FIGURE 10 ASIA PACIFIC SNACK PELLETS MARKET: SEGMENTATION
FIGURE 11 NORTH AMERICA IS EXPECTED TO DOMINATE THE FIGURE ASIA PACIFIC SNACK PELLETS MARKET AND IS GROWING WITH THE HIGHEST CAGR IN THE FORECAST PERIOD OF 2022 TO 2029
FIGURE 12 INCREASE IN DEMAND FOR SAVORY SNACKS IS DRIVING THE ASIA PACIFIC SNACK PELLETS MARKET IN THE FORECAST PERIOD.
FIGURE 13 TYPE SEGMENT IS EXPECTED TO ACCOUNT FOR THE LARGEST SHARE OF THE ASIA PACIFIC SNACK PELLETS MARKET IN 2022 & 2029
FIGURE 14 ASIA PACIFIC SNACK PELLETS MARKET: FACTORS AFFECTING NEW PRODUCT LAUNCHES STRATEGY
FIGURE 15 SUPPLY CHAIN ANALYSIS OF ASIA PACIFIC SNACK PELLETS MARKET
FIGURE 16 VALUE CHAIN ANALYSIS OF ASIA PACIFIC SNACK PELLETS MARKET
FIGURE 17 DRIVERS, RESTRAINTS, OPPORTUNITIES, AND CHALLENGES OF SNACK PELLETS MARKET
FIGURE 18 ASIA PACIFIC SNACK PELLETS MARKET: BY TYPE, 2021
FIGURE 19 ASIA PACIFIC SNACK PELLETS MARKET, BY FORM, 2021
FIGURE 20 ASIA PACIFIC SNACK PELLETS MARKET, BY BRAND, 2021
FIGURE 21 ASIA PACIFIC SNACK PELLETS MARKET, BY APPLICATION, 2021
FIGURE 22 ASIA PACIFIC SNACK PELLETS MARKET: BY PROCESSING METHOD, 2021
FIGURE 23 ASIA PACIFIC SNACK PELLETS MARKET: BY NATURE, 2021
FIGURE 24 ASIA PACIFIC SNACK PELLETS MARKET: BY FLAVOR, 2021
FIGURE 25 ASIA PACIFIC SNACK PELLETS MARKET: BY DISTRIBUTION CHANNEL, 2021
FIGURE 26 ASIA PACIFIC SNACK PELLETS MARKET: BY TECHNIQUE, 2021
FIGURE 27 ASIA PACIFIC SNACK PELLETS MARKET: BY SHAPE, 2021
FIGURE 28 ASIA PACIFIC SNACK PELLETS MARKET: BY INGREDIENTS, 2021
FIGURE 29 ASIA-PACIFIC SNACK PELLETS MARKET: SNAPSHOT (2021)
FIGURE 30 ASIA-PACIFIC SNACK PELLETS MARKET: BY COUNTRY (2021)
FIGURE 31 ASIA-PACIFIC SNACK PELLETS MARKET: BY COUNTRY (2022 & 2029)
FIGURE 32 ASIA-PACIFIC SNACK PELLETS MARKET: BY COUNTRY (2021 & 2029)
FIGURE 33 ASIA-PACIFIC SNACK PELLETS MARKET: BY TYPE (2022 & 2029)
FIGURE 34 ASIA PACIFIC SNACK PELLETS MARKET: COMPANY SHARE 2021 (%)
Asia Pacific Snack Pellets Market, Supply Chain Analysis and Ecosystem Framework
To support market growth and help clients navigate the impact of geopolitical shifts, DBMR has integrated in-depth supply chain analysis into its Asia Pacific Snack Pellets Market research reports. This addition empowers clients to respond effectively to global changes affecting their industries. The supply chain analysis section includes detailed insights such as Asia Pacific Snack Pellets Market consumption and production by country, price trend analysis, the impact of tariffs and geopolitical developments, and import and export trends by country and HSN code. It also highlights major suppliers with data on production capacity and company profiles, as well as key importers and exporters. In addition to research, DBMR offers specialized supply chain consulting services backed by over a decade of experience, providing solutions like supplier discovery, supplier risk assessment, price trend analysis, impact evaluation of inflation and trade route changes, and comprehensive market trend analysis.
Data collection and base year analysis are done using data collection modules with large sample sizes. The stage includes obtaining market information or related data through various sources and strategies. It includes examining and planning all the data acquired from the past in advance. It likewise envelops the examination of information inconsistencies seen across different information sources. The market data is analysed and estimated using market statistical and coherent models. Also, market share analysis and key trend analysis are the major success factors in the market report. To know more, please request an analyst call or drop down your inquiry.
The key research methodology used by DBMR research team is data triangulation which involves data mining, analysis of the impact of data variables on the market and primary (industry expert) validation. Data models include Vendor Positioning Grid, Market Time Line Analysis, Market Overview and Guide, Company Positioning Grid, Patent Analysis, Pricing Analysis, Company Market Share Analysis, Standards of Measurement, Global versus Regional and Vendor Share Analysis. To know more about the research methodology, drop in an inquiry to speak to our industry experts.
Data Bridge Market Research is a leader in advanced formative research. We take pride in servicing our existing and new customers with data and analysis that match and suits their goal. The report can be customized to include price trend analysis of target brands understanding the market for additional countries (ask for the list of countries), clinical trial results data, literature review, refurbished market and product base analysis. Market analysis of target competitors can be analyzed from technology-based analysis to market portfolio strategies. We can add as many competitors that you require data about in the format and data style you are looking for. Our team of analysts can also provide you data in crude raw excel files pivot tables (Fact book) or can assist you in creating presentations from the data sets available in the report.


